Cities with the Highest Percentage of Population Employed in Real Estate, Rental & Leasing in Arkansas
RELATED REPORTS & OPTIONS
Real Estate, Rental & Leasing
Arkansas
Compare Cities
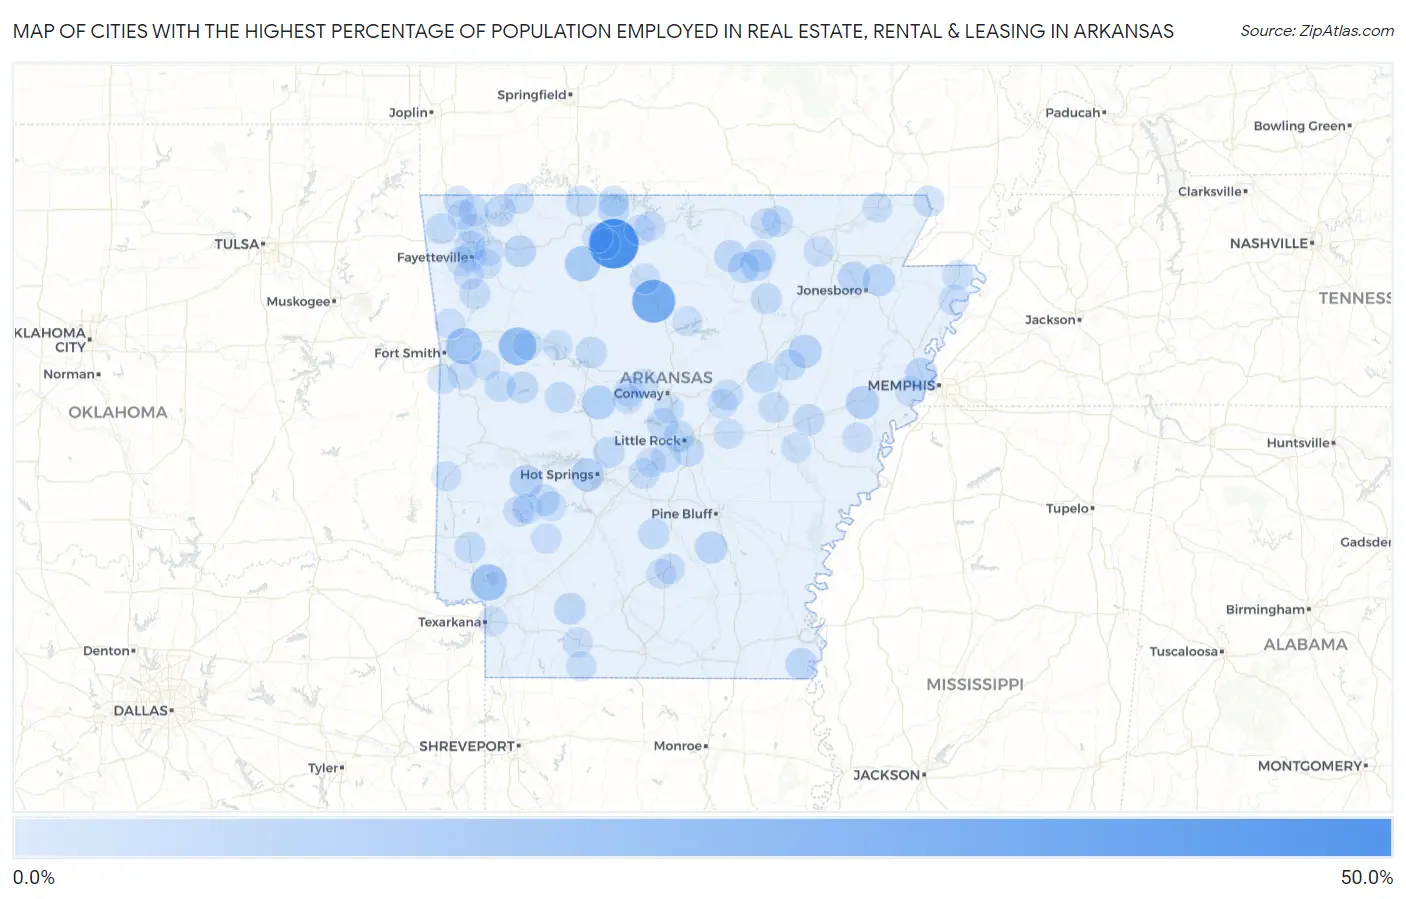
Map of Cities with the Highest Percentage of Population Employed in Real Estate, Rental & Leasing in Arkansas
0.0%
50.0%
Cities with the Highest Percentage of Population Employed in Real Estate, Rental & Leasing in Arkansas
| City | % Employed | vs State | vs National | |
| 1. | Everton | 44.0% | 1.4%(+42.6)#1 | 1.9%(+42.1)#29 |
| 2. | Crystal Springs | 33.1% | 1.4%(+31.7)#2 | 1.9%(+31.2)#58 |
| 3. | Dennard | 29.4% | 1.4%(+28.0)#3 | 1.9%(+27.5)#68 |
| 4. | Denning | 17.9% | 1.4%(+16.5)#4 | 1.9%(+16.0)#187 |
| 5. | Yarborough Landing | 15.0% | 1.4%(+13.6)#5 | 1.9%(+13.1)#249 |
| 6. | Kibler | 14.7% | 1.4%(+13.3)#6 | 1.9%(+12.8)#258 |
| 7. | Jasper | 12.4% | 1.4%(+11.0)#7 | 1.9%(+10.5)#354 |
| 8. | Casa | 9.5% | 1.4%(+8.14)#8 | 1.9%(+7.63)#589 |
| 9. | Madison | 8.5% | 1.4%(+7.13)#9 | 1.9%(+6.62)#721 |
| 10. | Piney | 8.3% | 1.4%(+6.87)#10 | 1.9%(+6.36)#766 |
| 11. | Norman | 8.0% | 1.4%(+6.60)#11 | 1.9%(+6.09)#831 |
| 12. | Tupelo | 7.9% | 1.4%(+6.51)#12 | 1.9%(+6.00)#843 |
| 13. | Woodlawn | 6.9% | 1.4%(+5.51)#13 | 1.9%(+5.00)#1,070 |
| 14. | Sunset | 6.5% | 1.4%(+5.14)#14 | 1.9%(+4.63)#1,182 |
| 15. | Bono | 6.1% | 1.4%(+4.70)#15 | 1.9%(+4.19)#1,341 |
| 16. | Brookland | 6.1% | 1.4%(+4.67)#16 | 1.9%(+4.16)#1,350 |
| 17. | Huntsville | 5.9% | 1.4%(+4.54)#17 | 1.9%(+4.03)#1,410 |
| 18. | Sidney | 5.8% | 1.4%(+4.39)#18 | 1.9%(+3.88)#1,470 |
| 19. | Eudora | 5.7% | 1.4%(+4.31)#19 | 1.9%(+3.80)#1,503 |
| 20. | Melbourne | 5.5% | 1.4%(+4.12)#20 | 1.9%(+3.61)#1,592 |
| 21. | Willisville | 5.4% | 1.4%(+4.04)#21 | 1.9%(+3.53)#1,624 |
| 22. | South Lead Hill | 5.3% | 1.4%(+3.88)#22 | 1.9%(+3.37)#1,712 |
| 23. | Hot Springs Village | 5.0% | 1.4%(+3.64)#23 | 1.9%(+3.13)#1,846 |
| 24. | Blue Mountain | 5.0% | 1.4%(+3.62)#24 | 1.9%(+3.11)#1,864 |
| 25. | Brinkley | 4.9% | 1.4%(+3.54)#25 | 1.9%(+3.03)#1,904 |
| 26. | Dover | 4.9% | 1.4%(+3.54)#26 | 1.9%(+3.03)#1,906 |
| 27. | West Point | 4.9% | 1.4%(+3.50)#27 | 1.9%(+2.99)#1,941 |
| 28. | Natural Steps | 4.8% | 1.4%(+3.38)#28 | 1.9%(+2.87)#2,010 |
| 29. | Augusta | 4.7% | 1.4%(+3.36)#29 | 1.9%(+2.85)#2,026 |
| 30. | Ozark Acres | 4.7% | 1.4%(+3.33)#30 | 1.9%(+2.82)#2,054 |
| 31. | Evening Shade | 4.7% | 1.4%(+3.29)#31 | 1.9%(+2.78)#2,082 |
| 32. | Cammack Village | 4.6% | 1.4%(+3.23)#32 | 1.9%(+2.72)#2,131 |
| 33. | Omaha | 4.5% | 1.4%(+3.16)#33 | 1.9%(+2.65)#2,178 |
| 34. | Mount Pleasant | 4.5% | 1.4%(+3.10)#34 | 1.9%(+2.59)#2,227 |
| 35. | Glenwood | 4.3% | 1.4%(+2.90)#35 | 1.9%(+2.39)#2,376 |
| 36. | Lost Bridge Village | 4.2% | 1.4%(+2.82)#36 | 1.9%(+2.31)#2,443 |
| 37. | Lockesburg | 4.1% | 1.4%(+2.72)#37 | 1.9%(+2.21)#2,550 |
| 38. | Carthage | 4.1% | 1.4%(+2.70)#38 | 1.9%(+2.19)#2,576 |
| 39. | Danville | 4.0% | 1.4%(+2.66)#39 | 1.9%(+2.16)#2,611 |
| 40. | Springtown | 4.0% | 1.4%(+2.62)#40 | 1.9%(+2.11)#2,661 |
| 41. | Sweet Home | 3.9% | 1.4%(+2.47)#41 | 1.9%(+1.96)#2,819 |
| 42. | Hardy | 3.8% | 1.4%(+2.44)#42 | 1.9%(+1.93)#2,855 |
| 43. | St Francis | 3.8% | 1.4%(+2.43)#43 | 1.9%(+1.92)#2,869 |
| 44. | Booneville | 3.8% | 1.4%(+2.40)#44 | 1.9%(+1.89)#2,908 |
| 45. | Moorefield | 3.8% | 1.4%(+2.39)#45 | 1.9%(+1.88)#2,920 |
| 46. | Diamond City | 3.8% | 1.4%(+2.37)#46 | 1.9%(+1.86)#2,945 |
| 47. | Johnson | 3.7% | 1.4%(+2.34)#47 | 1.9%(+1.83)#2,973 |
| 48. | Winslow | 3.7% | 1.4%(+2.32)#48 | 1.9%(+1.81)#3,014 |
| 49. | Newhope | 3.7% | 1.4%(+2.29)#49 | 1.9%(+1.78)#3,051 |
| 50. | Beebe | 3.6% | 1.4%(+2.20)#50 | 1.9%(+1.69)#3,179 |
| 51. | Des Arc | 3.5% | 1.4%(+2.15)#51 | 1.9%(+1.64)#3,250 |
| 52. | Daisy | 3.5% | 1.4%(+2.11)#52 | 1.9%(+1.60)#3,302 |
| 53. | Haskell | 3.3% | 1.4%(+1.94)#53 | 1.9%(+1.43)#3,540 |
| 54. | Bella Vista | 3.2% | 1.4%(+1.86)#54 | 1.9%(+1.35)#3,702 |
| 55. | Oppelo | 3.2% | 1.4%(+1.82)#55 | 1.9%(+1.31)#3,762 |
| 56. | Cherokee Village | 3.1% | 1.4%(+1.73)#56 | 1.9%(+1.22)#3,918 |
| 57. | Kirby | 3.0% | 1.4%(+1.61)#57 | 1.9%(+1.10)#4,128 |
| 58. | Valley Springs | 3.0% | 1.4%(+1.60)#58 | 1.9%(+1.09)#4,150 |
| 59. | Lowell | 2.9% | 1.4%(+1.54)#59 | 1.9%(+1.03)#4,290 |
| 60. | Marshall | 2.9% | 1.4%(+1.53)#60 | 1.9%(+1.02)#4,296 |
| 61. | Summit | 2.9% | 1.4%(+1.49)#61 | 1.9%(+0.977)#4,390 |
| 62. | Luxora | 2.8% | 1.4%(+1.45)#62 | 1.9%(+0.941)#4,460 |
| 63. | Black Rock | 2.8% | 1.4%(+1.45)#63 | 1.9%(+0.938)#4,468 |
| 64. | Edmondson | 2.8% | 1.4%(+1.45)#64 | 1.9%(+0.938)#4,471 |
| 65. | Magnolia | 2.8% | 1.4%(+1.44)#65 | 1.9%(+0.927)#4,501 |
| 66. | Flippin | 2.7% | 1.4%(+1.35)#66 | 1.9%(+0.843)#4,698 |
| 67. | Marianna | 2.6% | 1.4%(+1.19)#67 | 1.9%(+0.680)#5,148 |
| 68. | Holiday Island | 2.6% | 1.4%(+1.18)#68 | 1.9%(+0.667)#5,184 |
| 69. | Fayetteville | 2.5% | 1.4%(+1.16)#69 | 1.9%(+0.653)#5,221 |
| 70. | Delight | 2.5% | 1.4%(+1.15)#70 | 1.9%(+0.640)#5,262 |
| 71. | Alexander | 2.5% | 1.4%(+1.14)#71 | 1.9%(+0.626)#5,291 |
| 72. | Bellefonte | 2.5% | 1.4%(+1.11)#72 | 1.9%(+0.596)#5,365 |
| 73. | Lonoke | 2.5% | 1.4%(+1.10)#73 | 1.9%(+0.590)#5,379 |
| 74. | Fordyce | 2.4% | 1.4%(+1.01)#74 | 1.9%(+0.501)#5,660 |
| 75. | Little Flock | 2.4% | 1.4%(+1.01)#75 | 1.9%(+0.498)#5,676 |
| 76. | Hackett | 2.4% | 1.4%(+1.01)#76 | 1.9%(+0.496)#5,678 |
| 77. | Emerson | 2.3% | 1.4%(+0.961)#77 | 1.9%(+0.452)#5,834 |
| 78. | Farmington | 2.3% | 1.4%(+0.881)#78 | 1.9%(+0.371)#6,098 |
| 79. | Ward | 2.2% | 1.4%(+0.850)#79 | 1.9%(+0.341)#6,203 |
| 80. | Elkins | 2.2% | 1.4%(+0.848)#80 | 1.9%(+0.339)#6,209 |
| 81. | Plumerville | 2.2% | 1.4%(+0.846)#81 | 1.9%(+0.337)#6,216 |
| 82. | Thornton | 2.2% | 1.4%(+0.840)#82 | 1.9%(+0.331)#6,235 |
| 83. | Mayflower | 2.2% | 1.4%(+0.798)#83 | 1.9%(+0.288)#6,395 |
| 84. | Benton | 2.2% | 1.4%(+0.788)#84 | 1.9%(+0.278)#6,439 |
| 85. | Blytheville | 2.2% | 1.4%(+0.782)#85 | 1.9%(+0.272)#6,456 |
| 86. | Lamar | 2.2% | 1.4%(+0.781)#86 | 1.9%(+0.272)#6,458 |
| 87. | Coal Hill | 2.1% | 1.4%(+0.754)#87 | 1.9%(+0.245)#6,544 |
| 88. | Charleston | 2.1% | 1.4%(+0.749)#88 | 1.9%(+0.239)#6,564 |
| 89. | Cedarville | 2.1% | 1.4%(+0.713)#89 | 1.9%(+0.203)#6,684 |
| 90. | Texarkana | 2.1% | 1.4%(+0.698)#90 | 1.9%(+0.189)#6,738 |
| 91. | Clarendon | 2.1% | 1.4%(+0.670)#91 | 1.9%(+0.161)#6,843 |
| 92. | Greenwood | 2.0% | 1.4%(+0.632)#92 | 1.9%(+0.123)#6,984 |
| 93. | Goshen | 2.0% | 1.4%(+0.619)#93 | 1.9%(+0.110)#7,040 |
| 94. | West Fork | 2.0% | 1.4%(+0.615)#94 | 1.9%(+0.106)#7,064 |
| 95. | Hatfield | 2.0% | 1.4%(+0.610)#95 | 1.9%(+0.100)#7,080 |
| 96. | Corning | 2.0% | 1.4%(+0.609)#96 | 1.9%(+0.100)#7,082 |
| 97. | Amity | 2.0% | 1.4%(+0.606)#97 | 1.9%(+0.097)#7,091 |
| 98. | Perry | 2.0% | 1.4%(+0.598)#98 | 1.9%(+0.088)#7,137 |
| 99. | Bentonville | 2.0% | 1.4%(+0.588)#99 | 1.9%(+0.078)#7,185 |
| 100. | Fairfield Bay | 2.0% | 1.4%(+0.572)#100 | 1.9%(+0.063)#7,247 |
Common Questions
What are the Top 10 Cities with the Highest Percentage of Population Employed in Real Estate, Rental & Leasing in Arkansas?
Top 10 Cities with the Highest Percentage of Population Employed in Real Estate, Rental & Leasing in Arkansas are:
What city has the Highest Percentage of Population Employed in Real Estate, Rental & Leasing in Arkansas?
Everton has the Highest Percentage of Population Employed in Real Estate, Rental & Leasing in Arkansas with 44.0%.
What is the Percentage of Population Employed in Real Estate, Rental & Leasing in the State of Arkansas?
Percentage of Population Employed in Real Estate, Rental & Leasing in Arkansas is 1.4%.
What is the Percentage of Population Employed in Real Estate, Rental & Leasing in the United States?
Percentage of Population Employed in Real Estate, Rental & Leasing in the United States is 1.9%.