Cities with the Highest Percentage of Population Employed in Real Estate, Rental & Leasing in Indiana
RELATED REPORTS & OPTIONS
Real Estate, Rental & Leasing
Indiana
Compare Cities
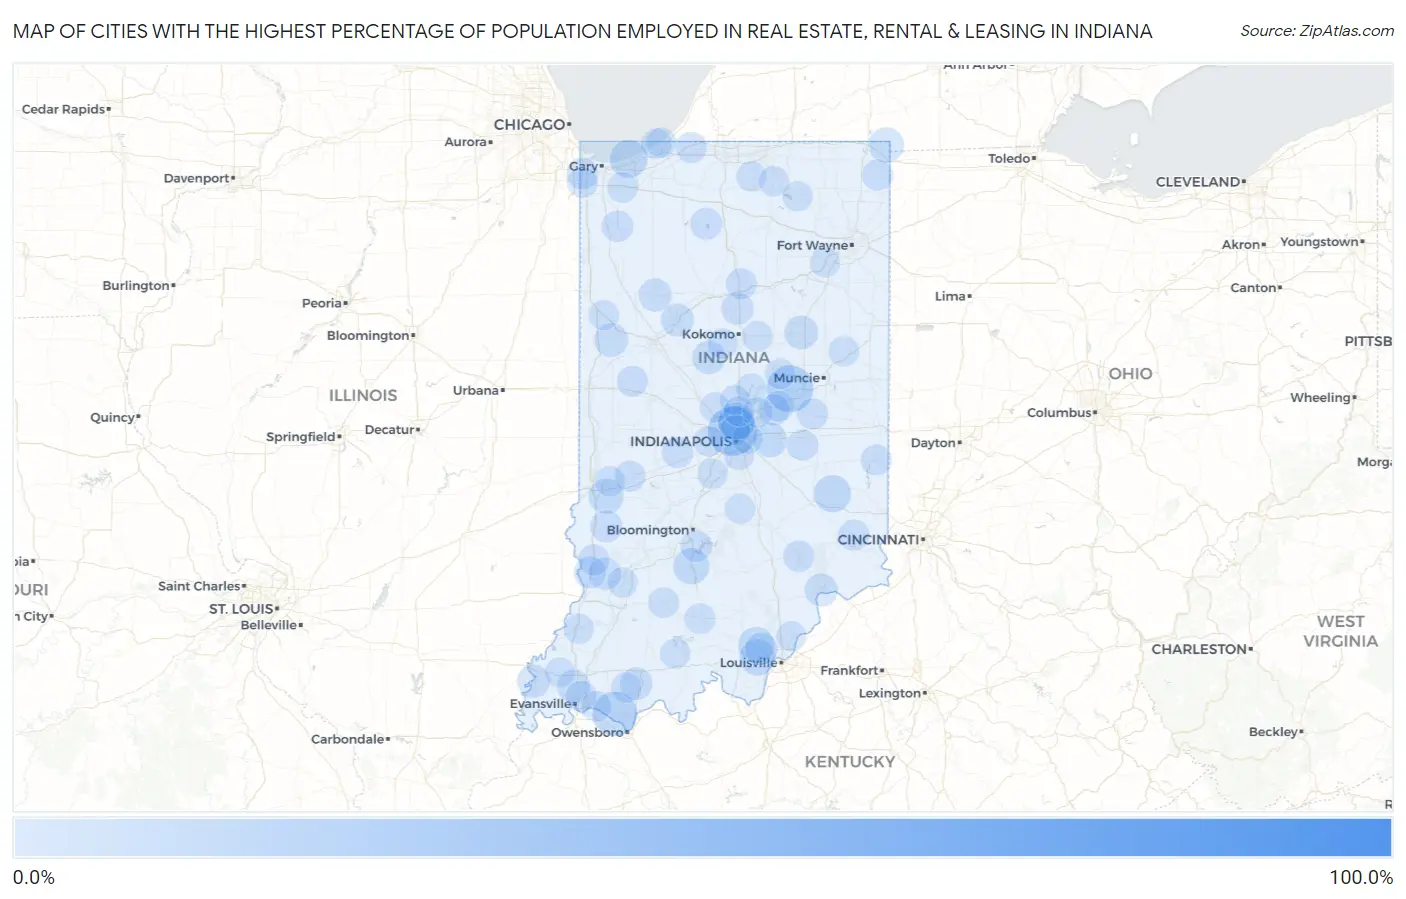
Map of Cities with the Highest Percentage of Population Employed in Real Estate, Rental & Leasing in Indiana
0.0%
100.0%
Cities with the Highest Percentage of Population Employed in Real Estate, Rental & Leasing in Indiana
| City | % Employed | vs State | vs National | |
| 1. | Stillwell | 100.0% | 1.4%(+98.6)#1 | 1.9%(+98.1)#8 |
| 2. | Saugany Lake | 41.6% | 1.4%(+40.1)#2 | 1.9%(+39.7)#35 |
| 3. | Prairie Creek | 24.6% | 1.4%(+23.2)#3 | 1.9%(+22.7)#107 |
| 4. | Spring Hill | 23.3% | 1.4%(+21.9)#4 | 1.9%(+21.4)#116 |
| 5. | New Lisbon | 22.9% | 1.4%(+21.4)#5 | 1.9%(+21.0)#125 |
| 6. | Country Club Heights | 20.5% | 1.4%(+19.0)#6 | 1.9%(+18.6)#149 |
| 7. | Hatfield | 18.0% | 1.4%(+16.5)#7 | 1.9%(+16.1)#183 |
| 8. | Fairview | 16.0% | 1.4%(+14.6)#8 | 1.9%(+14.1)#218 |
| 9. | Bowling Green | 15.7% | 1.4%(+14.3)#9 | 1.9%(+13.8)#226 |
| 10. | Grammer | 12.5% | 1.4%(+11.1)#10 | 1.9%(+10.6)#344 |
| 11. | Rockfield | 11.7% | 1.4%(+10.3)#11 | 1.9%(+9.81)#396 |
| 12. | Solsberry | 11.6% | 1.4%(+10.1)#12 | 1.9%(+9.69)#405 |
| 13. | Dune Acres | 10.9% | 1.4%(+9.46)#13 | 1.9%(+9.01)#454 |
| 14. | Lake Santee | 10.2% | 1.4%(+8.72)#14 | 1.9%(+8.27)#517 |
| 15. | Williams Creek | 10.0% | 1.4%(+8.51)#15 | 1.9%(+8.06)#545 |
| 16. | Malden | 9.1% | 1.4%(+7.65)#16 | 1.9%(+7.20)#639 |
| 17. | Gwynneville | 9.0% | 1.4%(+7.60)#17 | 1.9%(+7.15)#650 |
| 18. | Avoca | 9.0% | 1.4%(+7.56)#18 | 1.9%(+7.10)#653 |
| 19. | Meridian Hills | 9.0% | 1.4%(+7.53)#19 | 1.9%(+7.08)#656 |
| 20. | Georgetown | 8.9% | 1.4%(+7.48)#20 | 1.9%(+7.03)#658 |
| 21. | Greenville | 8.8% | 1.4%(+7.36)#21 | 1.9%(+6.91)#678 |
| 22. | Clear Lake | 7.9% | 1.4%(+6.49)#22 | 1.9%(+6.04)#838 |
| 23. | Riley | 7.7% | 1.4%(+6.30)#23 | 1.9%(+5.84)#873 |
| 24. | Jimmerson Lake | 7.7% | 1.4%(+6.26)#24 | 1.9%(+5.80)#880 |
| 25. | Glezen | 7.6% | 1.4%(+6.14)#25 | 1.9%(+5.68)#908 |
| 26. | Spring Lake | 7.1% | 1.4%(+5.71)#26 | 1.9%(+5.25)#1,007 |
| 27. | Gas City | 6.6% | 1.4%(+5.19)#27 | 1.9%(+4.74)#1,140 |
| 28. | Flat Rock | 6.6% | 1.4%(+5.18)#28 | 1.9%(+4.72)#1,148 |
| 29. | Pine Village | 6.6% | 1.4%(+5.12)#29 | 1.9%(+4.67)#1,167 |
| 30. | Michigantown | 6.1% | 1.4%(+4.64)#30 | 1.9%(+4.18)#1,344 |
| 31. | Pleasant View | 5.9% | 1.4%(+4.43)#31 | 1.9%(+3.98)#1,431 |
| 32. | Darmstadt | 5.8% | 1.4%(+4.35)#32 | 1.9%(+3.89)#1,467 |
| 33. | Delphi | 5.7% | 1.4%(+4.26)#33 | 1.9%(+3.81)#1,498 |
| 34. | New Harmony | 5.7% | 1.4%(+4.26)#34 | 1.9%(+3.80)#1,501 |
| 35. | Reynolds | 5.7% | 1.4%(+4.22)#35 | 1.9%(+3.77)#1,516 |
| 36. | Madison | 5.5% | 1.4%(+4.07)#36 | 1.9%(+3.61)#1,593 |
| 37. | Gentryville | 5.3% | 1.4%(+3.88)#37 | 1.9%(+3.43)#1,678 |
| 38. | Galena | 5.0% | 1.4%(+3.58)#38 | 1.9%(+3.12)#1,849 |
| 39. | Freelandville | 5.0% | 1.4%(+3.52)#39 | 1.9%(+3.07)#1,889 |
| 40. | Grissom Afb | 4.8% | 1.4%(+3.34)#40 | 1.9%(+2.89)#2,003 |
| 41. | Hymera | 4.7% | 1.4%(+3.22)#41 | 1.9%(+2.76)#2,095 |
| 42. | Oaktown | 4.6% | 1.4%(+3.15)#42 | 1.9%(+2.70)#2,143 |
| 43. | Culver | 4.6% | 1.4%(+3.13)#43 | 1.9%(+2.67)#2,161 |
| 44. | Smithville Sanders | 4.2% | 1.4%(+2.72)#44 | 1.9%(+2.26)#2,489 |
| 45. | Foxcliff Estates | 4.1% | 1.4%(+2.66)#45 | 1.9%(+2.20)#2,562 |
| 46. | Ingalls | 4.1% | 1.4%(+2.62)#46 | 1.9%(+2.16)#2,608 |
| 47. | Munster | 3.9% | 1.4%(+2.45)#47 | 1.9%(+2.00)#2,783 |
| 48. | De Motte | 3.8% | 1.4%(+2.40)#48 | 1.9%(+1.94)#2,838 |
| 49. | Coatesville | 3.8% | 1.4%(+2.35)#49 | 1.9%(+1.90)#2,900 |
| 50. | Vernon | 3.8% | 1.4%(+2.32)#50 | 1.9%(+1.87)#2,938 |
| 51. | Carthage | 3.7% | 1.4%(+2.27)#51 | 1.9%(+1.81)#3,009 |
| 52. | Hamilton | 3.7% | 1.4%(+2.26)#52 | 1.9%(+1.81)#3,023 |
| 53. | Carlisle | 3.7% | 1.4%(+2.24)#53 | 1.9%(+1.78)#3,050 |
| 54. | Cadiz | 3.6% | 1.4%(+2.20)#54 | 1.9%(+1.74)#3,111 |
| 55. | Mexico | 3.6% | 1.4%(+2.19)#55 | 1.9%(+1.74)#3,119 |
| 56. | Knightsville | 3.5% | 1.4%(+2.07)#56 | 1.9%(+1.62)#3,282 |
| 57. | Wingate | 3.5% | 1.4%(+2.06)#57 | 1.9%(+1.60)#3,296 |
| 58. | Hudson Lake | 3.5% | 1.4%(+2.05)#58 | 1.9%(+1.59)#3,311 |
| 59. | Underwood | 3.5% | 1.4%(+2.03)#59 | 1.9%(+1.58)#3,326 |
| 60. | Liberty | 3.4% | 1.4%(+2.00)#60 | 1.9%(+1.55)#3,371 |
| 61. | Gilmer Park | 3.4% | 1.4%(+1.97)#61 | 1.9%(+1.51)#3,419 |
| 62. | Melody Hill | 3.4% | 1.4%(+1.96)#62 | 1.9%(+1.51)#3,421 |
| 63. | Milan | 3.4% | 1.4%(+1.96)#63 | 1.9%(+1.51)#3,422 |
| 64. | Greentown | 3.3% | 1.4%(+1.85)#64 | 1.9%(+1.40)#3,597 |
| 65. | Shorewood Forest | 3.3% | 1.4%(+1.83)#65 | 1.9%(+1.38)#3,633 |
| 66. | Shoals | 3.3% | 1.4%(+1.82)#66 | 1.9%(+1.37)#3,650 |
| 67. | Cicero | 3.3% | 1.4%(+1.82)#67 | 1.9%(+1.36)#3,666 |
| 68. | Paoli | 3.2% | 1.4%(+1.75)#68 | 1.9%(+1.29)#3,795 |
| 69. | Rockford | 3.2% | 1.4%(+1.73)#69 | 1.9%(+1.27)#3,831 |
| 70. | Pendleton | 3.1% | 1.4%(+1.65)#70 | 1.9%(+1.20)#3,948 |
| 71. | Warren Park | 3.1% | 1.4%(+1.63)#71 | 1.9%(+1.18)#3,984 |
| 72. | Dunkirk | 3.1% | 1.4%(+1.63)#72 | 1.9%(+1.17)#3,988 |
| 73. | Long Beach | 3.0% | 1.4%(+1.61)#73 | 1.9%(+1.15)#4,047 |
| 74. | Rocky Ripple | 3.0% | 1.4%(+1.56)#74 | 1.9%(+1.10)#4,135 |
| 75. | Tennyson | 3.0% | 1.4%(+1.55)#75 | 1.9%(+1.09)#4,152 |
| 76. | Russiaville | 3.0% | 1.4%(+1.51)#76 | 1.9%(+1.06)#4,218 |
| 77. | Dyer | 2.9% | 1.4%(+1.51)#77 | 1.9%(+1.06)#4,225 |
| 78. | Newburgh | 2.9% | 1.4%(+1.50)#78 | 1.9%(+1.04)#4,251 |
| 79. | Frankton | 2.9% | 1.4%(+1.50)#79 | 1.9%(+1.04)#4,263 |
| 80. | Westfield | 2.8% | 1.4%(+1.41)#80 | 1.9%(+0.952)#4,440 |
| 81. | Wakarusa | 2.8% | 1.4%(+1.39)#81 | 1.9%(+0.938)#4,466 |
| 82. | Avon | 2.8% | 1.4%(+1.39)#82 | 1.9%(+0.934)#4,483 |
| 83. | New Paris | 2.8% | 1.4%(+1.38)#83 | 1.9%(+0.928)#4,497 |
| 84. | Floyds Knobs | 2.8% | 1.4%(+1.38)#84 | 1.9%(+0.922)#4,522 |
| 85. | Homecroft | 2.8% | 1.4%(+1.38)#85 | 1.9%(+0.922)#4,523 |
| 86. | Cynthiana | 2.8% | 1.4%(+1.35)#86 | 1.9%(+0.897)#4,574 |
| 87. | Fishers | 2.8% | 1.4%(+1.34)#87 | 1.9%(+0.885)#4,595 |
| 88. | Michiana Shores | 2.8% | 1.4%(+1.33)#88 | 1.9%(+0.871)#4,621 |
| 89. | Hazleton | 2.7% | 1.4%(+1.29)#89 | 1.9%(+0.836)#4,713 |
| 90. | Brooklyn | 2.7% | 1.4%(+1.28)#90 | 1.9%(+0.827)#4,734 |
| 91. | Cordry Sweetwater Lakes | 2.7% | 1.4%(+1.28)#91 | 1.9%(+0.826)#4,735 |
| 92. | Zionsville | 2.7% | 1.4%(+1.28)#92 | 1.9%(+0.825)#4,739 |
| 93. | Birdseye | 2.7% | 1.4%(+1.27)#93 | 1.9%(+0.811)#4,781 |
| 94. | Carmel | 2.7% | 1.4%(+1.25)#94 | 1.9%(+0.799)#4,808 |
| 95. | Cromwell | 2.7% | 1.4%(+1.25)#95 | 1.9%(+0.799)#4,810 |
| 96. | Roanoke | 2.7% | 1.4%(+1.25)#96 | 1.9%(+0.798)#4,812 |
| 97. | Seelyville | 2.7% | 1.4%(+1.24)#97 | 1.9%(+0.781)#4,850 |
| 98. | Fowler | 2.7% | 1.4%(+1.24)#98 | 1.9%(+0.780)#4,853 |
| 99. | Plainville | 2.6% | 1.4%(+1.14)#99 | 1.9%(+0.686)#5,132 |
| 100. | Charlestown | 2.6% | 1.4%(+1.14)#100 | 1.9%(+0.685)#5,134 |
Common Questions
What are the Top 10 Cities with the Highest Percentage of Population Employed in Real Estate, Rental & Leasing in Indiana?
Top 10 Cities with the Highest Percentage of Population Employed in Real Estate, Rental & Leasing in Indiana are:
#1
23.3%
#2
20.5%
#3
18.0%
#4
10.9%
#5
10.2%
#6
10.0%
#7
9.0%
#8
9.0%
#9
8.9%
#10
8.8%
What city has the Highest Percentage of Population Employed in Real Estate, Rental & Leasing in Indiana?
Spring Hill has the Highest Percentage of Population Employed in Real Estate, Rental & Leasing in Indiana with 23.3%.
What is the Percentage of Population Employed in Real Estate, Rental & Leasing in the State of Indiana?
Percentage of Population Employed in Real Estate, Rental & Leasing in Indiana is 1.4%.
What is the Percentage of Population Employed in Real Estate, Rental & Leasing in the United States?
Percentage of Population Employed in Real Estate, Rental & Leasing in the United States is 1.9%.