Gustine, CA Map & Demographics
Gustine Map
Gustine Overview
$23,942
PER CAPITA INCOME
$47,104
AVG FAMILY INCOME
$51,636
AVG HOUSEHOLD INCOME
40.7%
WAGE / INCOME GAP [ % ]
59.3¢/ $1
WAGE / INCOME GAP [ $ ]
0.37
INEQUALITY / GINI INDEX
6,122
TOTAL POPULATION
3,208
MALE POPULATION
2,914
FEMALE POPULATION
110.09
MALES / 100 FEMALES
90.84
FEMALES / 100 MALES
40.7
MEDIAN AGE
3.1
AVG FAMILY SIZE
2.6
AVG HOUSEHOLD SIZE
2,513
LABOR FORCE [ PEOPLE ]
52.0%
PERCENT IN LABOR FORCE
14.3%
UNEMPLOYMENT RATE
Gustine Zip Codes
Gustine Area Codes
Income in Gustine
Income Overview in Gustine
Per Capita Income in Gustine is $23,942, while median incomes of families and households are $47,104 and $51,636 respectively.
| Characteristic | Number | Measure |
| Per Capita Income | 6,122 | $23,942 |
| Median Family Income | 1,643 | $47,104 |
| Mean Family Income | 1,643 | $64,921 |
| Median Household Income | 2,307 | $51,636 |
| Mean Household Income | 2,307 | $64,297 |
| Income Deficit | 1,643 | $0 |
| Wage / Income Gap (%) | 6,122 | 40.69% |
| Wage / Income Gap ($) | 6,122 | 59.31¢ per $1 |
| Gini / Inequality Index | 6,122 | 0.37 |
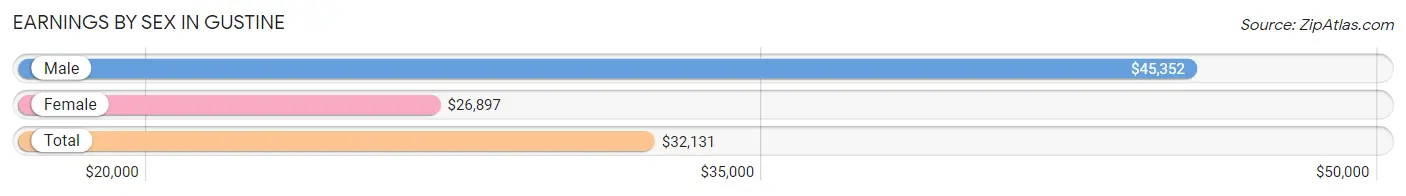
Earnings by Sex in Gustine
Average Earnings in Gustine are $32,131, $45,352 for men and $26,897 for women, a difference of 40.7%.
| Sex | Number | Average Earnings |
| Male | 1,244 (50.6%) | $45,352 |
| Female | 1,212 (49.3%) | $26,897 |
| Total | 2,456 (100.0%) | $32,131 |
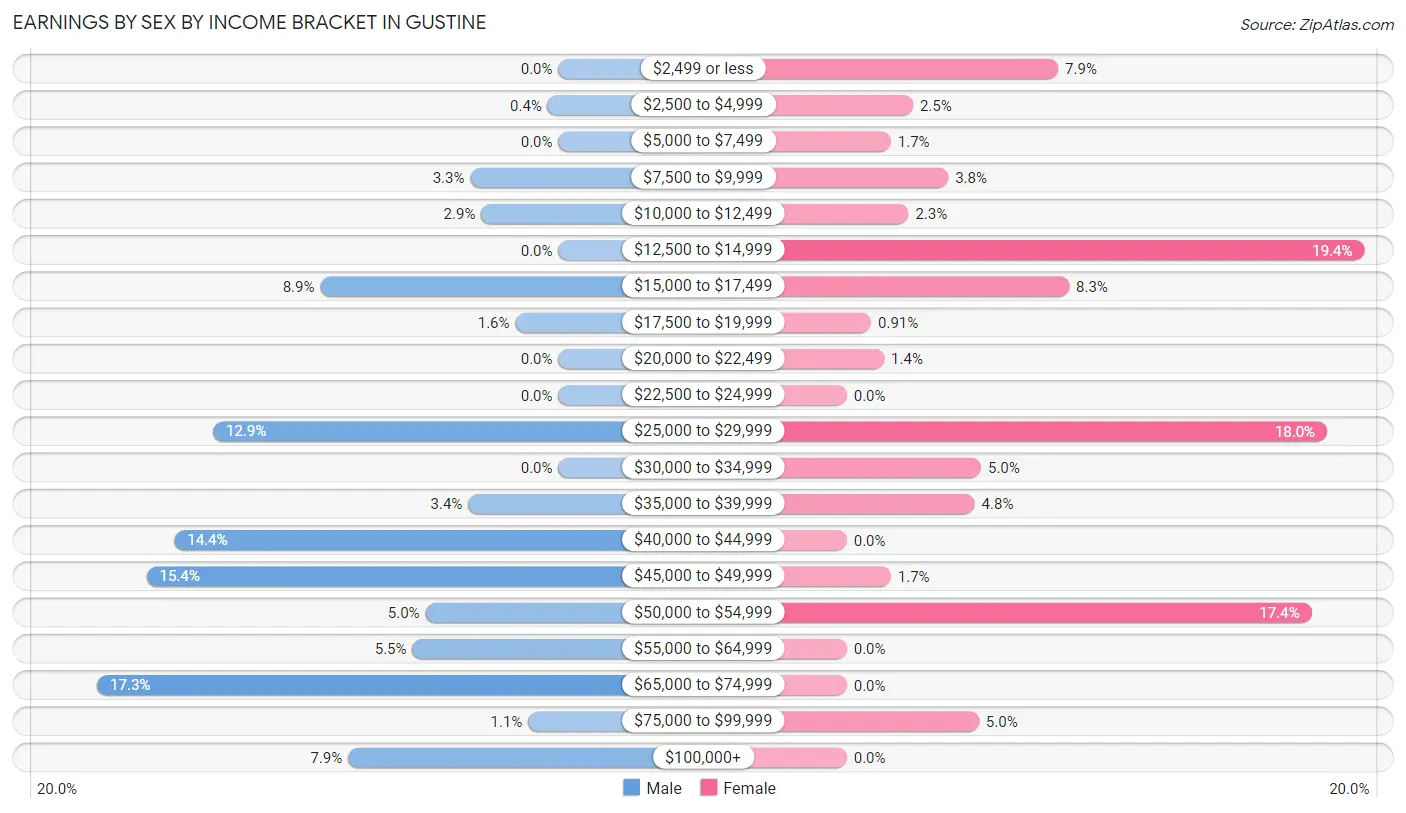
Earnings by Sex by Income Bracket in Gustine
The most common earnings brackets in Gustine are $65,000 to $74,999 for men (215 | 17.3%) and $12,500 to $14,999 for women (235 | 19.4%).
| Income | Male | Female |
| $2,499 or less | 0 (0.0%) | 96 (7.9%) |
| $2,500 to $4,999 | 5 (0.4%) | 30 (2.5%) |
| $5,000 to $7,499 | 0 (0.0%) | 20 (1.7%) |
| $7,500 to $9,999 | 41 (3.3%) | 46 (3.8%) |
| $10,000 to $12,499 | 36 (2.9%) | 28 (2.3%) |
| $12,500 to $14,999 | 0 (0.0%) | 235 (19.4%) |
| $15,000 to $17,499 | 111 (8.9%) | 101 (8.3%) |
| $17,500 to $19,999 | 20 (1.6%) | 11 (0.9%) |
| $20,000 to $22,499 | 0 (0.0%) | 17 (1.4%) |
| $22,500 to $24,999 | 0 (0.0%) | 0 (0.0%) |
| $25,000 to $29,999 | 161 (12.9%) | 218 (18.0%) |
| $30,000 to $34,999 | 0 (0.0%) | 61 (5.0%) |
| $35,000 to $39,999 | 42 (3.4%) | 58 (4.8%) |
| $40,000 to $44,999 | 179 (14.4%) | 0 (0.0%) |
| $45,000 to $49,999 | 192 (15.4%) | 20 (1.7%) |
| $50,000 to $54,999 | 62 (5.0%) | 211 (17.4%) |
| $55,000 to $64,999 | 68 (5.5%) | 0 (0.0%) |
| $65,000 to $74,999 | 215 (17.3%) | 0 (0.0%) |
| $75,000 to $99,999 | 14 (1.1%) | 60 (5.0%) |
| $100,000+ | 98 (7.9%) | 0 (0.0%) |
| Total | 1,244 (100.0%) | 1,212 (100.0%) |
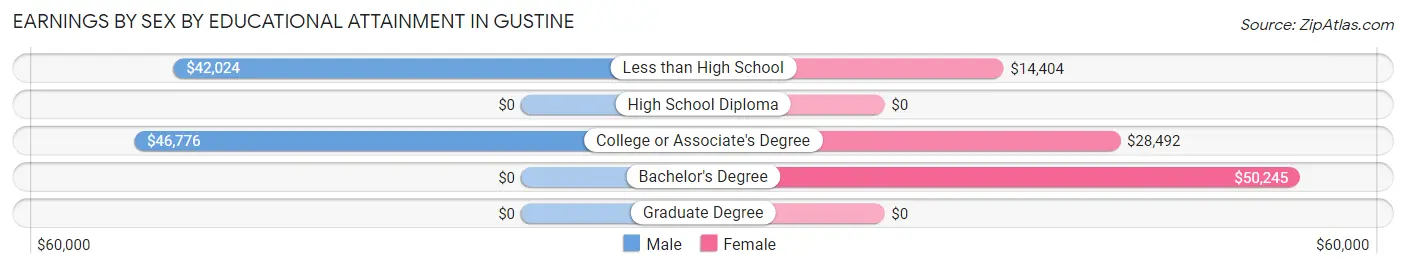
Earnings by Sex by Educational Attainment in Gustine
Average earnings in Gustine are $45,085 for men and $27,692 for women, a difference of 38.6%. Men with an educational attainment of college or associate's degree enjoy the highest average annual earnings of $46,776, while those with less than high school education earn the least with $42,024. Women with an educational attainment of bachelor's degree earn the most with the average annual earnings of $50,245, while those with less than high school education have the smallest earnings of $14,404.
| Educational Attainment | Male Income | Female Income |
| Less than High School | $42,024 | $14,404 |
| High School Diploma | - | - |
| College or Associate's Degree | $46,776 | $28,492 |
| Bachelor's Degree | - | - |
| Graduate Degree | - | - |
| Total | $45,085 | $27,692 |
Family Income in Gustine
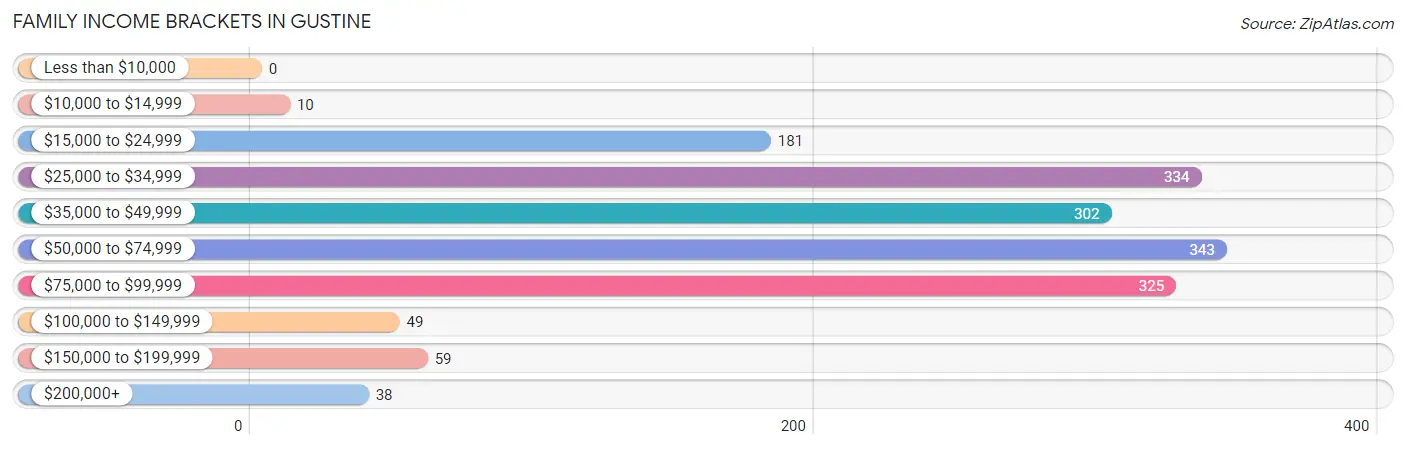
Family Income Brackets in Gustine
According to the Gustine family income data, there are 343 families falling into the $50,000 to $74,999 income range, which is the most common income bracket and makes up 20.9% of all families.
| Income Bracket | # Families | % Families |
| Less than $10,000 | 0 | 0.0% |
| $10,000 to $14,999 | 10 | 0.6% |
| $15,000 to $24,999 | 181 | 11.0% |
| $25,000 to $34,999 | 334 | 20.3% |
| $35,000 to $49,999 | 302 | 18.4% |
| $50,000 to $74,999 | 343 | 20.9% |
| $75,000 to $99,999 | 325 | 19.8% |
| $100,000 to $149,999 | 49 | 3.0% |
| $150,000 to $199,999 | 59 | 3.6% |
| $200,000+ | 38 | 2.3% |
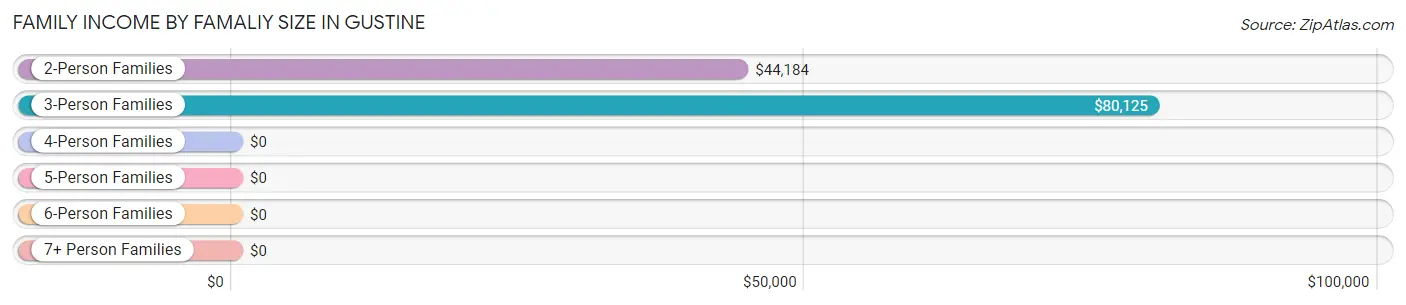
Family Income by Famaliy Size in Gustine
3-person families (240 | 14.6%) account for the highest median family income in Gustine with $80,125 per family, while 3-person families (240 | 14.6%) have the highest median income of $26,708 per family member.
| Income Bracket | # Families | Median Income |
| 2-Person Families | 931 (56.7%) | $44,184 |
| 3-Person Families | 240 (14.6%) | $80,125 |
| 4-Person Families | 283 (17.2%) | $0 |
| 5-Person Families | 147 (8.9%) | $0 |
| 6-Person Families | 42 (2.6%) | $0 |
| 7+ Person Families | 0 (0.0%) | $0 |
| Total | 1,643 (100.0%) | $47,104 |
Family Income by Number of Earners in Gustine
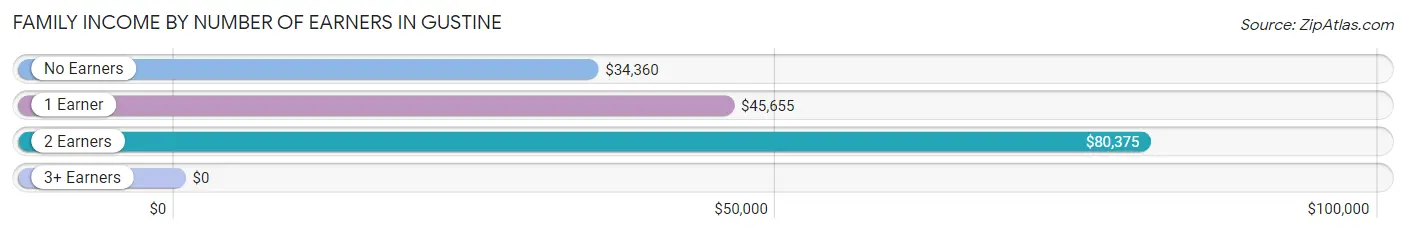
| Number of Earners | # Families | Median Income |
| No Earners | 568 (34.6%) | $34,360 |
| 1 Earner | 641 (39.0%) | $45,655 |
| 2 Earners | 350 (21.3%) | $80,375 |
| 3+ Earners | 84 (5.1%) | $0 |
| Total | 1,643 (100.0%) | $47,104 |
Household Income in Gustine
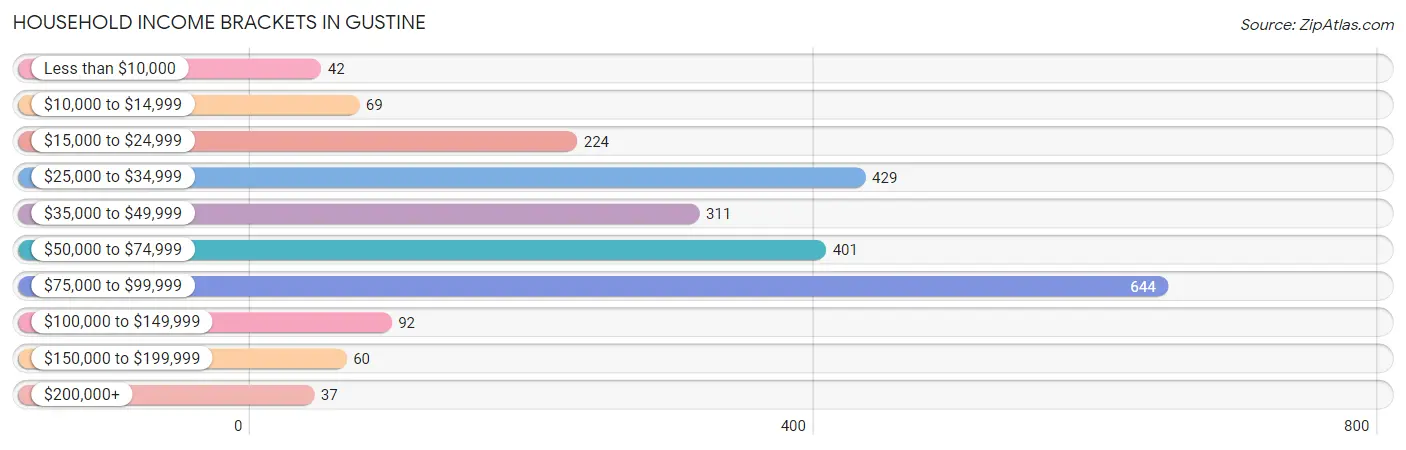
Household Income Brackets in Gustine
With 644 households falling in the category, the $75,000 to $99,999 income range is the most frequent in Gustine, accounting for 27.9% of all households. In contrast, only 37 households (1.6%) fall into the $200,000+ income bracket, making it the least populous group.
| Income Bracket | # Households | % Households |
| Less than $10,000 | 42 | 1.8% |
| $10,000 to $14,999 | 69 | 3.0% |
| $15,000 to $24,999 | 224 | 9.7% |
| $25,000 to $34,999 | 429 | 18.6% |
| $35,000 to $49,999 | 311 | 13.5% |
| $50,000 to $74,999 | 401 | 17.4% |
| $75,000 to $99,999 | 644 | 27.9% |
| $100,000 to $149,999 | 92 | 4.0% |
| $150,000 to $199,999 | 60 | 2.6% |
| $200,000+ | 37 | 1.6% |
Household Income by Householder Age in Gustine
The median household income in Gustine is $51,636, with the highest median household income of $73,833 found in the 45 to 64 years age bracket for the primary householder. A total of 986 households (42.7%) fall into this category. Meanwhile, the 15 to 24 years age bracket for the primary householder has the lowest median household income of $0, with 152 households (6.6%) in this group.
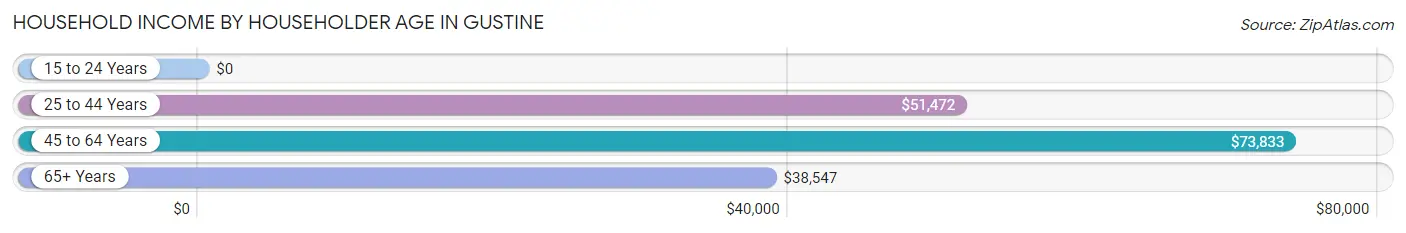
| Income Bracket | # Households | Median Income |
| 15 to 24 Years | 152 (6.6%) | $0 |
| 25 to 44 Years | 561 (24.3%) | $51,472 |
| 45 to 64 Years | 986 (42.7%) | $73,833 |
| 65+ Years | 608 (26.4%) | $38,547 |
| Total | 2,307 (100.0%) | $51,636 |
Poverty in Gustine
Income Below Poverty by Sex and Age in Gustine
With 3.1% poverty level for males and 5.3% for females among the residents of Gustine, 55 to 64 year old males and 75 year old and over females are the most vulnerable to poverty, with 24 males (11.5%) and 75 females (36.9%) in their respective age groups living below the poverty level.
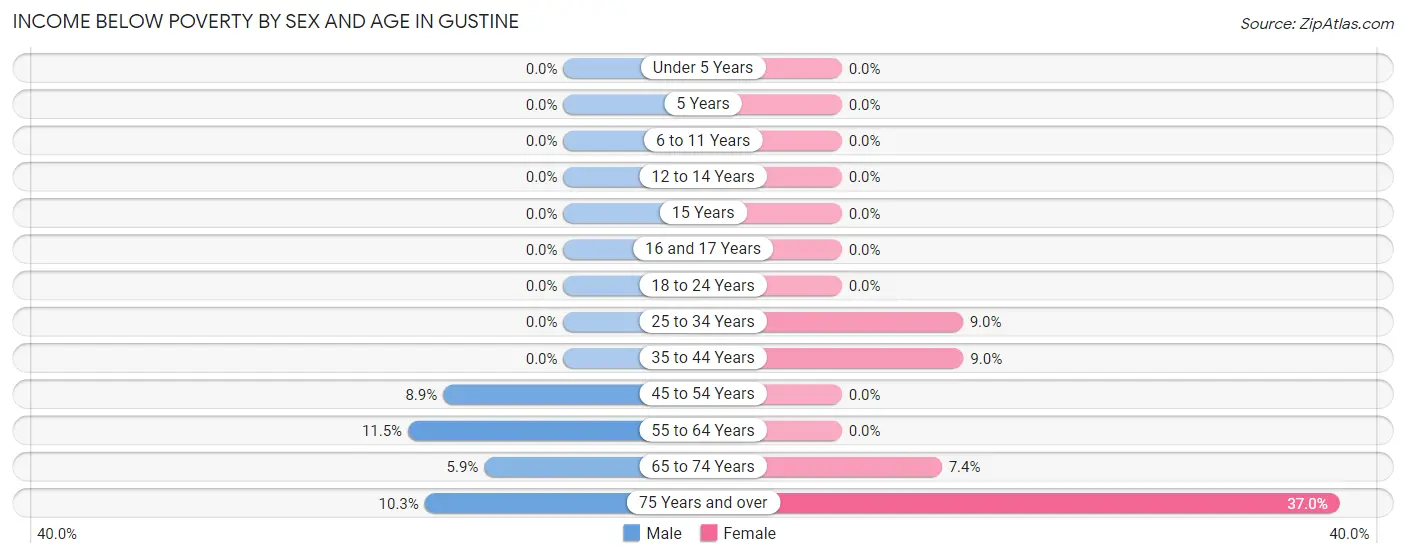
| Age Bracket | Male | Female |
| Under 5 Years | 0 (0.0%) | 0 (0.0%) |
| 5 Years | 0 (0.0%) | 0 (0.0%) |
| 6 to 11 Years | 0 (0.0%) | 0 (0.0%) |
| 12 to 14 Years | 0 (0.0%) | 0 (0.0%) |
| 15 Years | 0 (0.0%) | 0 (0.0%) |
| 16 and 17 Years | 0 (0.0%) | 0 (0.0%) |
| 18 to 24 Years | 0 (0.0%) | 0 (0.0%) |
| 25 to 34 Years | 0 (0.0%) | 15 (9.0%) |
| 35 to 44 Years | 0 (0.0%) | 40 (9.0%) |
| 45 to 54 Years | 46 (8.9%) | 0 (0.0%) |
| 55 to 64 Years | 24 (11.5%) | 0 (0.0%) |
| 65 to 74 Years | 12 (5.9%) | 25 (7.4%) |
| 75 Years and over | 17 (10.3%) | 75 (36.9%) |
| Total | 99 (3.1%) | 155 (5.3%) |
Income Above Poverty by Sex and Age in Gustine
According to the poverty statistics in Gustine, males aged under 5 years and females aged under 5 years are the age groups that are most secure financially, with 100.0% of males and 100.0% of females in these age groups living above the poverty line.
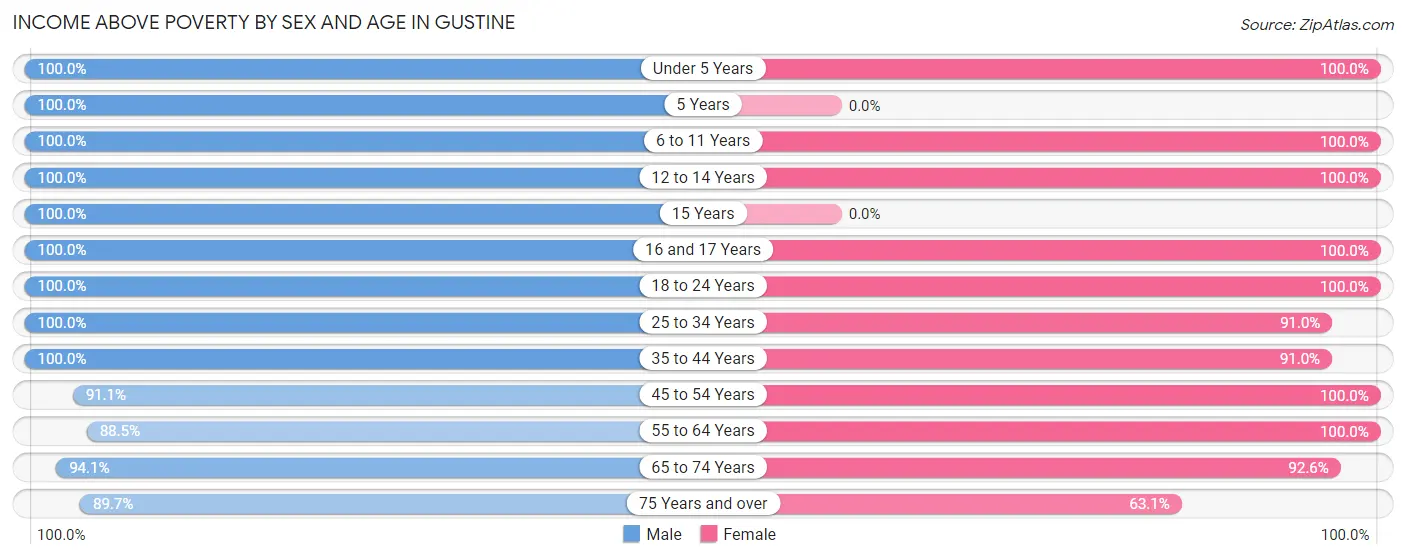
| Age Bracket | Male | Female |
| Under 5 Years | 173 (100.0%) | 39 (100.0%) |
| 5 Years | 77 (100.0%) | 0 (0.0%) |
| 6 to 11 Years | 287 (100.0%) | 217 (100.0%) |
| 12 to 14 Years | 115 (100.0%) | 208 (100.0%) |
| 15 Years | 174 (100.0%) | 0 (0.0%) |
| 16 and 17 Years | 88 (100.0%) | 137 (100.0%) |
| 18 to 24 Years | 358 (100.0%) | 206 (100.0%) |
| 25 to 34 Years | 277 (100.0%) | 152 (91.0%) |
| 35 to 44 Years | 567 (100.0%) | 403 (91.0%) |
| 45 to 54 Years | 469 (91.1%) | 740 (100.0%) |
| 55 to 64 Years | 184 (88.5%) | 217 (100.0%) |
| 65 to 74 Years | 192 (94.1%) | 312 (92.6%) |
| 75 Years and over | 148 (89.7%) | 128 (63.0%) |
| Total | 3,109 (96.9%) | 2,759 (94.7%) |
Income Below Poverty Among Married-Couple Families in Gustine
The poverty statistics for married-couple families in Gustine show that 1.2% or 10 of the total 849 families live below the poverty line. Families with no children have the highest poverty rate of 2.2%, comprising of 10 families. On the other hand, families with 1 or 2 children have the lowest poverty rate of 0.0%, which includes 0 families.
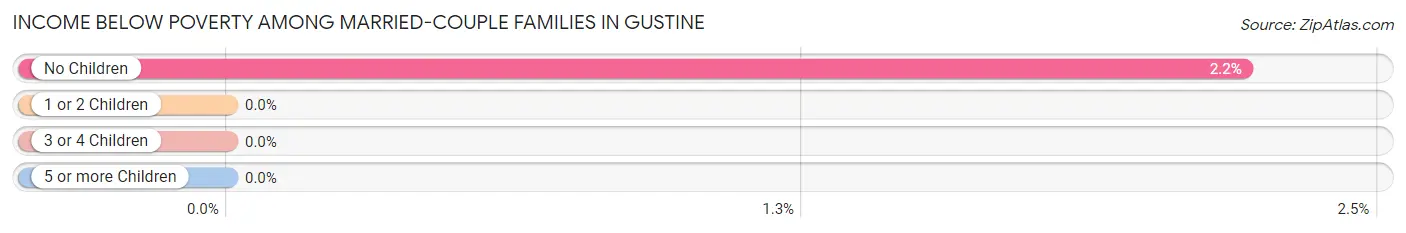
| Children | Above Poverty | Below Poverty |
| No Children | 443 (97.8%) | 10 (2.2%) |
| 1 or 2 Children | 324 (100.0%) | 0 (0.0%) |
| 3 or 4 Children | 72 (100.0%) | 0 (0.0%) |
| 5 or more Children | 0 (0.0%) | 0 (0.0%) |
| Total | 839 (98.8%) | 10 (1.2%) |
Income Below Poverty Among Single-Parent Households in Gustine
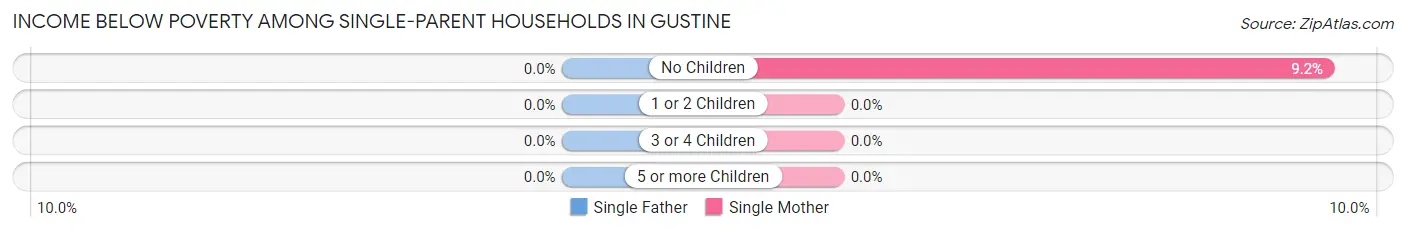
| Children | Single Father | Single Mother |
| No Children | 0 (0.0%) | 30 (9.1%) |
| 1 or 2 Children | 0 (0.0%) | 0 (0.0%) |
| 3 or 4 Children | 0 (0.0%) | 0 (0.0%) |
| 5 or more Children | 0 (0.0%) | 0 (0.0%) |
| Total | 0 (0.0%) | 30 (4.1%) |
Income Below Poverty Among Married-Couple vs Single-Parent Households in Gustine
The poverty data for Gustine shows that 10 of the married-couple family households (1.2%) and 30 of the single-parent households (3.8%) are living below the poverty level. Within the married-couple family households, those with no children have the highest poverty rate, with 10 households (2.2%) falling below the poverty line. Among the single-parent households, those with no children have the highest poverty rate, with 30 household (8.5%) living below poverty.
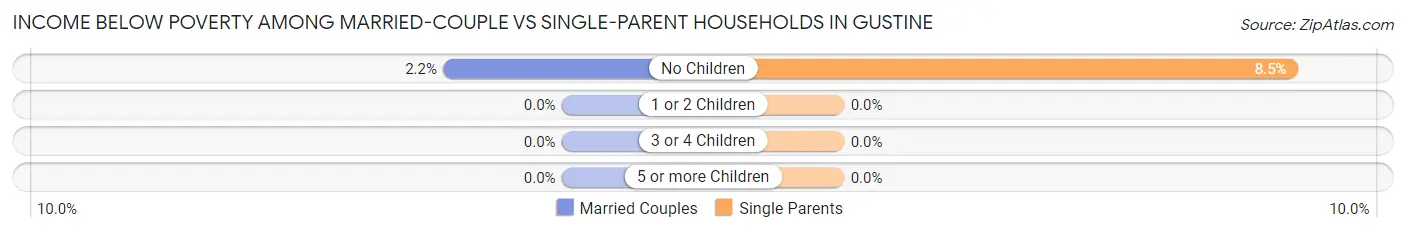
| Children | Married-Couple Families | Single-Parent Households |
| No Children | 10 (2.2%) | 30 (8.5%) |
| 1 or 2 Children | 0 (0.0%) | 0 (0.0%) |
| 3 or 4 Children | 0 (0.0%) | 0 (0.0%) |
| 5 or more Children | 0 (0.0%) | 0 (0.0%) |
| Total | 10 (1.2%) | 30 (3.8%) |
Race in Gustine
The most populous races in Gustine are Hispanic or Latino (3,644 | 59.5%), White / Caucasian (3,045 | 49.7%), and Some other Race (2,249 | 36.7%).
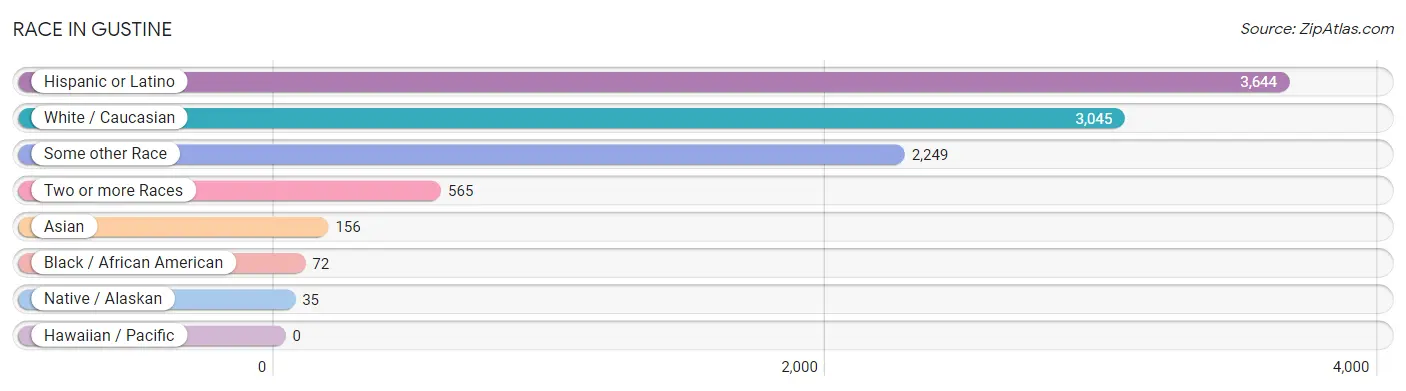
| Race | # Population | % Population |
| Asian | 156 | 2.5% |
| Black / African American | 72 | 1.2% |
| Hawaiian / Pacific | 0 | 0.0% |
| Hispanic or Latino | 3,644 | 59.5% |
| Native / Alaskan | 35 | 0.6% |
| White / Caucasian | 3,045 | 49.7% |
| Two or more Races | 565 | 9.2% |
| Some other Race | 2,249 | 36.7% |
| Total | 6,122 | 100.0% |
Ancestry in Gustine
The most populous ancestries reported in Gustine are Mexican (3,442 | 56.2%), Portuguese (696 | 11.4%), Irish (381 | 6.2%), French (373 | 6.1%), and European (291 | 4.8%), together accounting for 84.7% of all Gustine residents.
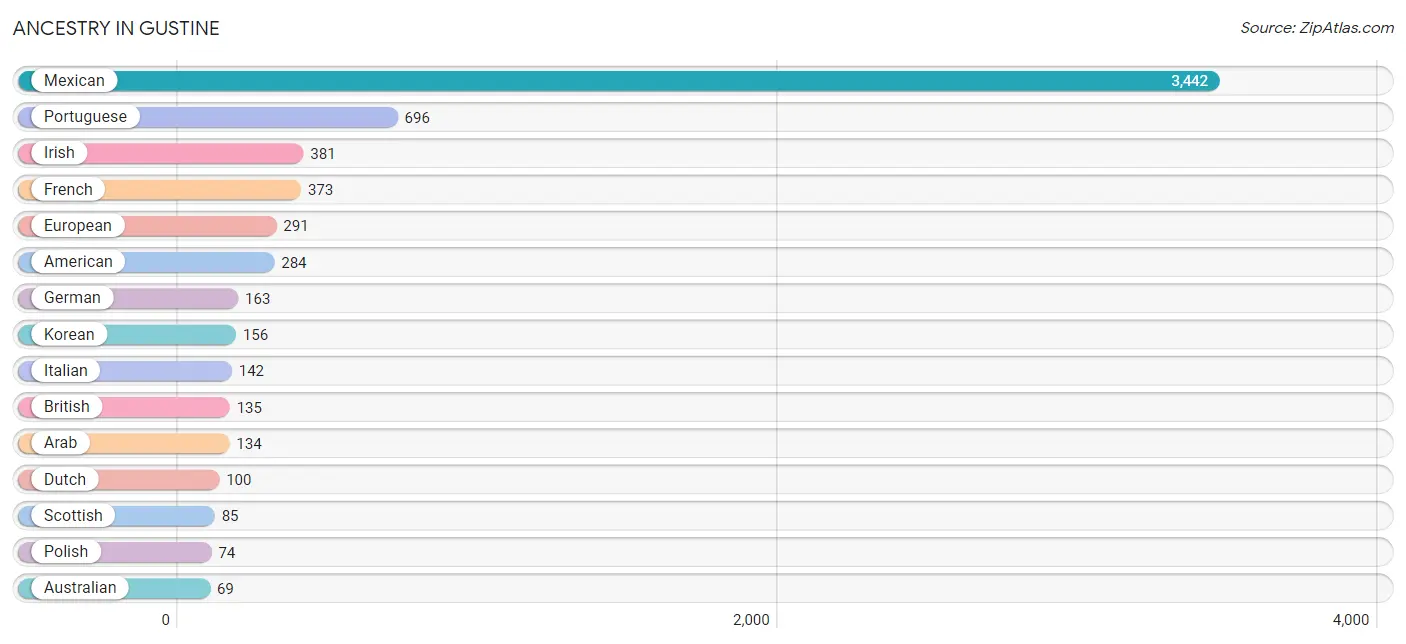
| Ancestry | # Population | % Population |
| Alsatian | 23 | 0.4% |
| American | 284 | 4.6% |
| Arab | 134 | 2.2% |
| Australian | 69 | 1.1% |
| British | 135 | 2.2% |
| Central American | 27 | 0.4% |
| Choctaw | 21 | 0.3% |
| Dutch | 100 | 1.6% |
| English | 28 | 0.5% |
| European | 291 | 4.8% |
| French | 373 | 6.1% |
| German | 163 | 2.7% |
| Hungarian | 17 | 0.3% |
| Irish | 381 | 6.2% |
| Italian | 142 | 2.3% |
| Korean | 156 | 2.5% |
| Mexican | 3,442 | 56.2% |
| Mexican American Indian | 14 | 0.2% |
| Nicaraguan | 10 | 0.2% |
| Northern European | 29 | 0.5% |
| Norwegian | 38 | 0.6% |
| Polish | 74 | 1.2% |
| Portuguese | 696 | 11.4% |
| Salvadoran | 17 | 0.3% |
| Scandinavian | 12 | 0.2% |
| Scottish | 85 | 1.4% |
| South American | 14 | 0.2% |
| Swedish | 3 | 0.1% |
| Swiss | 17 | 0.3% |
| Venezuelan | 14 | 0.2% |
| Yaqui | 24 | 0.4% | View All 31 Rows |
Immigrants in Gustine
The most numerous immigrant groups reported in Gustine came from Central America (1,415 | 23.1%), Latin America (1,415 | 23.1%), Mexico (1,398 | 22.8%), Europe (147 | 2.4%), and England (125 | 2.0%), together accounting for 73.5% of all Gustine residents.
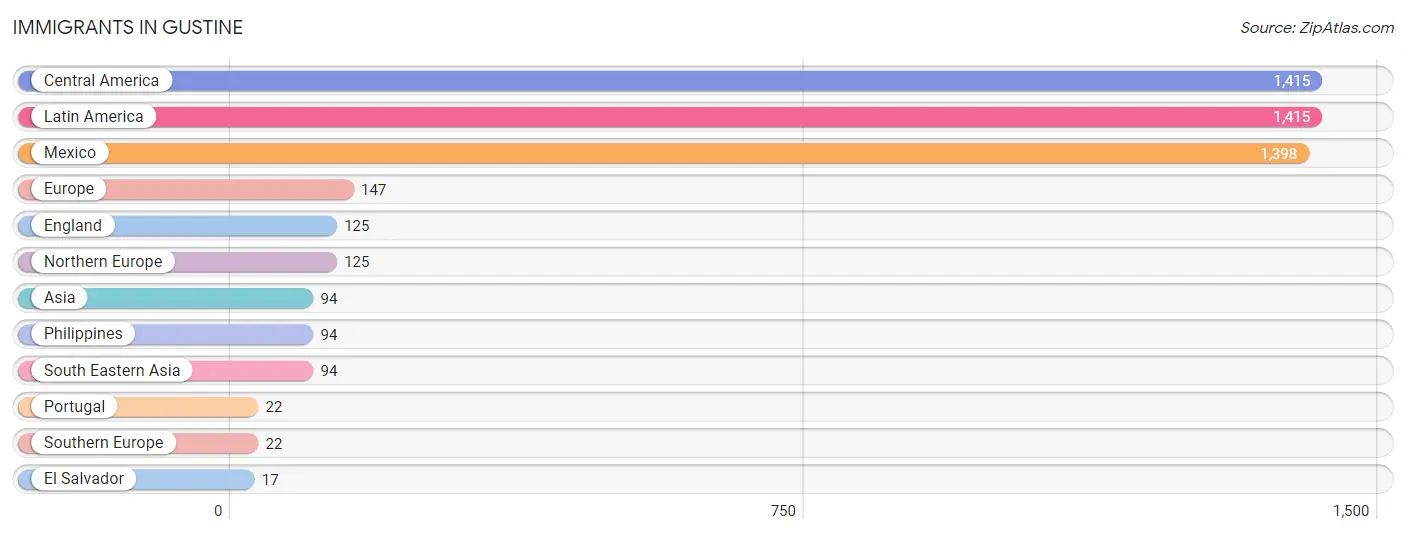
| Immigration Origin | # Population | % Population |
| Asia | 94 | 1.5% |
| Central America | 1,415 | 23.1% |
| El Salvador | 17 | 0.3% |
| England | 125 | 2.0% |
| Europe | 147 | 2.4% |
| Latin America | 1,415 | 23.1% |
| Mexico | 1,398 | 22.8% |
| Northern Europe | 125 | 2.0% |
| Philippines | 94 | 1.5% |
| Portugal | 22 | 0.4% |
| South Eastern Asia | 94 | 1.5% |
| Southern Europe | 22 | 0.4% | View All 12 Rows |
Sex and Age in Gustine
Sex and Age in Gustine
The most populous age groups in Gustine are 50 to 54 Years (363 | 11.3%) for men and 45 to 49 Years (443 | 15.2%) for women.
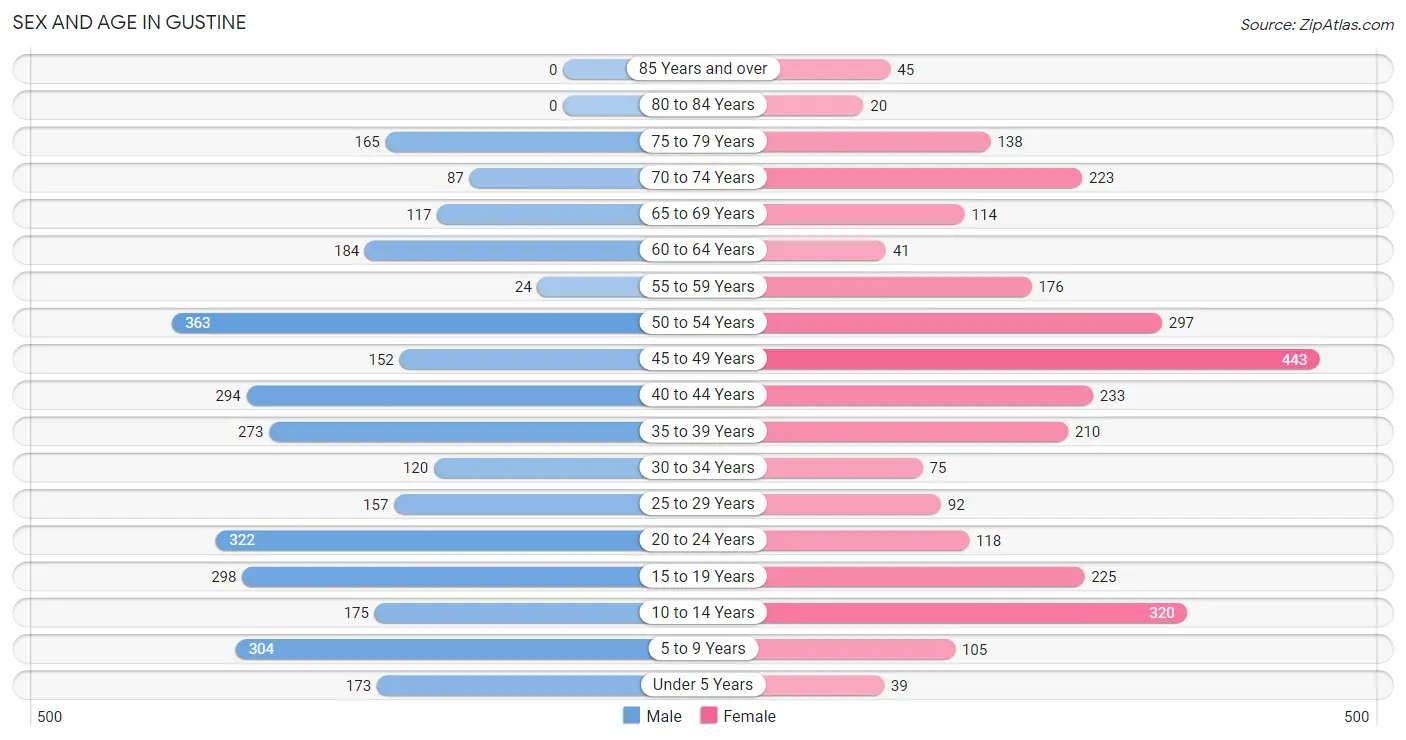
| Age Bracket | Male | Female |
| Under 5 Years | 173 (5.4%) | 39 (1.3%) |
| 5 to 9 Years | 304 (9.5%) | 105 (3.6%) |
| 10 to 14 Years | 175 (5.5%) | 320 (11.0%) |
| 15 to 19 Years | 298 (9.3%) | 225 (7.7%) |
| 20 to 24 Years | 322 (10.0%) | 118 (4.1%) |
| 25 to 29 Years | 157 (4.9%) | 92 (3.2%) |
| 30 to 34 Years | 120 (3.7%) | 75 (2.6%) |
| 35 to 39 Years | 273 (8.5%) | 210 (7.2%) |
| 40 to 44 Years | 294 (9.2%) | 233 (8.0%) |
| 45 to 49 Years | 152 (4.7%) | 443 (15.2%) |
| 50 to 54 Years | 363 (11.3%) | 297 (10.2%) |
| 55 to 59 Years | 24 (0.7%) | 176 (6.0%) |
| 60 to 64 Years | 184 (5.7%) | 41 (1.4%) |
| 65 to 69 Years | 117 (3.6%) | 114 (3.9%) |
| 70 to 74 Years | 87 (2.7%) | 223 (7.6%) |
| 75 to 79 Years | 165 (5.1%) | 138 (4.7%) |
| 80 to 84 Years | 0 (0.0%) | 20 (0.7%) |
| 85 Years and over | 0 (0.0%) | 45 (1.5%) |
| Total | 3,208 (100.0%) | 2,914 (100.0%) |
Families and Households in Gustine
Median Family Size in Gustine
The median family size in Gustine is 3.15 persons per family, with married-couple families (849 | 51.7%) accounting for the largest median family size of 3.53 persons per family. On the other hand, single male/father families (66 | 4.0%) represent the smallest median family size with 2.44 persons per family.
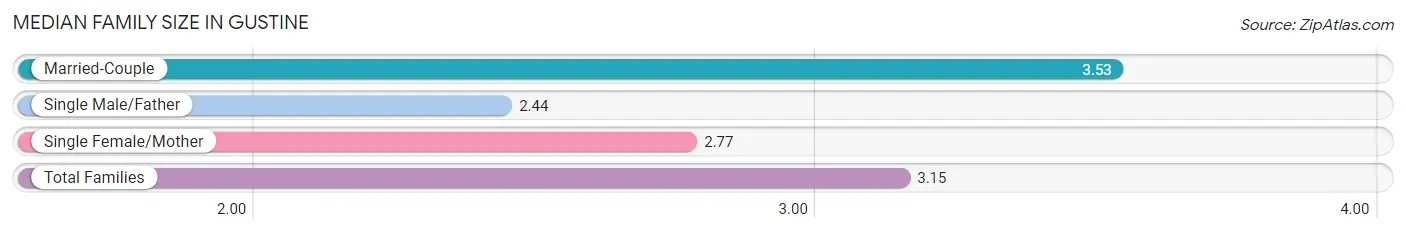
| Family Type | # Families | Family Size |
| Married-Couple | 849 (51.7%) | 3.53 |
| Single Male/Father | 66 (4.0%) | 2.44 |
| Single Female/Mother | 728 (44.3%) | 2.77 |
| Total Families | 1,643 (100.0%) | 3.15 |
Median Household Size in Gustine
The median household size in Gustine is 2.65 persons per household, with married-couple households (849 | 36.8%) accounting for the largest median household size of 3.56 persons per household. non-family households (664 | 28.8%) represent the smallest median household size with 1.04 persons per household.
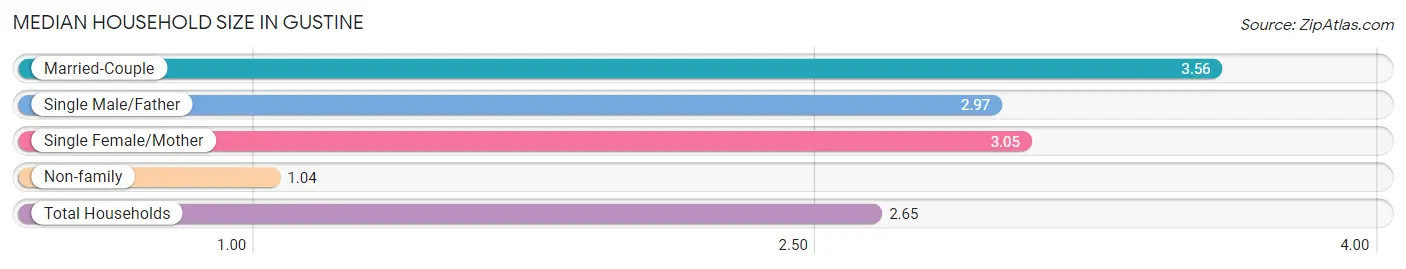
| Household Type | # Households | Household Size |
| Married-Couple | 849 (36.8%) | 3.56 |
| Single Male/Father | 66 (2.9%) | 2.97 |
| Single Female/Mother | 728 (31.6%) | 3.05 |
| Non-family | 664 (28.8%) | 1.04 |
| Total Households | 2,307 (100.0%) | 2.65 |
Household Size by Marriage Status in Gustine
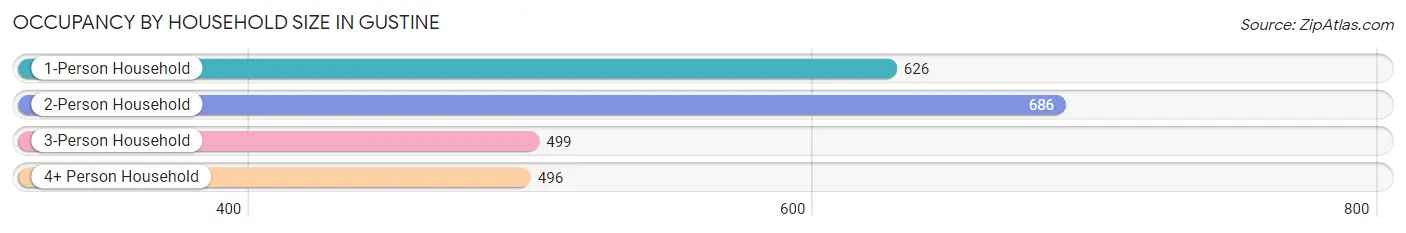
Out of a total of 2,307 households in Gustine, 1,643 (71.2%) are family households, while 664 (28.8%) are nonfamily households. The most numerous type of family households are 2-person households, comprising 648, and the most common type of nonfamily households are 1-person households, comprising 626.
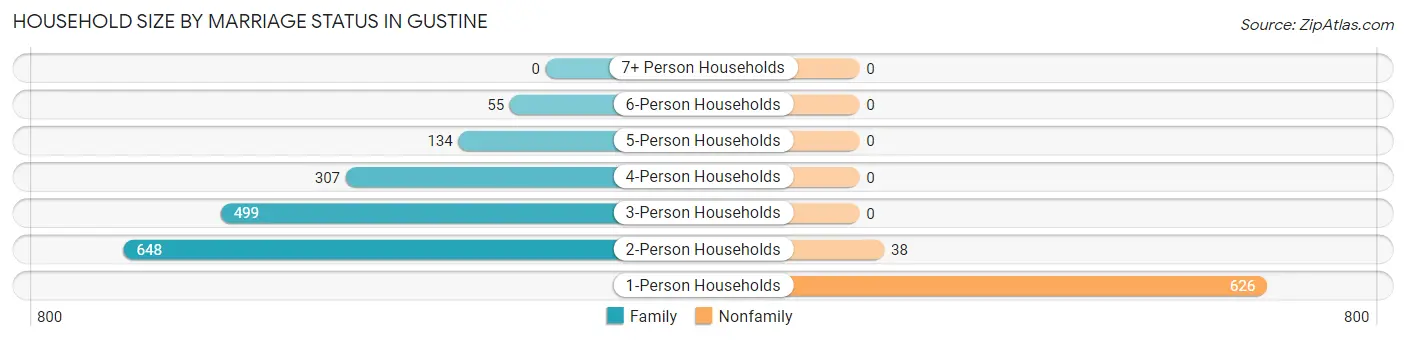
| Household Size | Family Households | Nonfamily Households |
| 1-Person Households | - | 626 (27.1%) |
| 2-Person Households | 648 (28.1%) | 38 (1.7%) |
| 3-Person Households | 499 (21.6%) | 0 (0.0%) |
| 4-Person Households | 307 (13.3%) | 0 (0.0%) |
| 5-Person Households | 134 (5.8%) | 0 (0.0%) |
| 6-Person Households | 55 (2.4%) | 0 (0.0%) |
| 7+ Person Households | 0 (0.0%) | 0 (0.0%) |
| Total | 1,643 (71.2%) | 664 (28.8%) |
Female Fertility in Gustine
Fertility by Age in Gustine
Average fertility rate in Gustine is 23.0 births per 1,000 women. Women in the age bracket of 20 to 34 years have the highest fertility rate with 49.0 births per 1,000 women. Women in the age bracket of 35 to 50 years acount for 58.8% of all women with births.
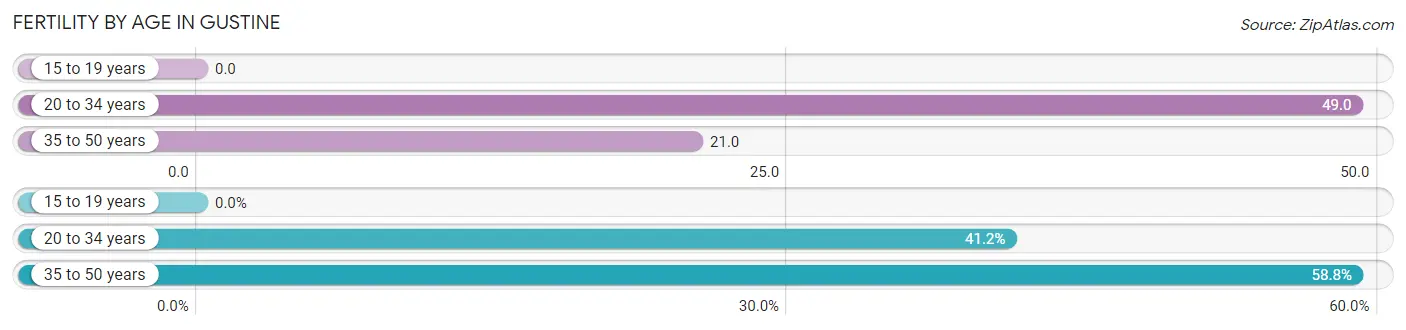
| Age Bracket | Women with Births | Births / 1,000 Women |
| 15 to 19 years | 0 (0.0%) | 0.0 |
| 20 to 34 years | 14 (41.2%) | 49.0 |
| 35 to 50 years | 20 (58.8%) | 21.0 |
| Total | 34 (100.0%) | 23.0 |
Fertility by Age by Marriage Status in Gustine
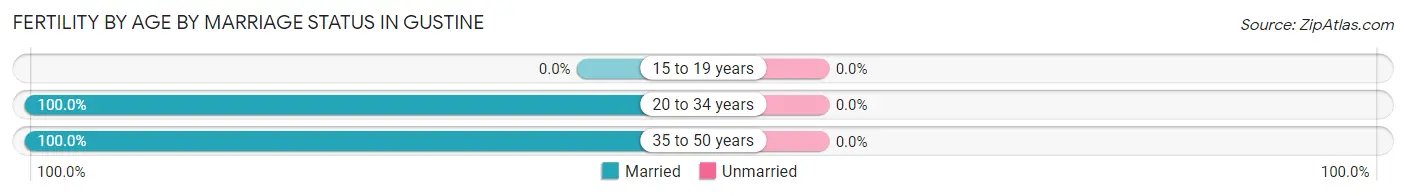
| Age Bracket | Married | Unmarried |
| 15 to 19 years | 0 (0.0%) | 0 (0.0%) |
| 20 to 34 years | 14 (100.0%) | 0 (0.0%) |
| 35 to 50 years | 20 (100.0%) | 0 (0.0%) |
| Total | 34 (100.0%) | 0 (0.0%) |
Fertility by Education in Gustine
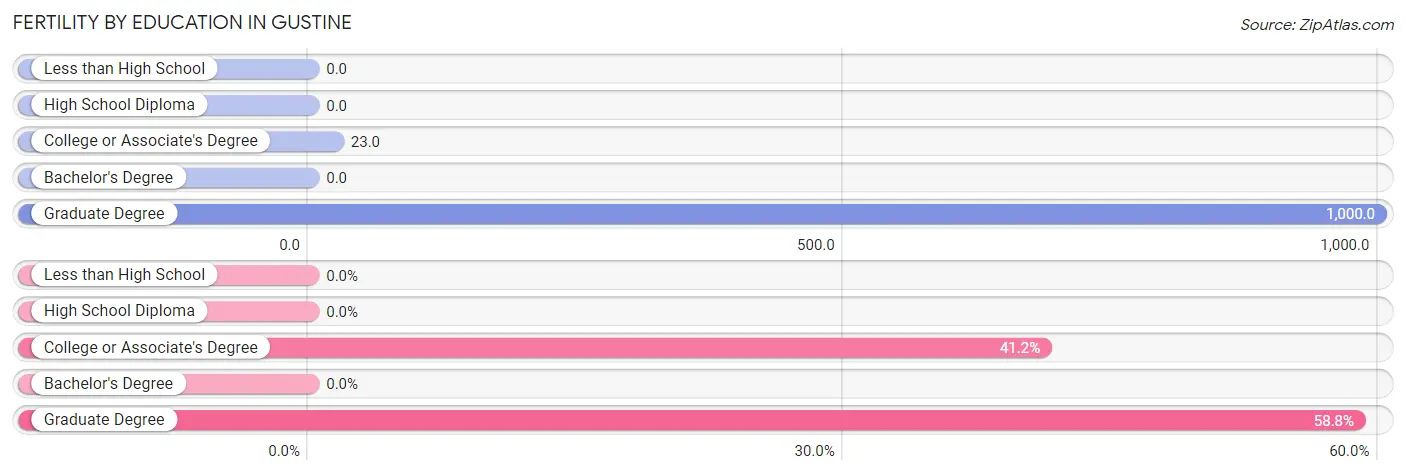
| Educational Attainment | Women with Births | Births / 1,000 Women |
| Less than High School | 0 (0.0%) | 0.0 |
| High School Diploma | 0 (0.0%) | 0.0 |
| College or Associate's Degree | 14 (41.2%) | 23.0 |
| Bachelor's Degree | 0 (0.0%) | 0.0 |
| Graduate Degree | 20 (58.8%) | 1,000.0 |
| Total | 34 (100.0%) | 23.0 |
Fertility by Education by Marriage Status in Gustine
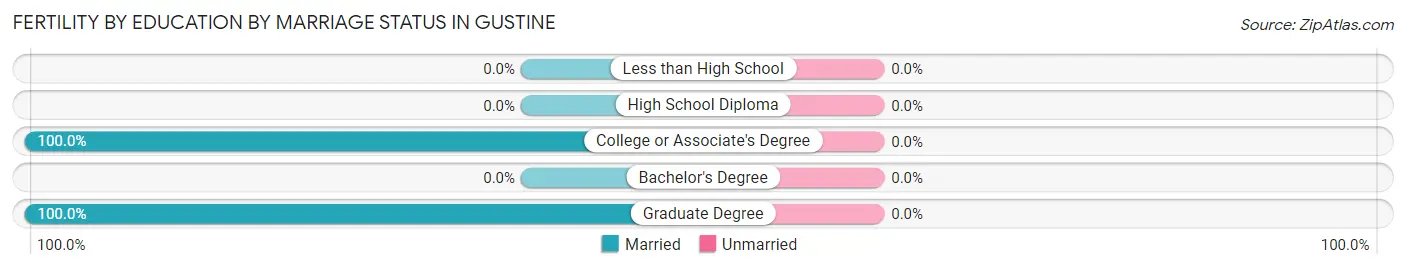
| Educational Attainment | Married | Unmarried |
| Less than High School | 0 (0.0%) | 0 (0.0%) |
| High School Diploma | 0 (0.0%) | 0 (0.0%) |
| College or Associate's Degree | 14 (100.0%) | 0 (0.0%) |
| Bachelor's Degree | 0 (0.0%) | 0 (0.0%) |
| Graduate Degree | 20 (100.0%) | 0 (0.0%) |
| Total | 34 (100.0%) | 0 (0.0%) |
Employment Characteristics in Gustine
Employment by Class of Employer in Gustine
Among the 1,821 employed individuals in Gustine, private company employees (1,438 | 79.0%), not-for-profit organizations (171 | 9.4%), and local government employees (106 | 5.8%) make up the most common classes of employment.
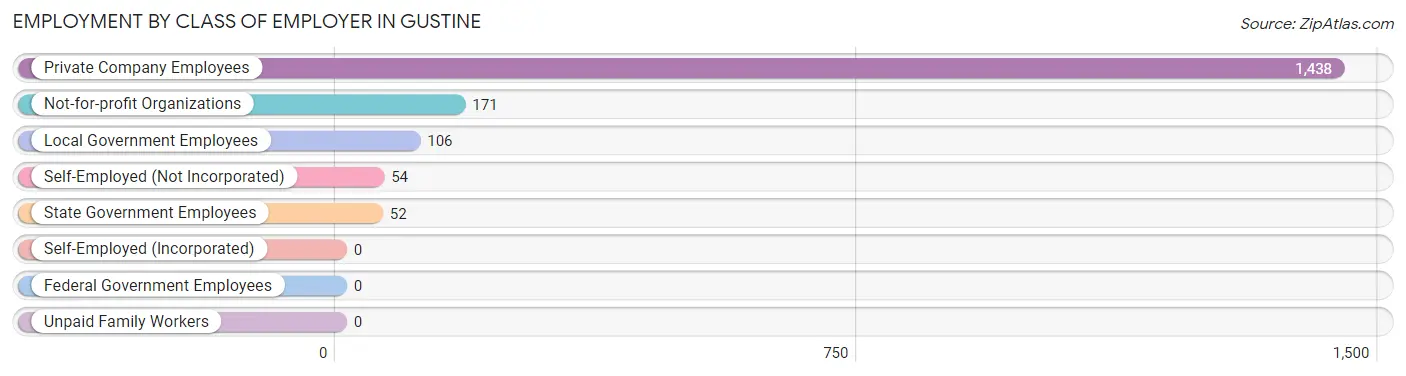
| Employer Class | # Employees | % Employees |
| Private Company Employees | 1,438 | 79.0% |
| Self-Employed (Incorporated) | 0 | 0.0% |
| Self-Employed (Not Incorporated) | 54 | 3.0% |
| Not-for-profit Organizations | 171 | 9.4% |
| Local Government Employees | 106 | 5.8% |
| State Government Employees | 52 | 2.9% |
| Federal Government Employees | 0 | 0.0% |
| Unpaid Family Workers | 0 | 0.0% |
| Total | 1,821 | 100.0% |
Employment Status by Age in Gustine
According to the labor force statistics for Gustine, out of the total population over 16 years of age (4,832), 52.0% or 2,513 individuals are in the labor force, with 14.3% or 359 of them unemployed. The age group with the highest labor force participation rate is 25 to 29 years, with 85.5% or 213 individuals in the labor force. Within the labor force, the 35 to 44 years age range has the highest percentage of unemployed individuals, with 30.2% or 195 of them being unemployed.
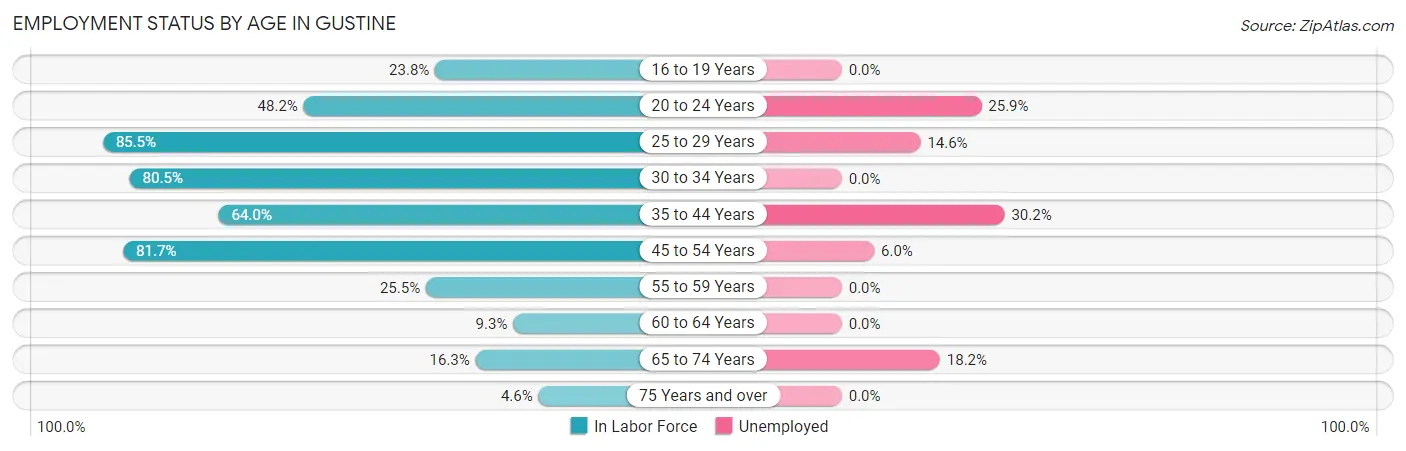
| Age Bracket | In Labor Force | Unemployed |
| 16 to 19 Years | 83 (23.8%) | 0 (0.0%) |
| 20 to 24 Years | 212 (48.2%) | 55 (25.9%) |
| 25 to 29 Years | 213 (85.5%) | 31 (14.6%) |
| 30 to 34 Years | 157 (80.5%) | 0 (0.0%) |
| 35 to 44 Years | 646 (64.0%) | 195 (30.2%) |
| 45 to 54 Years | 1,025 (81.7%) | 62 (6.0%) |
| 55 to 59 Years | 51 (25.5%) | 0 (0.0%) |
| 60 to 64 Years | 21 (9.3%) | 0 (0.0%) |
| 65 to 74 Years | 88 (16.3%) | 16 (18.2%) |
| 75 Years and over | 17 (4.6%) | 0 (0.0%) |
| Total | 2,513 (52.0%) | 359 (14.3%) |
Employment Status by Educational Attainment in Gustine
According to labor force statistics for Gustine, 67.4% of individuals (2,112) out of the total population between 25 and 64 years of age (3,134) are in the labor force, with 13.6% or 287 of them being unemployed. The group with the highest labor force participation rate are those with the educational attainment of bachelor's degree or higher, with 83.5% or 147 individuals in the labor force. Within the labor force, individuals with college / associate degree education have the highest percentage of unemployment, with 20.5% or 139 of them being unemployed.
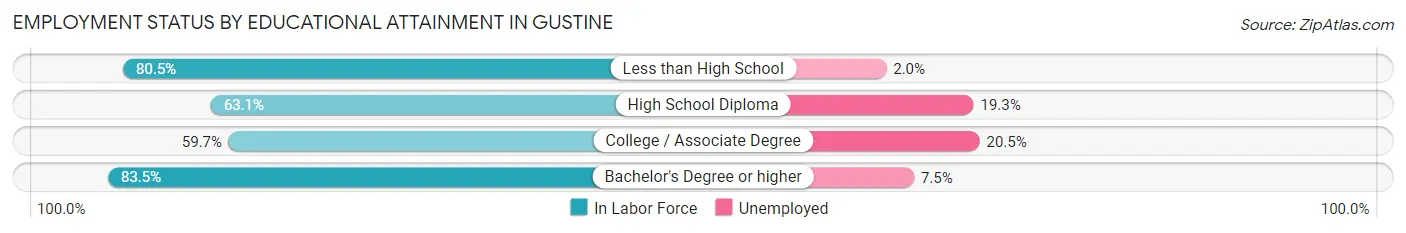
| Educational Attainment | In Labor Force | Unemployed |
| Less than High School | 642 (80.5%) | 16 (2.0%) |
| High School Diploma | 646 (63.1%) | 198 (19.3%) |
| College / Associate Degree | 678 (59.7%) | 233 (20.5%) |
| Bachelor's Degree or higher | 147 (83.5%) | 13 (7.5%) |
| Total | 2,112 (67.4%) | 426 (13.6%) |
Employment Occupations by Sex in Gustine
Management, Business, Science and Arts Occupations
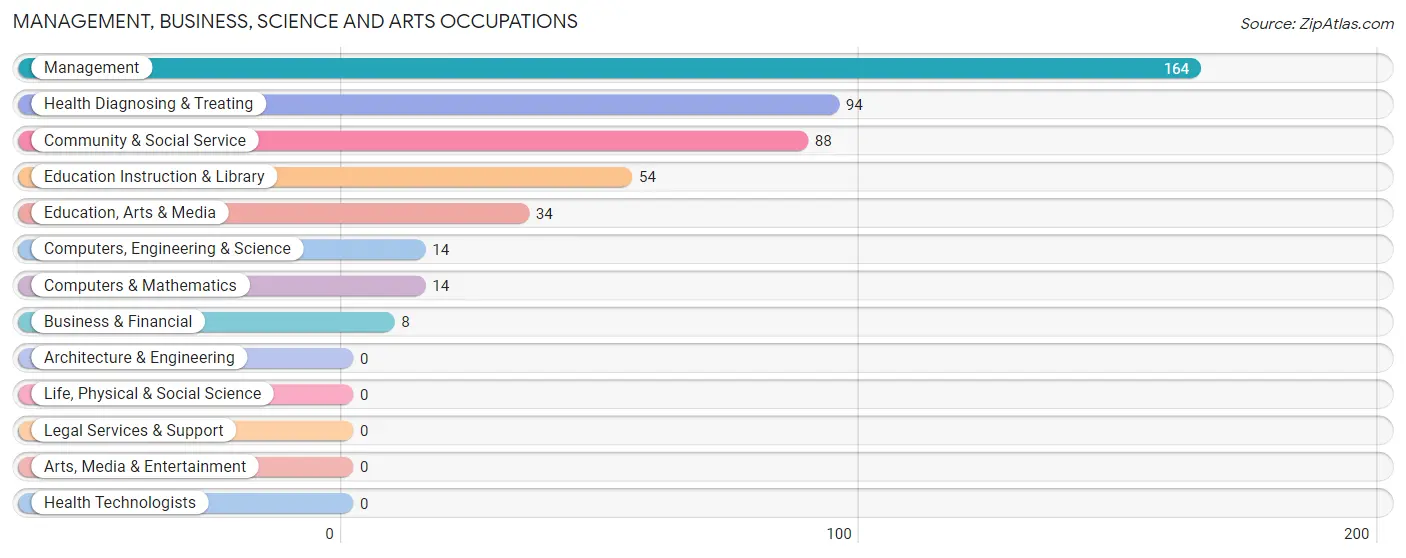
The most common Management, Business, Science and Arts occupations in Gustine are Management (164 | 7.6%), Health Diagnosing & Treating (94 | 4.4%), Community & Social Service (88 | 4.1%), Education Instruction & Library (54 | 2.5%), and Education, Arts & Media (34 | 1.6%).
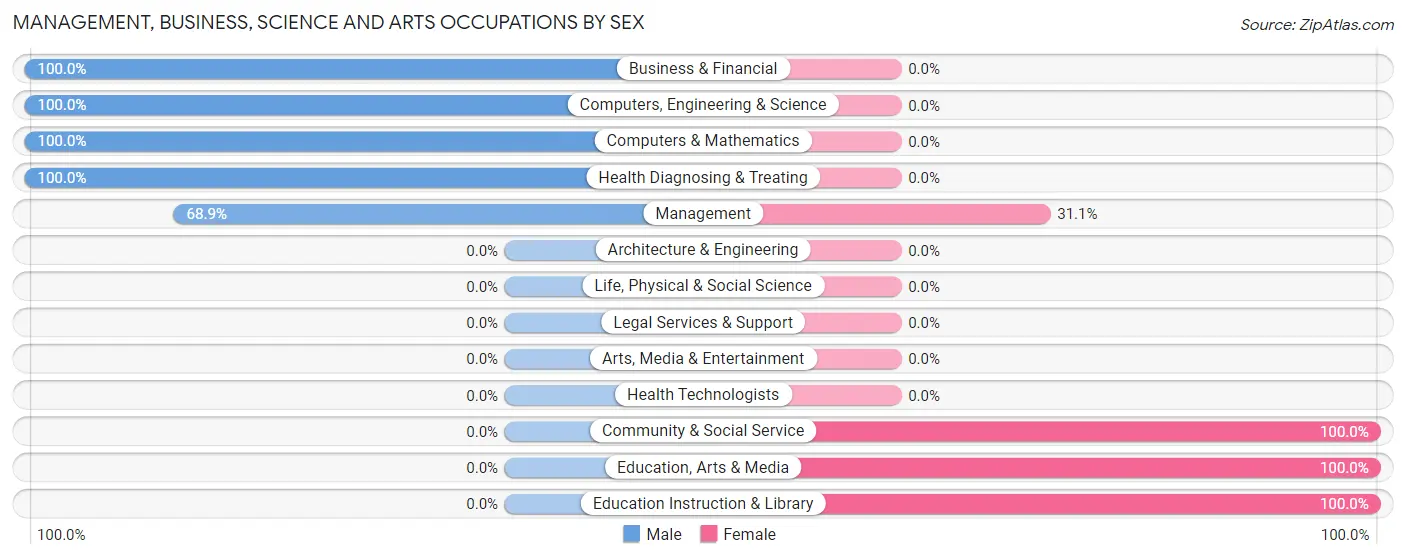
Management, Business, Science and Arts Occupations by Sex
Within the Management, Business, Science and Arts occupations in Gustine, the most male-oriented occupations are Business & Financial (100.0%), Computers, Engineering & Science (100.0%), and Computers & Mathematics (100.0%), while the most female-oriented occupations are Community & Social Service (100.0%), Education, Arts & Media (100.0%), and Education Instruction & Library (100.0%).
| Occupation | Male | Female |
| Management | 113 (68.9%) | 51 (31.1%) |
| Business & Financial | 8 (100.0%) | 0 (0.0%) |
| Computers, Engineering & Science | 14 (100.0%) | 0 (0.0%) |
| Computers & Mathematics | 14 (100.0%) | 0 (0.0%) |
| Architecture & Engineering | 0 (0.0%) | 0 (0.0%) |
| Life, Physical & Social Science | 0 (0.0%) | 0 (0.0%) |
| Community & Social Service | 0 (0.0%) | 88 (100.0%) |
| Education, Arts & Media | 0 (0.0%) | 34 (100.0%) |
| Legal Services & Support | 0 (0.0%) | 0 (0.0%) |
| Education Instruction & Library | 0 (0.0%) | 54 (100.0%) |
| Arts, Media & Entertainment | 0 (0.0%) | 0 (0.0%) |
| Health Diagnosing & Treating | 94 (100.0%) | 0 (0.0%) |
| Health Technologists | 0 (0.0%) | 0 (0.0%) |
| Total (Category) | 229 (62.2%) | 139 (37.8%) |
| Total (Overall) | 1,110 (51.5%) | 1,044 (48.5%) |
Services Occupations
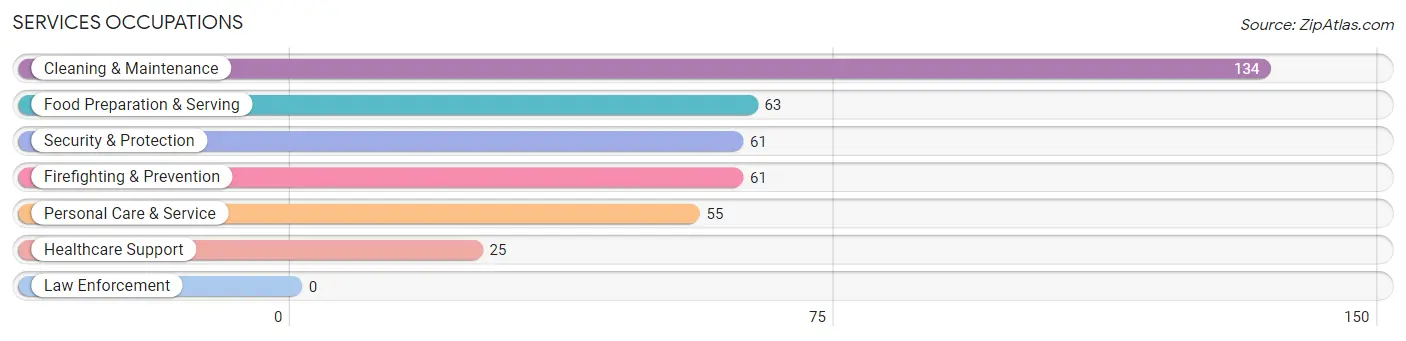
The most common Services occupations in Gustine are Cleaning & Maintenance (134 | 6.2%), Food Preparation & Serving (63 | 2.9%), Security & Protection (61 | 2.8%), Firefighting & Prevention (61 | 2.8%), and Personal Care & Service (55 | 2.5%).
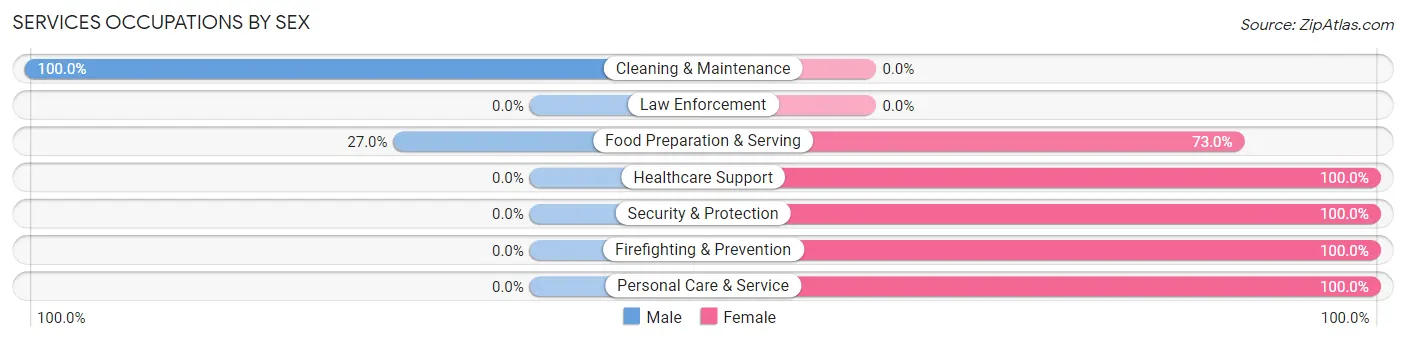
Services Occupations by Sex
Within the Services occupations in Gustine, the most male-oriented occupations are Cleaning & Maintenance (100.0%), and Food Preparation & Serving (27.0%), while the most female-oriented occupations are Healthcare Support (100.0%), Security & Protection (100.0%), and Firefighting & Prevention (100.0%).
| Occupation | Male | Female |
| Healthcare Support | 0 (0.0%) | 25 (100.0%) |
| Security & Protection | 0 (0.0%) | 61 (100.0%) |
| Firefighting & Prevention | 0 (0.0%) | 61 (100.0%) |
| Law Enforcement | 0 (0.0%) | 0 (0.0%) |
| Food Preparation & Serving | 17 (27.0%) | 46 (73.0%) |
| Cleaning & Maintenance | 134 (100.0%) | 0 (0.0%) |
| Personal Care & Service | 0 (0.0%) | 55 (100.0%) |
| Total (Category) | 151 (44.7%) | 187 (55.3%) |
| Total (Overall) | 1,110 (51.5%) | 1,044 (48.5%) |
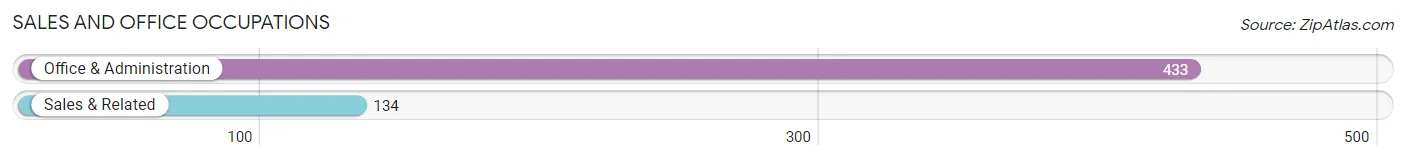
Sales and Office Occupations
The most common Sales and Office occupations in Gustine are Office & Administration (433 | 20.1%), and Sales & Related (134 | 6.2%).
Sales and Office Occupations by Sex
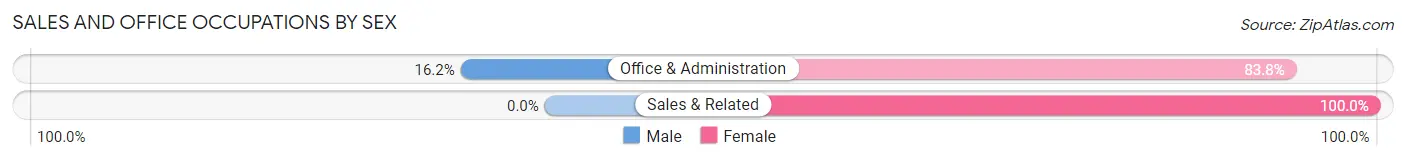
| Occupation | Male | Female |
| Sales & Related | 0 (0.0%) | 134 (100.0%) |
| Office & Administration | 70 (16.2%) | 363 (83.8%) |
| Total (Category) | 70 (12.3%) | 497 (87.6%) |
| Total (Overall) | 1,110 (51.5%) | 1,044 (48.5%) |
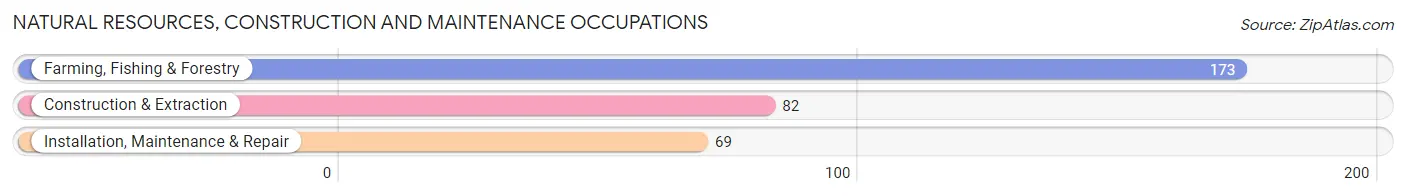
Natural Resources, Construction and Maintenance Occupations
The most common Natural Resources, Construction and Maintenance occupations in Gustine are Farming, Fishing & Forestry (173 | 8.0%), Construction & Extraction (82 | 3.8%), and Installation, Maintenance & Repair (69 | 3.2%).
Natural Resources, Construction and Maintenance Occupations by Sex
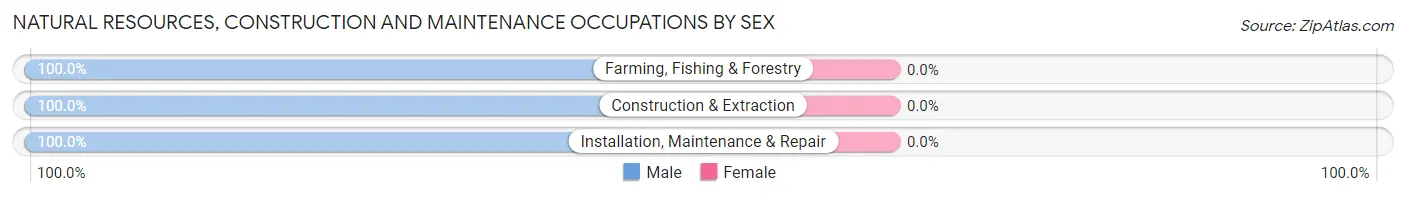
| Occupation | Male | Female |
| Farming, Fishing & Forestry | 173 (100.0%) | 0 (0.0%) |
| Construction & Extraction | 82 (100.0%) | 0 (0.0%) |
| Installation, Maintenance & Repair | 69 (100.0%) | 0 (0.0%) |
| Total (Category) | 324 (100.0%) | 0 (0.0%) |
| Total (Overall) | 1,110 (51.5%) | 1,044 (48.5%) |
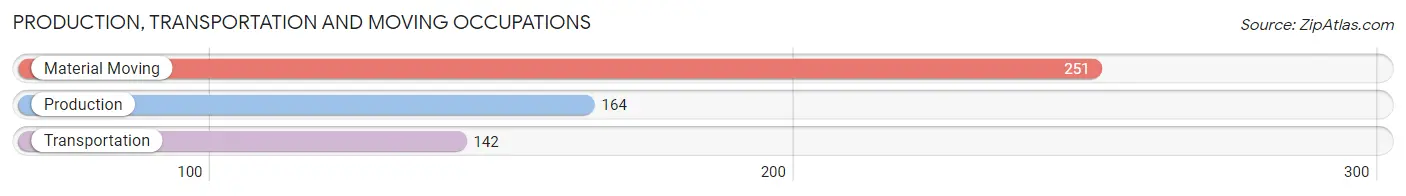
Production, Transportation and Moving Occupations
The most common Production, Transportation and Moving occupations in Gustine are Material Moving (251 | 11.7%), Production (164 | 7.6%), and Transportation (142 | 6.6%).
Production, Transportation and Moving Occupations by Sex
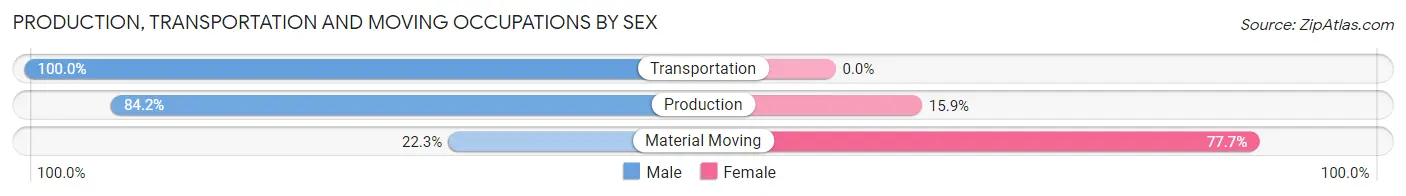
| Occupation | Male | Female |
| Production | 138 (84.2%) | 26 (15.9%) |
| Transportation | 142 (100.0%) | 0 (0.0%) |
| Material Moving | 56 (22.3%) | 195 (77.7%) |
| Total (Category) | 336 (60.3%) | 221 (39.7%) |
| Total (Overall) | 1,110 (51.5%) | 1,044 (48.5%) |
Employment Industries by Sex in Gustine
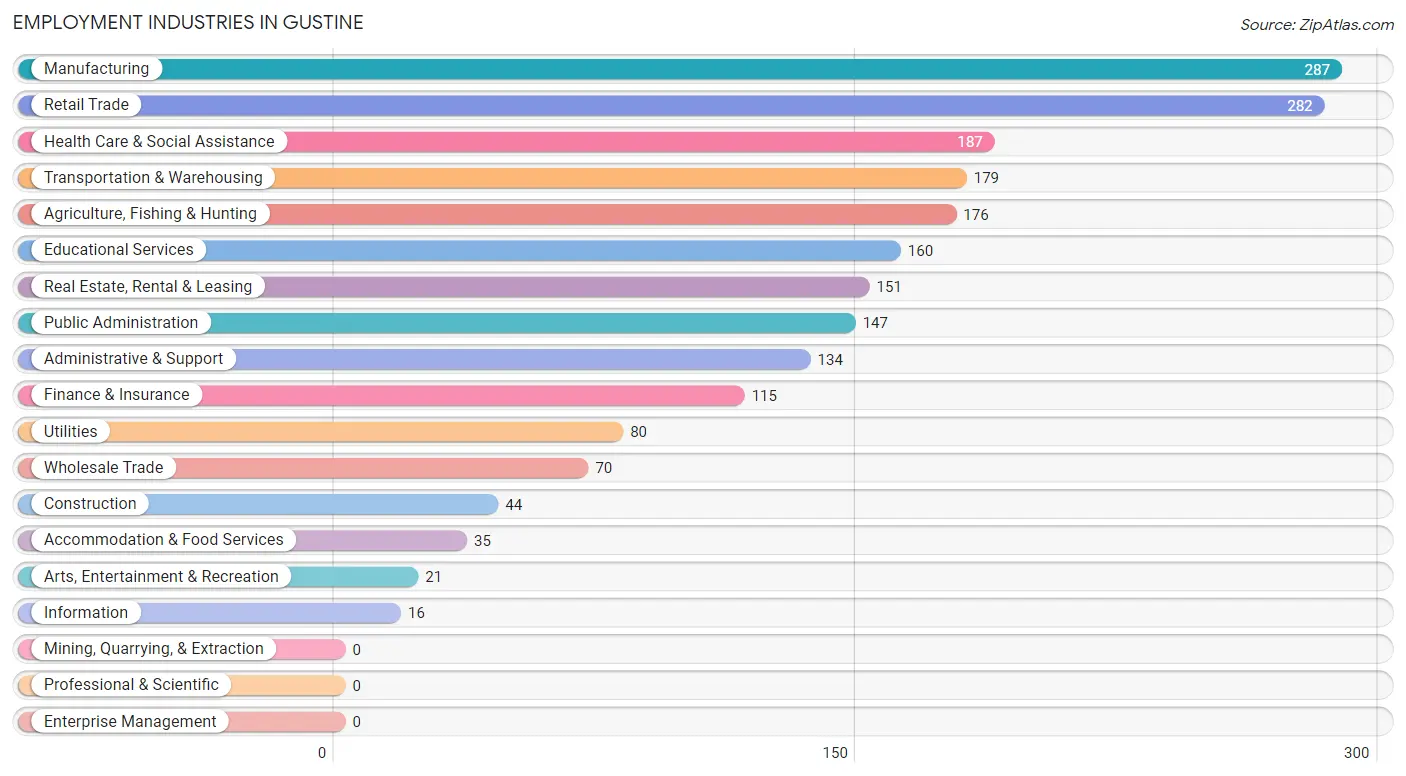
Employment Industries in Gustine
The major employment industries in Gustine include Manufacturing (287 | 13.3%), Retail Trade (282 | 13.1%), Health Care & Social Assistance (187 | 8.7%), Transportation & Warehousing (179 | 8.3%), and Agriculture, Fishing & Hunting (176 | 8.2%).
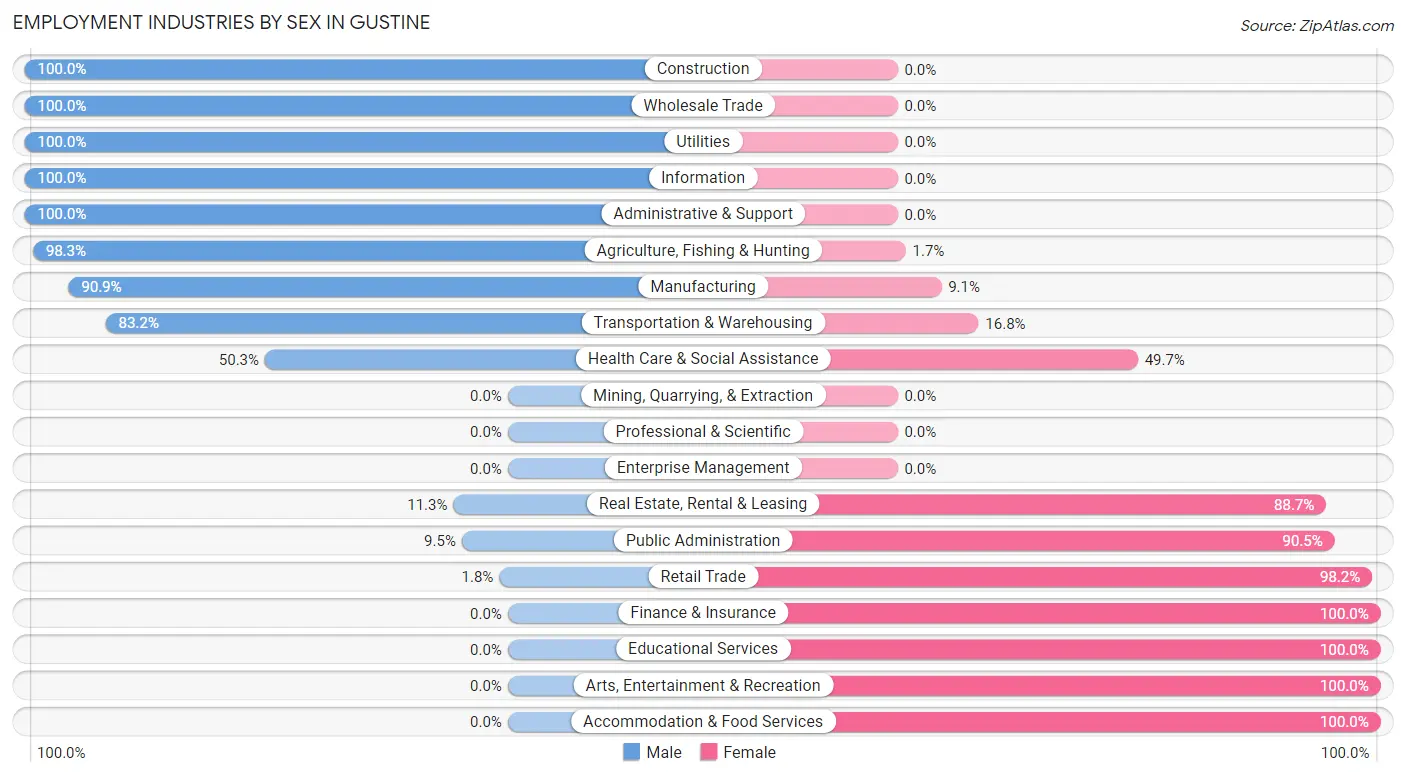
Employment Industries by Sex in Gustine
The Gustine industries that see more men than women are Construction (100.0%), Wholesale Trade (100.0%), and Utilities (100.0%), whereas the industries that tend to have a higher number of women are Finance & Insurance (100.0%), Educational Services (100.0%), and Arts, Entertainment & Recreation (100.0%).
| Industry | Male | Female |
| Agriculture, Fishing & Hunting | 173 (98.3%) | 3 (1.7%) |
| Mining, Quarrying, & Extraction | 0 (0.0%) | 0 (0.0%) |
| Construction | 44 (100.0%) | 0 (0.0%) |
| Manufacturing | 261 (90.9%) | 26 (9.1%) |
| Wholesale Trade | 70 (100.0%) | 0 (0.0%) |
| Retail Trade | 5 (1.8%) | 277 (98.2%) |
| Transportation & Warehousing | 149 (83.2%) | 30 (16.8%) |
| Utilities | 80 (100.0%) | 0 (0.0%) |
| Information | 16 (100.0%) | 0 (0.0%) |
| Finance & Insurance | 0 (0.0%) | 115 (100.0%) |
| Real Estate, Rental & Leasing | 17 (11.3%) | 134 (88.7%) |
| Professional & Scientific | 0 (0.0%) | 0 (0.0%) |
| Enterprise Management | 0 (0.0%) | 0 (0.0%) |
| Administrative & Support | 134 (100.0%) | 0 (0.0%) |
| Educational Services | 0 (0.0%) | 160 (100.0%) |
| Health Care & Social Assistance | 94 (50.3%) | 93 (49.7%) |
| Arts, Entertainment & Recreation | 0 (0.0%) | 21 (100.0%) |
| Accommodation & Food Services | 0 (0.0%) | 35 (100.0%) |
| Public Administration | 14 (9.5%) | 133 (90.5%) |
| Total | 1,110 (51.5%) | 1,044 (48.5%) |
Education in Gustine
School Enrollment in Gustine
The most common levels of schooling among the 1,512 students in Gustine are high school (572 | 37.8%), middle school (402 | 26.6%), and college / undergraduate (270 | 17.9%).
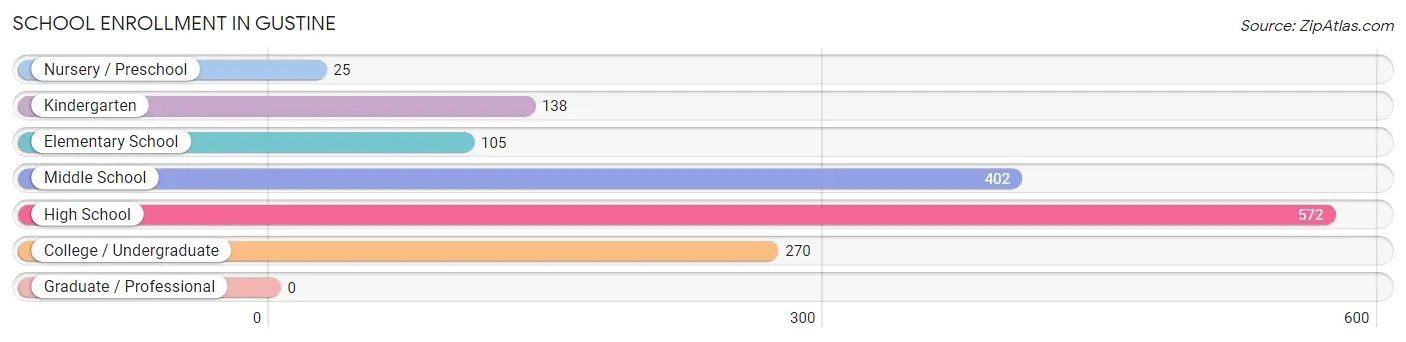
| School Level | # Students | % Students |
| Nursery / Preschool | 25 | 1.7% |
| Kindergarten | 138 | 9.1% |
| Elementary School | 105 | 6.9% |
| Middle School | 402 | 26.6% |
| High School | 572 | 37.8% |
| College / Undergraduate | 270 | 17.9% |
| Graduate / Professional | 0 | 0.0% |
| Total | 1,512 | 100.0% |
School Enrollment by Age by Funding Source in Gustine
Out of a total of 1,512 students who are enrolled in schools in Gustine, 67 (4.4%) attend a private institution, while the remaining 1,445 (95.6%) are enrolled in public schools. The age group of 5 to 9 year old has the highest likelihood of being enrolled in private schools, with 66 (24.6% in the age bracket) enrolled. Conversely, the age group of 10 to 14 year olds has the lowest likelihood of being enrolled in a private school, with 495 (100.0% in the age bracket) attending a public institution.
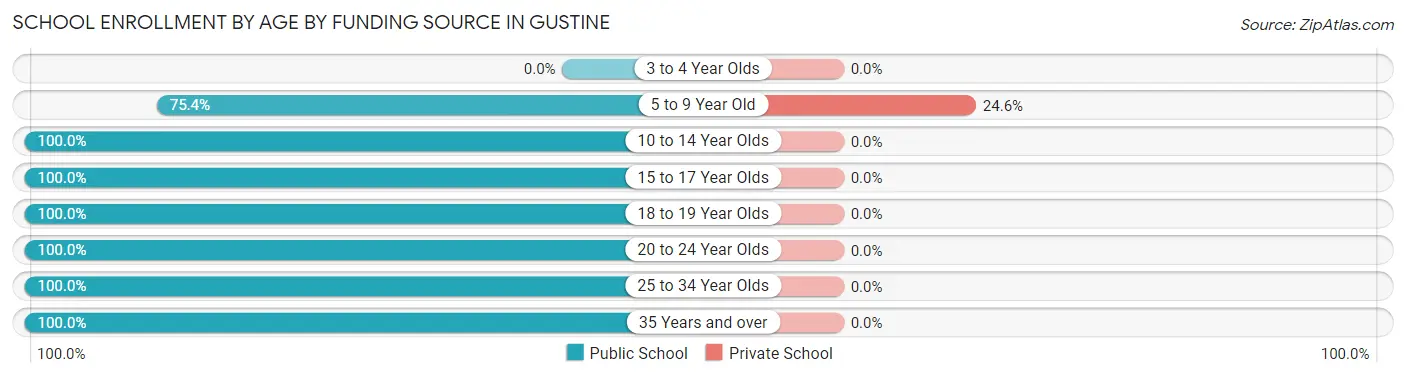
| Age Bracket | Public School | Private School |
| 3 to 4 Year Olds | 0 (0.0%) | 0 (0.0%) |
| 5 to 9 Year Old | 202 (75.4%) | 66 (24.6%) |
| 10 to 14 Year Olds | 495 (100.0%) | 0 (0.0%) |
| 15 to 17 Year Olds | 312 (100.0%) | 0 (0.0%) |
| 18 to 19 Year Olds | 94 (100.0%) | 0 (0.0%) |
| 20 to 24 Year Olds | 232 (100.0%) | 0 (0.0%) |
| 25 to 34 Year Olds | 62 (100.0%) | 0 (0.0%) |
| 35 Years and over | 49 (100.0%) | 0 (0.0%) |
| Total | 1,445 (95.6%) | 67 (4.4%) |
Educational Attainment by Field of Study in Gustine
Education (207 | 45.9%), business (57 | 12.6%), liberal arts & history (50 | 11.1%), bio, nature & agricultural (45 | 10.0%), and science & technology (29 | 6.4%) are the most common fields of study among 451 individuals in Gustine who have obtained a bachelor's degree or higher.
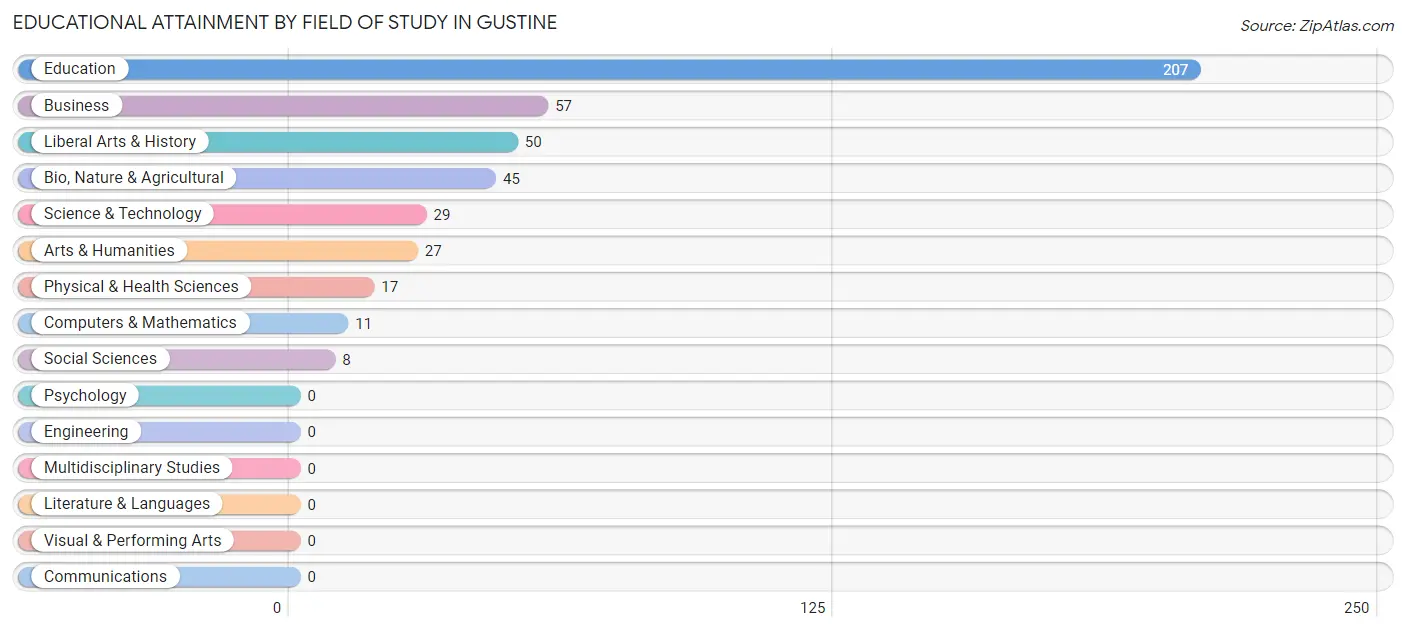
| Field of Study | # Graduates | % Graduates |
| Computers & Mathematics | 11 | 2.4% |
| Bio, Nature & Agricultural | 45 | 10.0% |
| Physical & Health Sciences | 17 | 3.8% |
| Psychology | 0 | 0.0% |
| Social Sciences | 8 | 1.8% |
| Engineering | 0 | 0.0% |
| Multidisciplinary Studies | 0 | 0.0% |
| Science & Technology | 29 | 6.4% |
| Business | 57 | 12.6% |
| Education | 207 | 45.9% |
| Literature & Languages | 0 | 0.0% |
| Liberal Arts & History | 50 | 11.1% |
| Visual & Performing Arts | 0 | 0.0% |
| Communications | 0 | 0.0% |
| Arts & Humanities | 27 | 6.0% |
| Total | 451 | 100.0% |
Transportation & Commute in Gustine
Vehicle Availability by Sex in Gustine
The most prevalent vehicle ownership categories in Gustine are males with 2 vehicles (539, accounting for 49.6%) and females with 2 vehicles (266, making up 73.3%).
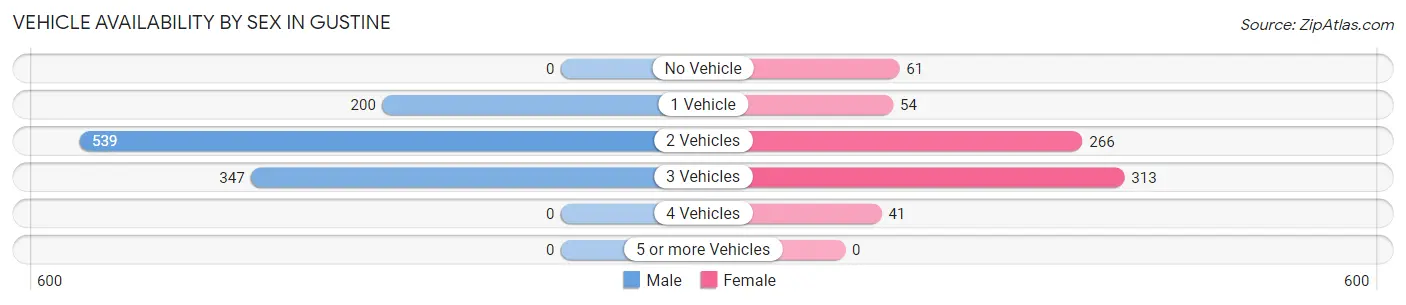
| Vehicles Available | Male | Female |
| No Vehicle | 0 (0.0%) | 61 (8.3%) |
| 1 Vehicle | 200 (18.4%) | 54 (7.3%) |
| 2 Vehicles | 539 (49.6%) | 266 (36.2%) |
| 3 Vehicles | 347 (32.0%) | 313 (42.6%) |
| 4 Vehicles | 0 (0.0%) | 41 (5.6%) |
| 5 or more Vehicles | 0 (0.0%) | 0 (0.0%) |
| Total | 1,086 (100.0%) | 735 (100.0%) |
Commute Time in Gustine
The most frequently occuring commute durations in Gustine are 5 to 9 minutes (509 commuters, 28.0%), 60 to 89 minutes (440 commuters, 24.2%), and 90 or more minutes (397 commuters, 21.8%).
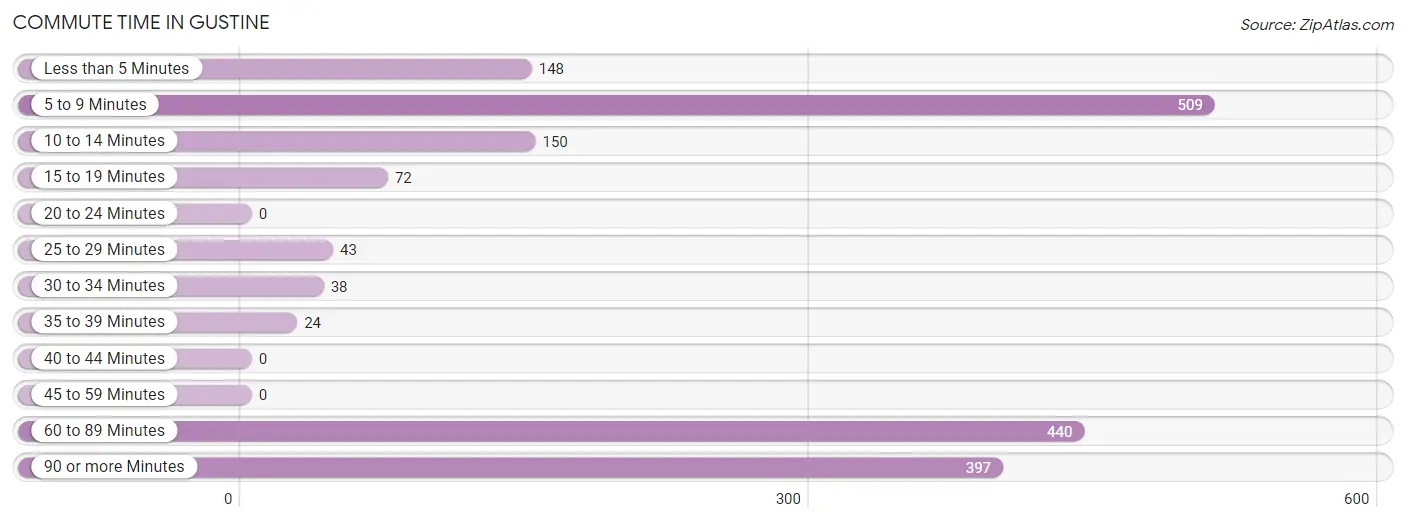
| Commute Time | # Commuters | % Commuters |
| Less than 5 Minutes | 148 | 8.1% |
| 5 to 9 Minutes | 509 | 28.0% |
| 10 to 14 Minutes | 150 | 8.2% |
| 15 to 19 Minutes | 72 | 4.0% |
| 20 to 24 Minutes | 0 | 0.0% |
| 25 to 29 Minutes | 43 | 2.4% |
| 30 to 34 Minutes | 38 | 2.1% |
| 35 to 39 Minutes | 24 | 1.3% |
| 40 to 44 Minutes | 0 | 0.0% |
| 45 to 59 Minutes | 0 | 0.0% |
| 60 to 89 Minutes | 440 | 24.2% |
| 90 or more Minutes | 397 | 21.8% |
Commute Time by Sex in Gustine
The most common commute times in Gustine are 60 to 89 minutes (399 commuters, 36.7%) for males and 5 to 9 minutes (205 commuters, 27.9%) for females.
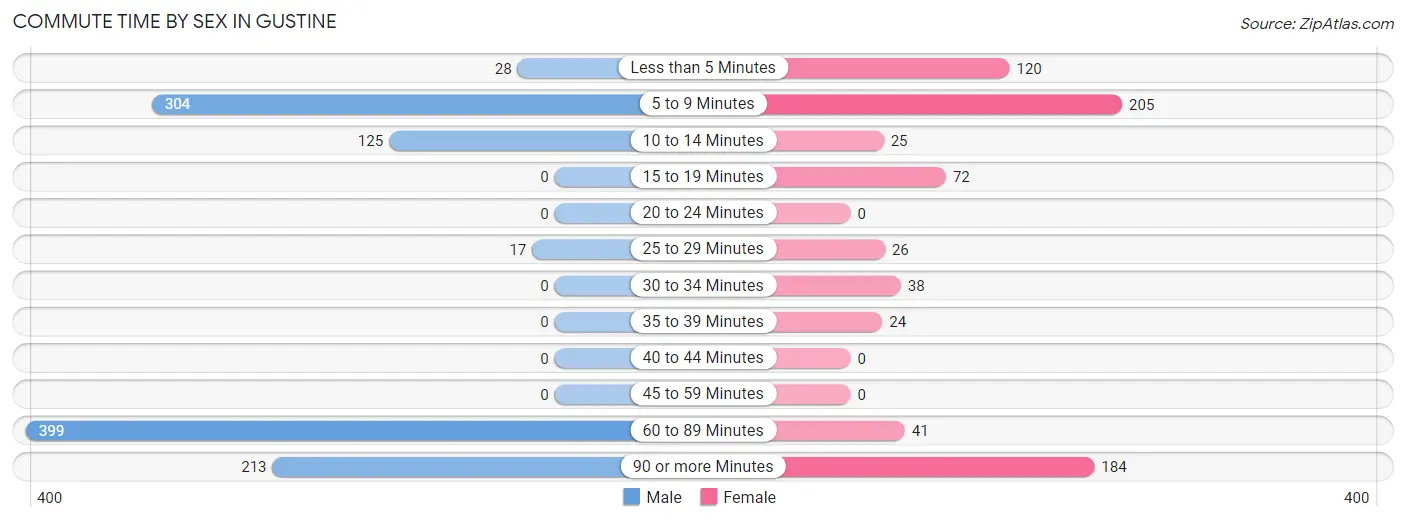
| Commute Time | Male | Female |
| Less than 5 Minutes | 28 (2.6%) | 120 (16.3%) |
| 5 to 9 Minutes | 304 (28.0%) | 205 (27.9%) |
| 10 to 14 Minutes | 125 (11.5%) | 25 (3.4%) |
| 15 to 19 Minutes | 0 (0.0%) | 72 (9.8%) |
| 20 to 24 Minutes | 0 (0.0%) | 0 (0.0%) |
| 25 to 29 Minutes | 17 (1.6%) | 26 (3.5%) |
| 30 to 34 Minutes | 0 (0.0%) | 38 (5.2%) |
| 35 to 39 Minutes | 0 (0.0%) | 24 (3.3%) |
| 40 to 44 Minutes | 0 (0.0%) | 0 (0.0%) |
| 45 to 59 Minutes | 0 (0.0%) | 0 (0.0%) |
| 60 to 89 Minutes | 399 (36.7%) | 41 (5.6%) |
| 90 or more Minutes | 213 (19.6%) | 184 (25.0%) |
Time of Departure to Work by Sex in Gustine
The most frequent times of departure to work in Gustine are 12:00 AM to 4:59 AM (332, 30.6%) for males and 5:00 AM to 5:29 AM (171, 23.3%) for females.
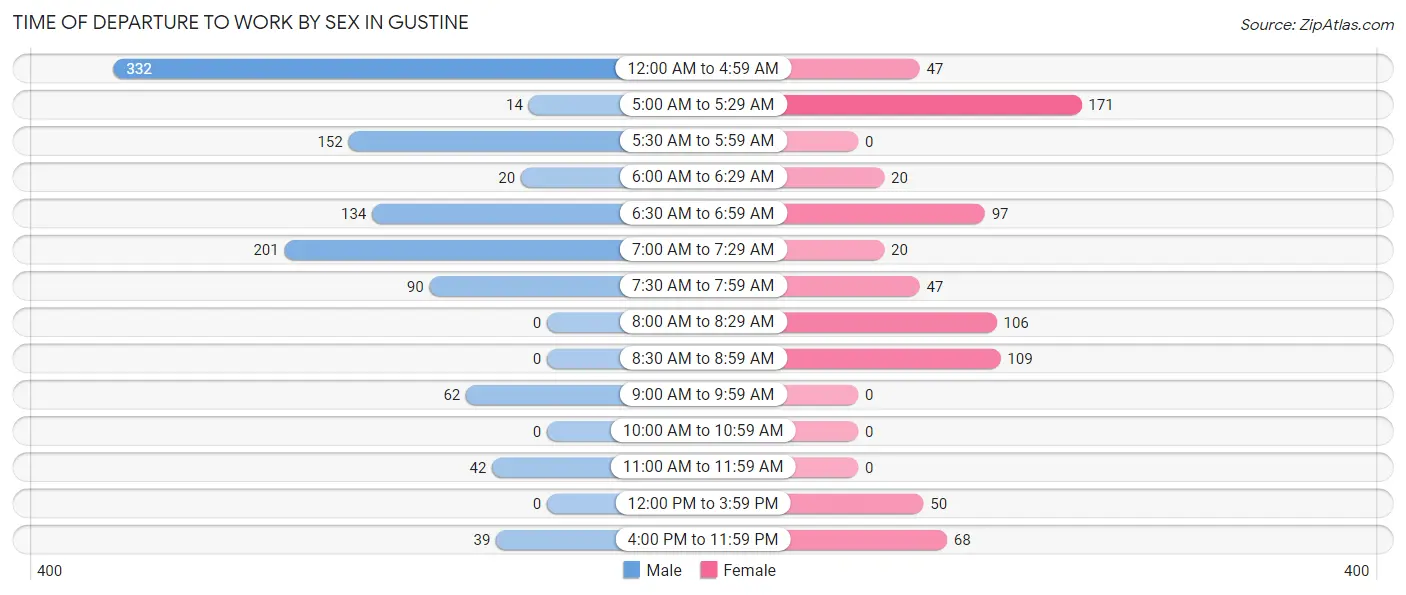
| Time of Departure | Male | Female |
| 12:00 AM to 4:59 AM | 332 (30.6%) | 47 (6.4%) |
| 5:00 AM to 5:29 AM | 14 (1.3%) | 171 (23.3%) |
| 5:30 AM to 5:59 AM | 152 (14.0%) | 0 (0.0%) |
| 6:00 AM to 6:29 AM | 20 (1.8%) | 20 (2.7%) |
| 6:30 AM to 6:59 AM | 134 (12.3%) | 97 (13.2%) |
| 7:00 AM to 7:29 AM | 201 (18.5%) | 20 (2.7%) |
| 7:30 AM to 7:59 AM | 90 (8.3%) | 47 (6.4%) |
| 8:00 AM to 8:29 AM | 0 (0.0%) | 106 (14.4%) |
| 8:30 AM to 8:59 AM | 0 (0.0%) | 109 (14.8%) |
| 9:00 AM to 9:59 AM | 62 (5.7%) | 0 (0.0%) |
| 10:00 AM to 10:59 AM | 0 (0.0%) | 0 (0.0%) |
| 11:00 AM to 11:59 AM | 42 (3.9%) | 0 (0.0%) |
| 12:00 PM to 3:59 PM | 0 (0.0%) | 50 (6.8%) |
| 4:00 PM to 11:59 PM | 39 (3.6%) | 68 (9.2%) |
| Total | 1,086 (100.0%) | 735 (100.0%) |
Housing Occupancy in Gustine
Occupancy by Ownership in Gustine
Of the total 2,307 dwellings in Gustine, owner-occupied units account for 1,174 (50.9%), while renter-occupied units make up 1,133 (49.1%).
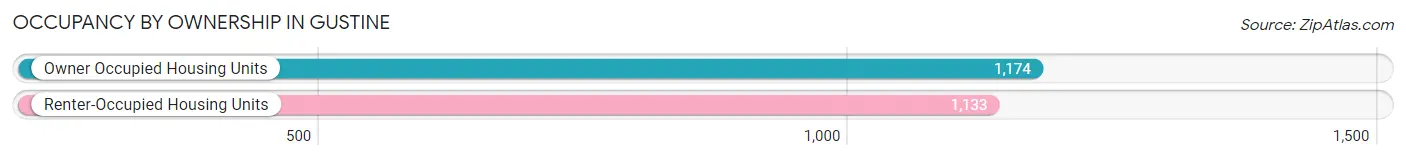
| Occupancy | # Housing Units | % Housing Units |
| Owner Occupied Housing Units | 1,174 | 50.9% |
| Renter-Occupied Housing Units | 1,133 | 49.1% |
| Total Occupied Housing Units | 2,307 | 100.0% |
Occupancy by Household Size in Gustine
| Household Size | # Housing Units | % Housing Units |
| 1-Person Household | 626 | 27.1% |
| 2-Person Household | 686 | 29.7% |
| 3-Person Household | 499 | 21.6% |
| 4+ Person Household | 496 | 21.5% |
| Total Housing Units | 2,307 | 100.0% |
Occupancy by Ownership by Household Size in Gustine
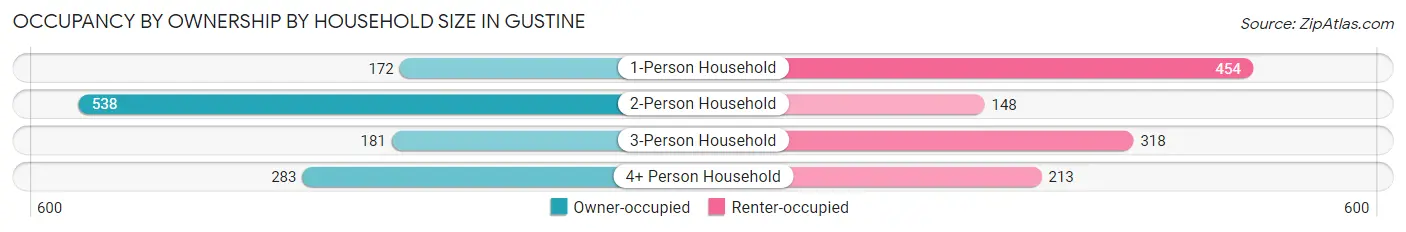
| Household Size | Owner-occupied | Renter-occupied |
| 1-Person Household | 172 (27.5%) | 454 (72.5%) |
| 2-Person Household | 538 (78.4%) | 148 (21.6%) |
| 3-Person Household | 181 (36.3%) | 318 (63.7%) |
| 4+ Person Household | 283 (57.1%) | 213 (42.9%) |
| Total Housing Units | 1,174 (50.9%) | 1,133 (49.1%) |
Occupancy by Educational Attainment in Gustine
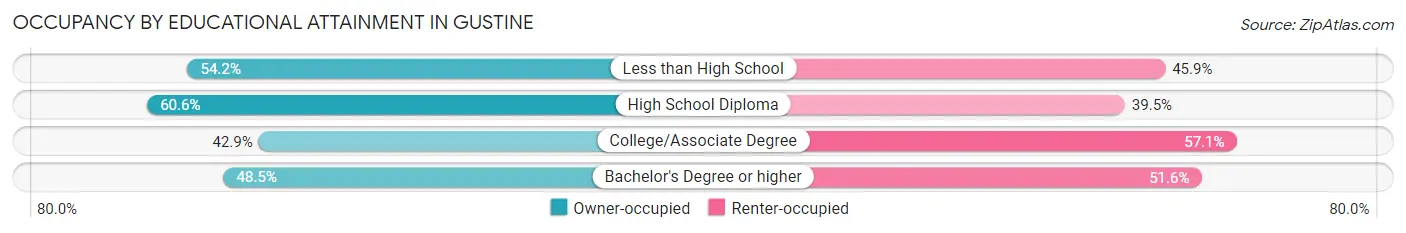
| Household Size | Owner-occupied | Renter-occupied |
| Less than High School | 209 (54.1%) | 177 (45.9%) |
| High School Diploma | 416 (60.6%) | 271 (39.5%) |
| College/Associate Degree | 377 (42.9%) | 502 (57.1%) |
| Bachelor's Degree or higher | 172 (48.4%) | 183 (51.5%) |
Occupancy by Age of Householder in Gustine
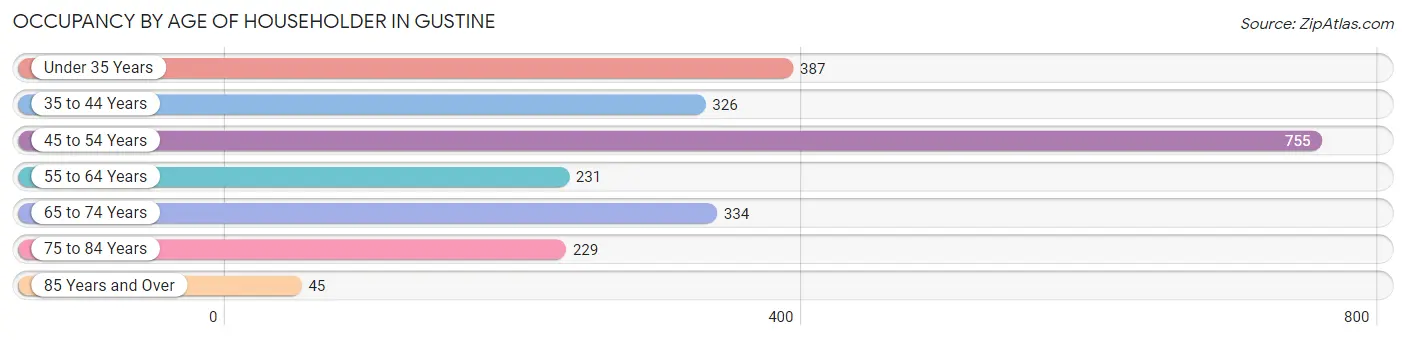
| Age Bracket | # Households | % Households |
| Under 35 Years | 387 | 16.8% |
| 35 to 44 Years | 326 | 14.1% |
| 45 to 54 Years | 755 | 32.7% |
| 55 to 64 Years | 231 | 10.0% |
| 65 to 74 Years | 334 | 14.5% |
| 75 to 84 Years | 229 | 9.9% |
| 85 Years and Over | 45 | 1.9% |
| Total | 2,307 | 100.0% |
Housing Finances in Gustine
Median Income by Occupancy in Gustine
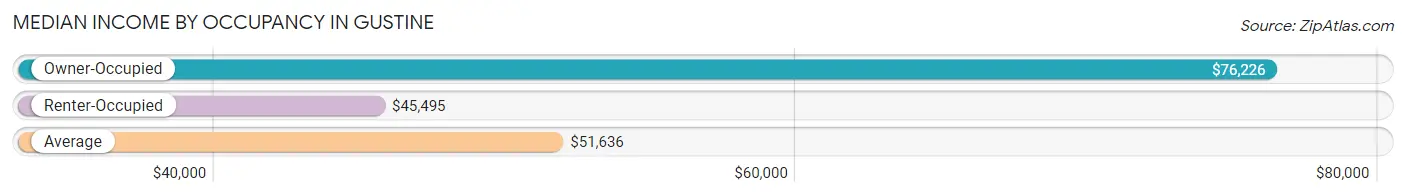
| Occupancy Type | # Households | Median Income |
| Owner-Occupied | 1,174 (50.9%) | $76,226 |
| Renter-Occupied | 1,133 (49.1%) | $45,495 |
| Average | 2,307 (100.0%) | $51,636 |
Occupancy by Householder Income Bracket in Gustine
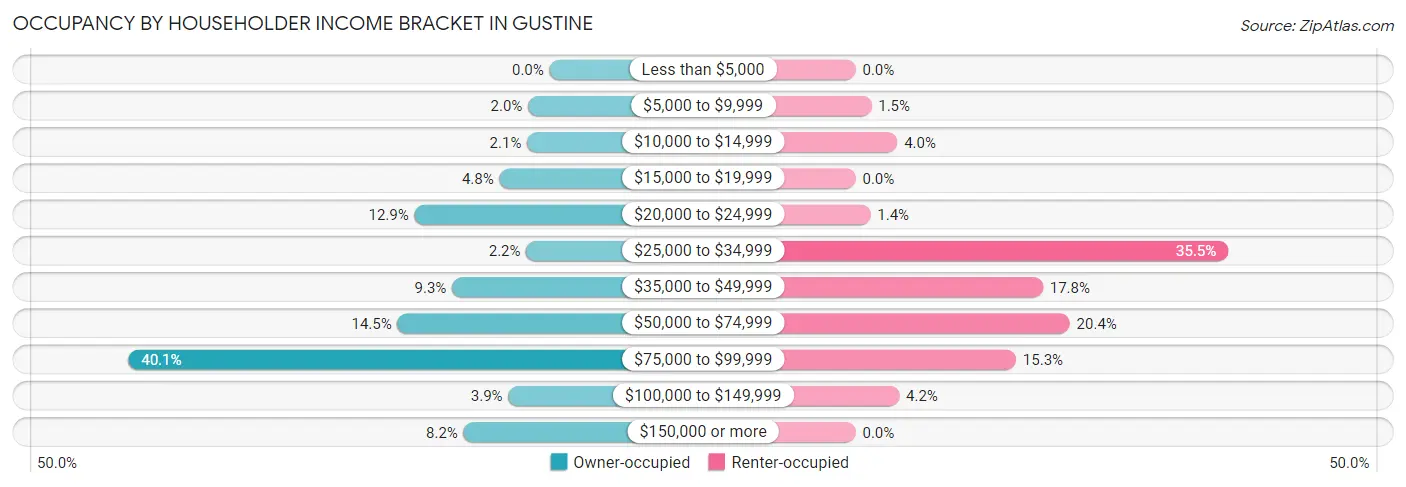
| Income Bracket | Owner-occupied | Renter-occupied |
| Less than $5,000 | 0 (0.0%) | 0 (0.0%) |
| $5,000 to $9,999 | 24 (2.0%) | 17 (1.5%) |
| $10,000 to $14,999 | 25 (2.1%) | 45 (4.0%) |
| $15,000 to $19,999 | 56 (4.8%) | 0 (0.0%) |
| $20,000 to $24,999 | 151 (12.9%) | 16 (1.4%) |
| $25,000 to $34,999 | 26 (2.2%) | 402 (35.5%) |
| $35,000 to $49,999 | 109 (9.3%) | 202 (17.8%) |
| $50,000 to $74,999 | 170 (14.5%) | 231 (20.4%) |
| $75,000 to $99,999 | 471 (40.1%) | 173 (15.3%) |
| $100,000 to $149,999 | 46 (3.9%) | 47 (4.2%) |
| $150,000 or more | 96 (8.2%) | 0 (0.0%) |
| Total | 1,174 (100.0%) | 1,133 (100.0%) |
Monthly Housing Cost Tiers in Gustine
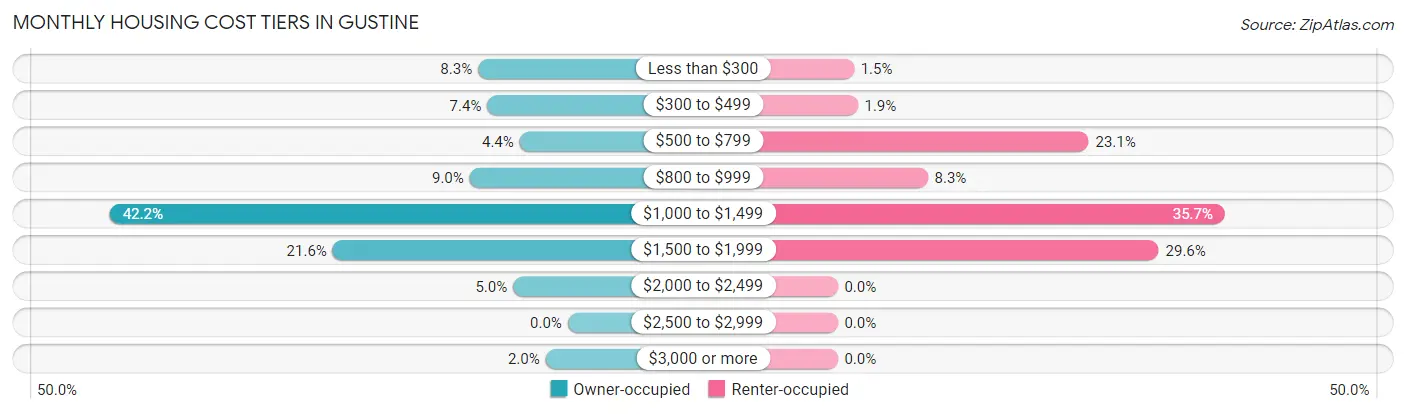
| Monthly Cost | Owner-occupied | Renter-occupied |
| Less than $300 | 97 (8.3%) | 17 (1.5%) |
| $300 to $499 | 87 (7.4%) | 21 (1.8%) |
| $500 to $799 | 52 (4.4%) | 262 (23.1%) |
| $800 to $999 | 106 (9.0%) | 94 (8.3%) |
| $1,000 to $1,499 | 495 (42.2%) | 404 (35.7%) |
| $1,500 to $1,999 | 254 (21.6%) | 335 (29.6%) |
| $2,000 to $2,499 | 59 (5.0%) | 0 (0.0%) |
| $2,500 to $2,999 | 0 (0.0%) | 0 (0.0%) |
| $3,000 or more | 24 (2.0%) | 0 (0.0%) |
| Total | 1,174 (100.0%) | 1,133 (100.0%) |
Physical Housing Characteristics in Gustine
Housing Structures in Gustine
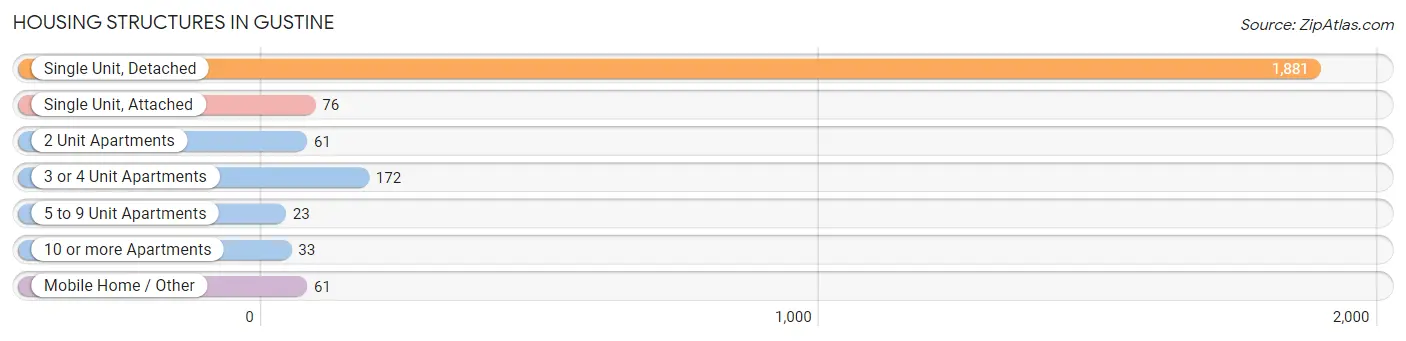
| Structure Type | # Housing Units | % Housing Units |
| Single Unit, Detached | 1,881 | 81.5% |
| Single Unit, Attached | 76 | 3.3% |
| 2 Unit Apartments | 61 | 2.6% |
| 3 or 4 Unit Apartments | 172 | 7.5% |
| 5 to 9 Unit Apartments | 23 | 1.0% |
| 10 or more Apartments | 33 | 1.4% |
| Mobile Home / Other | 61 | 2.6% |
| Total | 2,307 | 100.0% |
Housing Structures by Occupancy in Gustine
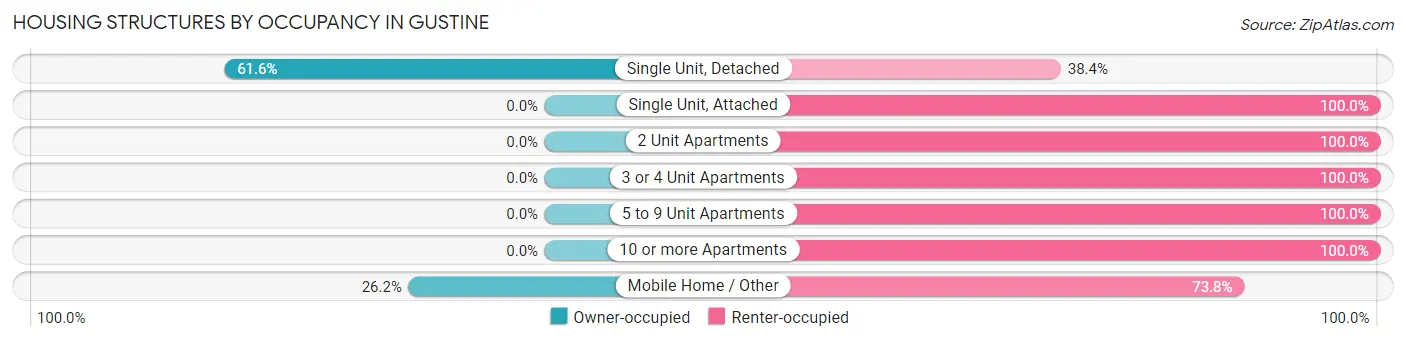
| Structure Type | Owner-occupied | Renter-occupied |
| Single Unit, Detached | 1,158 (61.6%) | 723 (38.4%) |
| Single Unit, Attached | 0 (0.0%) | 76 (100.0%) |
| 2 Unit Apartments | 0 (0.0%) | 61 (100.0%) |
| 3 or 4 Unit Apartments | 0 (0.0%) | 172 (100.0%) |
| 5 to 9 Unit Apartments | 0 (0.0%) | 23 (100.0%) |
| 10 or more Apartments | 0 (0.0%) | 33 (100.0%) |
| Mobile Home / Other | 16 (26.2%) | 45 (73.8%) |
| Total | 1,174 (50.9%) | 1,133 (49.1%) |
Housing Structures by Number of Rooms in Gustine
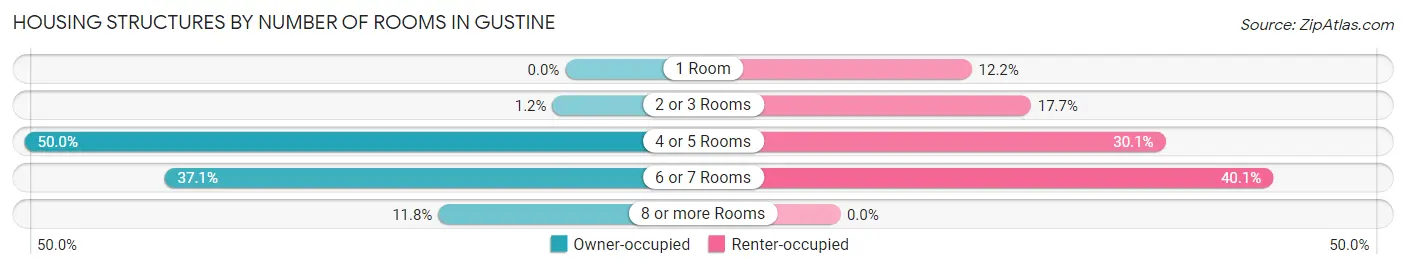
| Number of Rooms | Owner-occupied | Renter-occupied |
| 1 Room | 0 (0.0%) | 138 (12.2%) |
| 2 or 3 Rooms | 14 (1.2%) | 200 (17.6%) |
| 4 or 5 Rooms | 587 (50.0%) | 341 (30.1%) |
| 6 or 7 Rooms | 435 (37.0%) | 454 (40.1%) |
| 8 or more Rooms | 138 (11.7%) | 0 (0.0%) |
| Total | 1,174 (100.0%) | 1,133 (100.0%) |
Housing Structure by Heating Type in Gustine
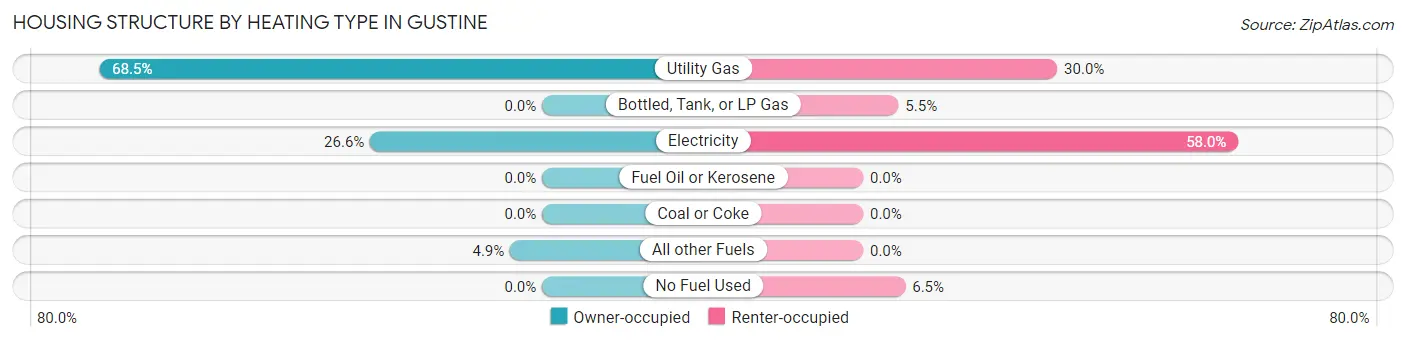
| Heating Type | Owner-occupied | Renter-occupied |
| Utility Gas | 804 (68.5%) | 340 (30.0%) |
| Bottled, Tank, or LP Gas | 0 (0.0%) | 62 (5.5%) |
| Electricity | 312 (26.6%) | 657 (58.0%) |
| Fuel Oil or Kerosene | 0 (0.0%) | 0 (0.0%) |
| Coal or Coke | 0 (0.0%) | 0 (0.0%) |
| All other Fuels | 58 (4.9%) | 0 (0.0%) |
| No Fuel Used | 0 (0.0%) | 74 (6.5%) |
| Total | 1,174 (100.0%) | 1,133 (100.0%) |
Household Vehicle Usage in Gustine
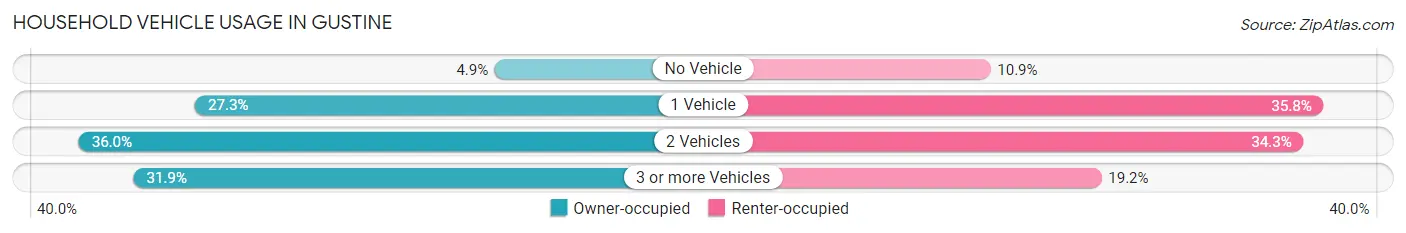
| Vehicles per Household | Owner-occupied | Renter-occupied |
| No Vehicle | 58 (4.9%) | 123 (10.9%) |
| 1 Vehicle | 320 (27.3%) | 405 (35.7%) |
| 2 Vehicles | 422 (35.9%) | 388 (34.3%) |
| 3 or more Vehicles | 374 (31.9%) | 217 (19.2%) |
| Total | 1,174 (100.0%) | 1,133 (100.0%) |
Real Estate & Mortgages in Gustine
Real Estate and Mortgage Overview in Gustine
| Characteristic | Without Mortgage | With Mortgage |
| Housing Units | 244 | 930 |
| Median Property Value | $292,000 | $423,400 |
| Median Household Income | $76,000 | $53 |
| Monthly Housing Costs | $373 | $24 |
| Real Estate Taxes | $1,463 | $0 |
Property Value by Mortgage Status in Gustine
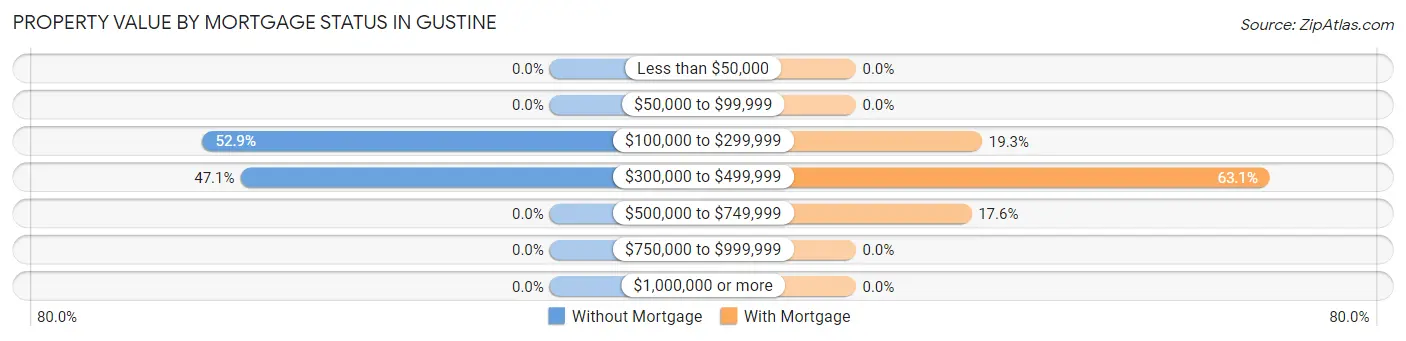
| Property Value | Without Mortgage | With Mortgage |
| Less than $50,000 | 0 (0.0%) | 0 (0.0%) |
| $50,000 to $99,999 | 0 (0.0%) | 0 (0.0%) |
| $100,000 to $299,999 | 129 (52.9%) | 179 (19.3%) |
| $300,000 to $499,999 | 115 (47.1%) | 587 (63.1%) |
| $500,000 to $749,999 | 0 (0.0%) | 164 (17.6%) |
| $750,000 to $999,999 | 0 (0.0%) | 0 (0.0%) |
| $1,000,000 or more | 0 (0.0%) | 0 (0.0%) |
| Total | 244 (100.0%) | 930 (100.0%) |
Household Income by Mortgage Status in Gustine
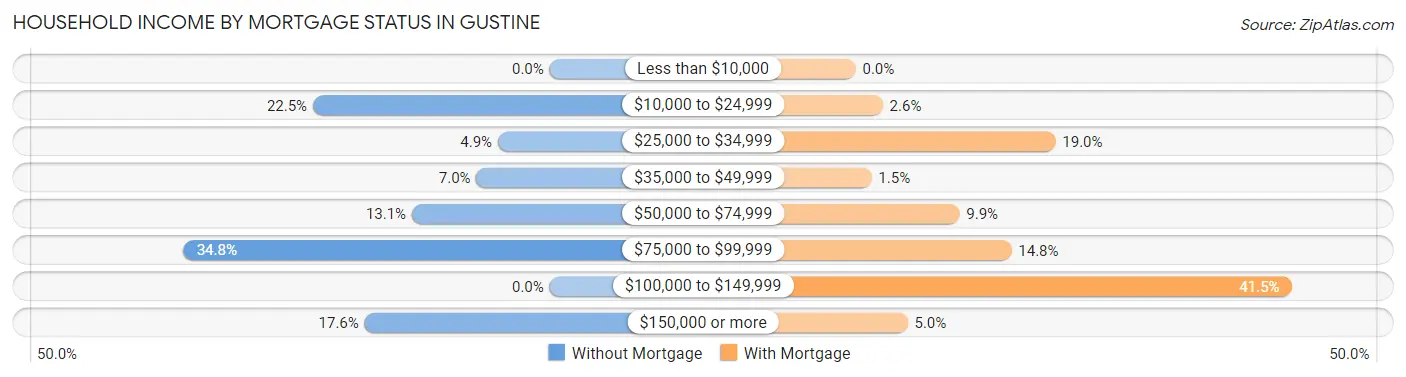
| Household Income | Without Mortgage | With Mortgage |
| Less than $10,000 | 0 (0.0%) | 0 (0.0%) |
| $10,000 to $24,999 | 55 (22.5%) | 24 (2.6%) |
| $25,000 to $34,999 | 12 (4.9%) | 177 (19.0%) |
| $35,000 to $49,999 | 17 (7.0%) | 14 (1.5%) |
| $50,000 to $74,999 | 32 (13.1%) | 92 (9.9%) |
| $75,000 to $99,999 | 85 (34.8%) | 138 (14.8%) |
| $100,000 to $149,999 | 0 (0.0%) | 386 (41.5%) |
| $150,000 or more | 43 (17.6%) | 46 (5.0%) |
| Total | 244 (100.0%) | 930 (100.0%) |
Property Value to Household Income Ratio in Gustine
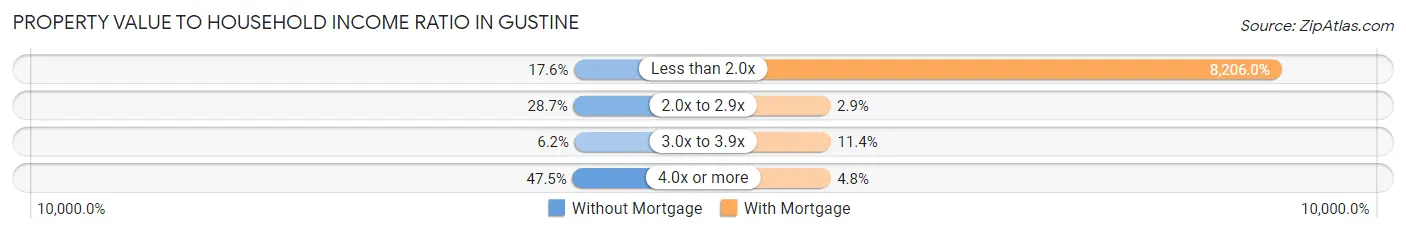
| Value-to-Income Ratio | Without Mortgage | With Mortgage |
| Less than 2.0x | 43 (17.6%) | 76,316 (8,206.0%) |
| 2.0x to 2.9x | 70 (28.7%) | 27 (2.9%) |
| 3.0x to 3.9x | 15 (6.1%) | 106 (11.4%) |
| 4.0x or more | 116 (47.5%) | 45 (4.8%) |
| Total | 244 (100.0%) | 930 (100.0%) |
Real Estate Taxes by Mortgage Status in Gustine
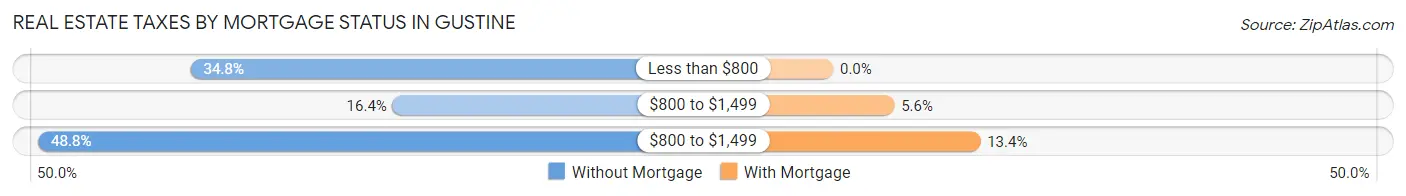
| Property Taxes | Without Mortgage | With Mortgage |
| Less than $800 | 85 (34.8%) | 0 (0.0%) |
| $800 to $1,499 | 40 (16.4%) | 52 (5.6%) |
| $800 to $1,499 | 119 (48.8%) | 125 (13.4%) |
| Total | 244 (100.0%) | 930 (100.0%) |
Health & Disability in Gustine
Health Insurance Coverage by Age in Gustine
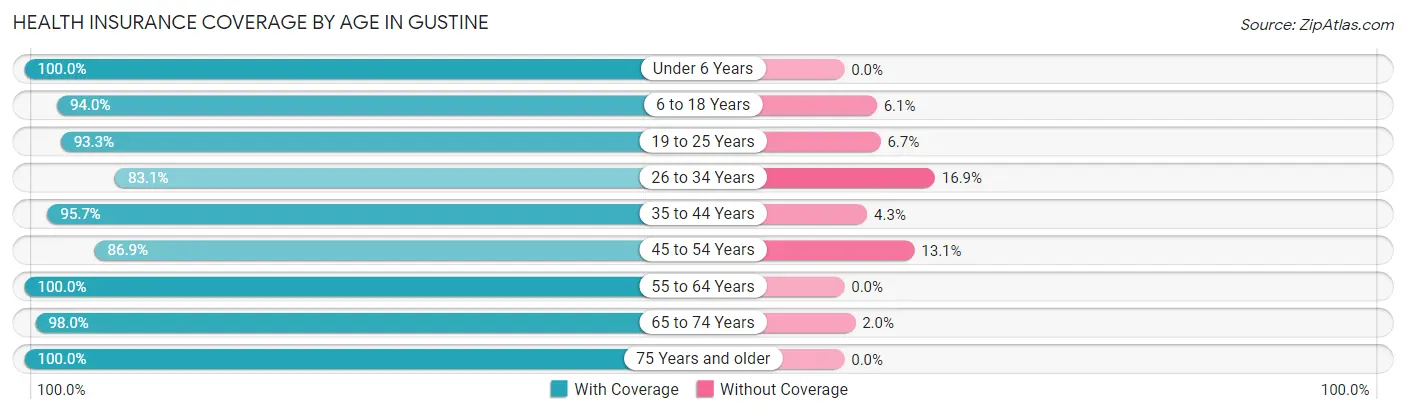
| Age Bracket | With Coverage | Without Coverage |
| Under 6 Years | 289 (100.0%) | 0 (0.0%) |
| 6 to 18 Years | 1,180 (94.0%) | 76 (6.0%) |
| 19 to 25 Years | 498 (93.3%) | 36 (6.7%) |
| 26 to 34 Years | 369 (83.1%) | 75 (16.9%) |
| 35 to 44 Years | 967 (95.7%) | 43 (4.3%) |
| 45 to 54 Years | 1,091 (86.9%) | 164 (13.1%) |
| 55 to 64 Years | 425 (100.0%) | 0 (0.0%) |
| 65 to 74 Years | 530 (98.0%) | 11 (2.0%) |
| 75 Years and older | 368 (100.0%) | 0 (0.0%) |
| Total | 5,717 (93.4%) | 405 (6.6%) |
Health Insurance Coverage by Citizenship Status in Gustine
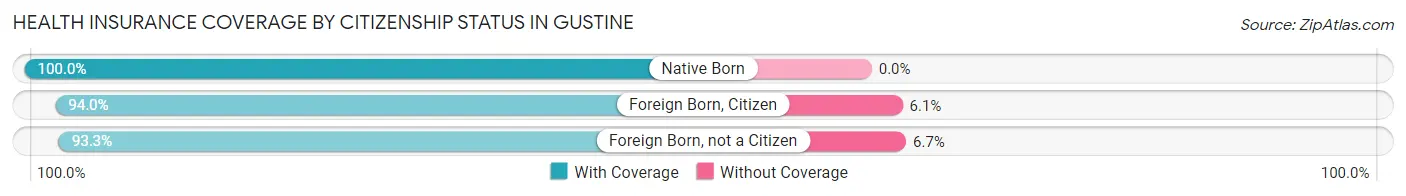
| Citizenship Status | With Coverage | Without Coverage |
| Native Born | 289 (100.0%) | 0 (0.0%) |
| Foreign Born, Citizen | 1,180 (94.0%) | 76 (6.0%) |
| Foreign Born, not a Citizen | 498 (93.3%) | 36 (6.7%) |
Health Insurance Coverage by Household Income in Gustine
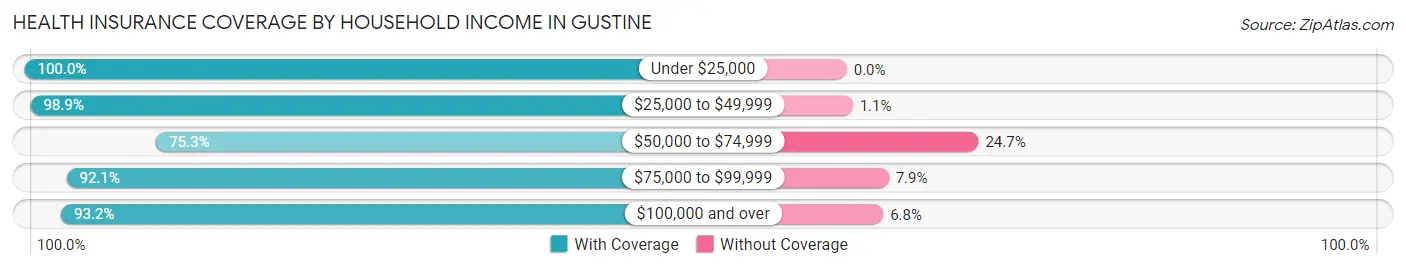
| Household Income | With Coverage | Without Coverage |
| Under $25,000 | 566 (100.0%) | 0 (0.0%) |
| $25,000 to $49,999 | 2,050 (98.9%) | 23 (1.1%) |
| $50,000 to $74,999 | 519 (75.3%) | 170 (24.7%) |
| $75,000 to $99,999 | 1,900 (92.1%) | 162 (7.9%) |
| $100,000 and over | 682 (93.2%) | 50 (6.8%) |
Public vs Private Health Insurance Coverage by Age in Gustine
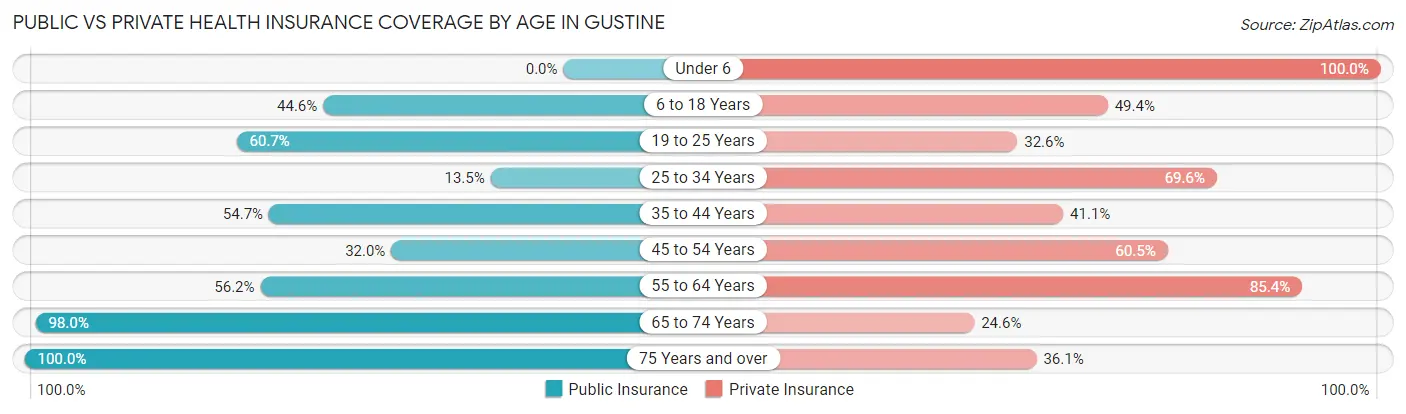
| Age Bracket | Public Insurance | Private Insurance |
| Under 6 | 0 (0.0%) | 289 (100.0%) |
| 6 to 18 Years | 560 (44.6%) | 620 (49.4%) |
| 19 to 25 Years | 324 (60.7%) | 174 (32.6%) |
| 25 to 34 Years | 60 (13.5%) | 309 (69.6%) |
| 35 to 44 Years | 552 (54.6%) | 415 (41.1%) |
| 45 to 54 Years | 401 (32.0%) | 759 (60.5%) |
| 55 to 64 Years | 239 (56.2%) | 363 (85.4%) |
| 65 to 74 Years | 530 (98.0%) | 133 (24.6%) |
| 75 Years and over | 368 (100.0%) | 133 (36.1%) |
| Total | 3,034 (49.6%) | 3,195 (52.2%) |
Disability Status by Sex by Age in Gustine
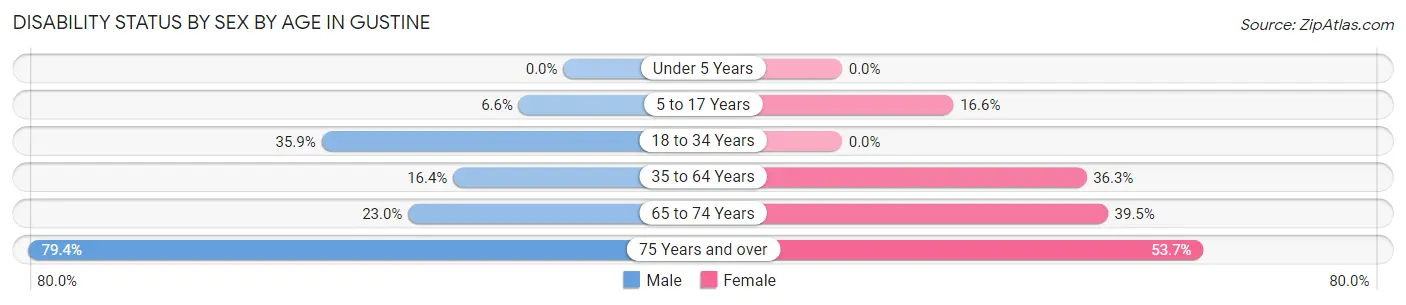
| Age Bracket | Male | Female |
| Under 5 Years | 0 (0.0%) | 0 (0.0%) |
| 5 to 17 Years | 49 (6.6%) | 93 (16.6%) |
| 18 to 34 Years | 228 (35.9%) | 0 (0.0%) |
| 35 to 64 Years | 211 (16.4%) | 508 (36.3%) |
| 65 to 74 Years | 47 (23.0%) | 133 (39.5%) |
| 75 Years and over | 131 (79.4%) | 109 (53.7%) |
Disability Class by Sex by Age in Gustine
Disability Class: Hearing Difficulty
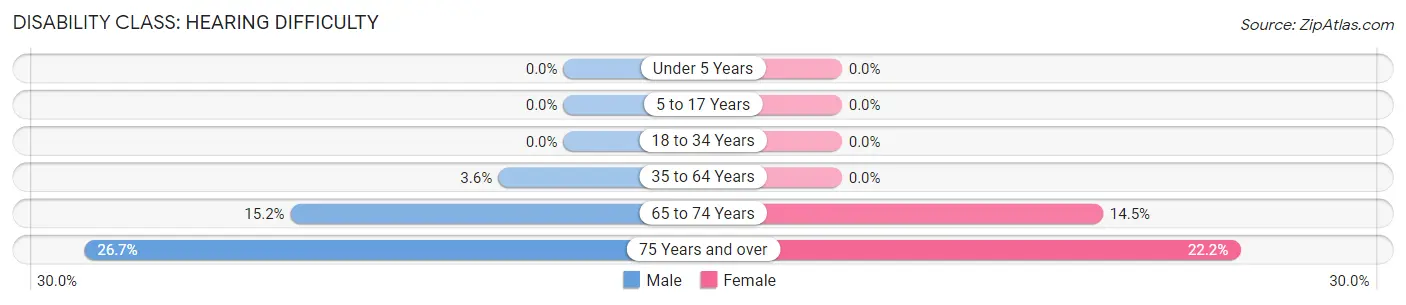
| Age Bracket | Male | Female |
| Under 5 Years | 0 (0.0%) | 0 (0.0%) |
| 5 to 17 Years | 0 (0.0%) | 0 (0.0%) |
| 18 to 34 Years | 0 (0.0%) | 0 (0.0%) |
| 35 to 64 Years | 47 (3.6%) | 0 (0.0%) |
| 65 to 74 Years | 31 (15.2%) | 49 (14.5%) |
| 75 Years and over | 44 (26.7%) | 45 (22.2%) |
Disability Class: Vision Difficulty
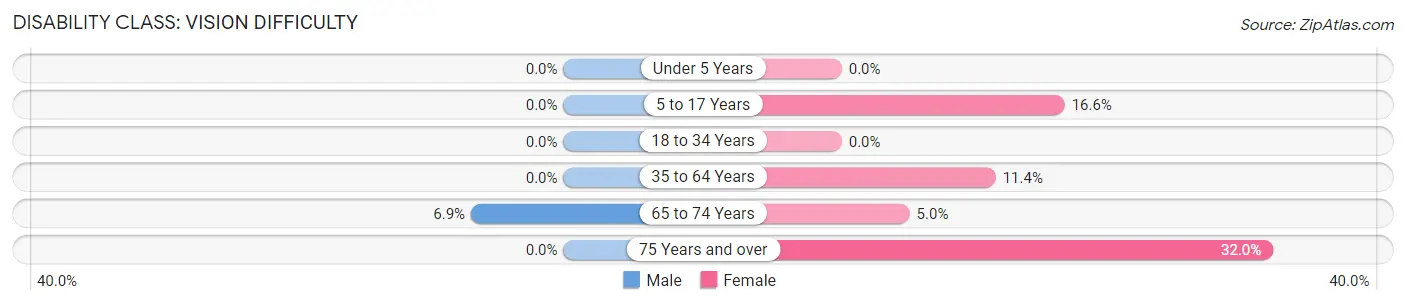
| Age Bracket | Male | Female |
| Under 5 Years | 0 (0.0%) | 0 (0.0%) |
| 5 to 17 Years | 0 (0.0%) | 93 (16.6%) |
| 18 to 34 Years | 0 (0.0%) | 0 (0.0%) |
| 35 to 64 Years | 0 (0.0%) | 160 (11.4%) |
| 65 to 74 Years | 14 (6.9%) | 17 (5.0%) |
| 75 Years and over | 0 (0.0%) | 65 (32.0%) |
Disability Class: Cognitive Difficulty
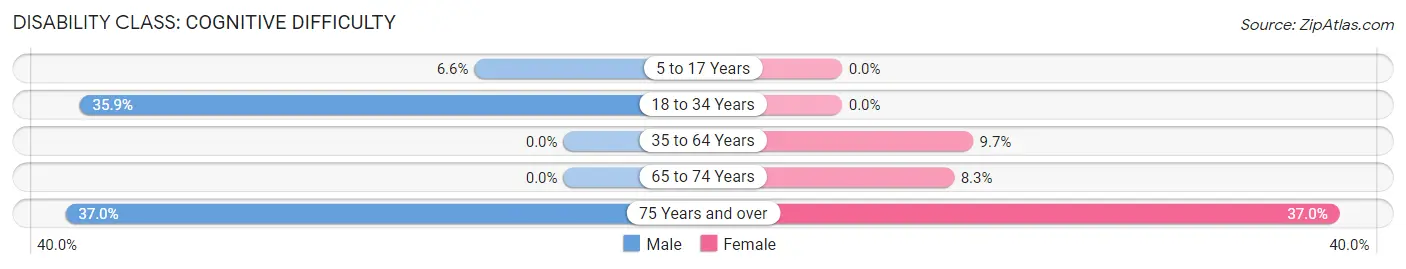
| Age Bracket | Male | Female |
| 5 to 17 Years | 49 (6.6%) | 0 (0.0%) |
| 18 to 34 Years | 228 (35.9%) | 0 (0.0%) |
| 35 to 64 Years | 0 (0.0%) | 136 (9.7%) |
| 65 to 74 Years | 0 (0.0%) | 28 (8.3%) |
| 75 Years and over | 61 (37.0%) | 75 (36.9%) |
Disability Class: Ambulatory Difficulty
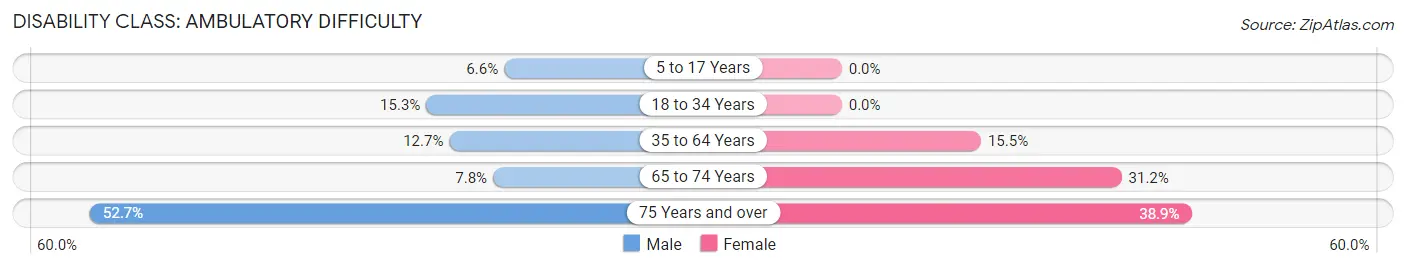
| Age Bracket | Male | Female |
| 5 to 17 Years | 49 (6.6%) | 0 (0.0%) |
| 18 to 34 Years | 97 (15.3%) | 0 (0.0%) |
| 35 to 64 Years | 164 (12.7%) | 217 (15.5%) |
| 65 to 74 Years | 16 (7.8%) | 105 (31.2%) |
| 75 Years and over | 87 (52.7%) | 79 (38.9%) |
Disability Class: Self-Care Difficulty
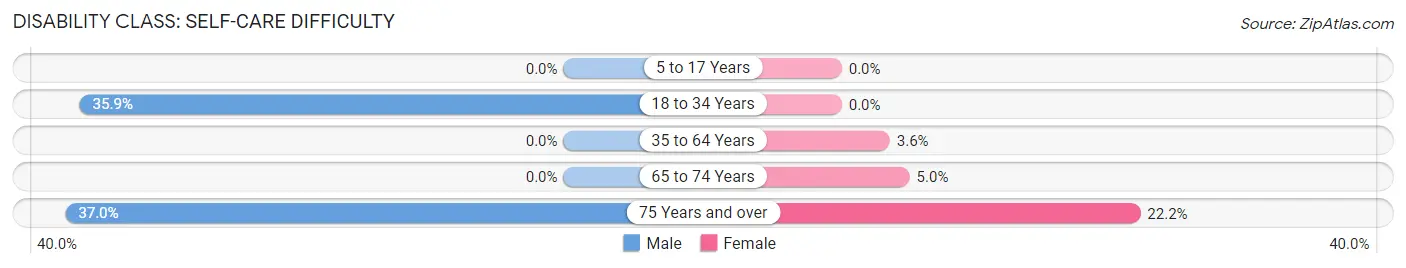
| Age Bracket | Male | Female |
| 5 to 17 Years | 0 (0.0%) | 0 (0.0%) |
| 18 to 34 Years | 228 (35.9%) | 0 (0.0%) |
| 35 to 64 Years | 0 (0.0%) | 50 (3.6%) |
| 65 to 74 Years | 0 (0.0%) | 17 (5.0%) |
| 75 Years and over | 61 (37.0%) | 45 (22.2%) |
Technology Access in Gustine
Computing Device Access in Gustine
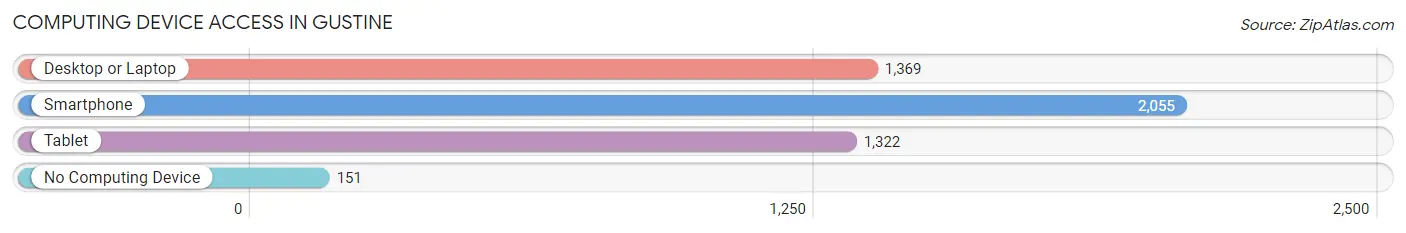
| Device Type | # Households | % Households |
| Desktop or Laptop | 1,369 | 59.3% |
| Smartphone | 2,055 | 89.1% |
| Tablet | 1,322 | 57.3% |
| No Computing Device | 151 | 6.6% |
| Total | 2,307 | 100.0% |
Internet Access in Gustine
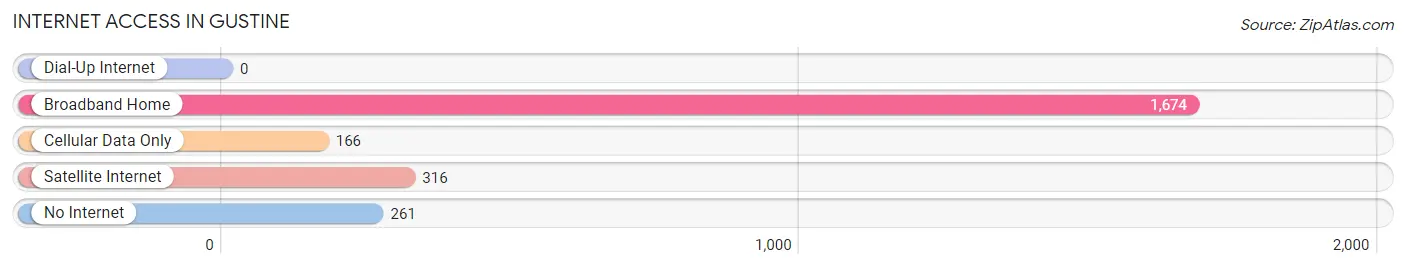
| Internet Type | # Households | % Households |
| Dial-Up Internet | 0 | 0.0% |
| Broadband Home | 1,674 | 72.6% |
| Cellular Data Only | 166 | 7.2% |
| Satellite Internet | 316 | 13.7% |
| No Internet | 261 | 11.3% |
| Total | 2,307 | 100.0% |
Gustine Summary
Gustine is a small city located in Merced County, California, United States. It is situated in the San Joaquin Valley, approximately 30 miles west of Merced and 70 miles southeast of San Francisco. The city has a population of approximately 5,000 people and covers an area of 1.7 square miles.
History
Gustine was founded in 1891 by John B. Gustine, a rancher and businessman from Missouri. He purchased land in the area and established a post office, which he named after himself. The town grew slowly, but steadily, and by the early 1900s, it had become a thriving agricultural community. The town was incorporated in 1921 and has remained relatively unchanged since then.
Geography
Gustine is located in the San Joaquin Valley, approximately 30 miles west of Merced and 70 miles southeast of San Francisco. The city is situated at an elevation of approximately 200 feet above sea level and is surrounded by rolling hills and farmland. The climate is generally mild, with hot summers and cool winters.
Economy
Gustine’s economy is largely based on agriculture. The city is home to a number of farms and ranches, which produce a variety of crops, including almonds, walnuts, tomatoes, and grapes. The city is also home to a number of small businesses, including restaurants, retail stores, and service providers.
Demographics
As of the 2010 census, Gustine had a population of 5,520 people. The racial makeup of the city was 57.3% White, 0.7% African American, 1.2% Native American, 0.7% Asian, 0.1% Pacific Islander, 37.2% from other races, and 3.0% from two or more races. Hispanic or Latino of any race were 64.2% of the population.
The median household income in Gustine was $41,944, and the median family income was $48,958. The per capita income for the city was $17,845. About 17.2% of families and 20.7% of the population were below the poverty line, including 28.3% of those under age 18 and 11.2% of those age 65 or over.
Gustine is a small city with a rich history and a diverse population. The city’s economy is largely based on agriculture, and the city is home to a number of small businesses. The city has a population of approximately 5,000 people and is situated in the San Joaquin Valley, approximately 30 miles west of Merced and 70 miles southeast of San Francisco.
Common Questions
What is Per Capita Income in Gustine?
Per Capita income in Gustine is $23,942.
What is the Median Family Income in Gustine?
Median Family Income in Gustine is $47,104.
What is the Median Household income in Gustine?
Median Household Income in Gustine is $51,636.
What is Income or Wage Gap in Gustine?
Income or Wage Gap in Gustine is 40.7%.
Women in Gustine earn 59.3 cents for every dollar earned by a man.
What is Inequality or Gini Index in Gustine?
Inequality or Gini Index in Gustine is 0.37.
What is the Total Population of Gustine?
Total Population of Gustine is 6,122.
What is the Total Male Population of Gustine?
Total Male Population of Gustine is 3,208.
What is the Total Female Population of Gustine?
Total Female Population of Gustine is 2,914.
What is the Ratio of Males per 100 Females in Gustine?
There are 110.09 Males per 100 Females in Gustine.
What is the Ratio of Females per 100 Males in Gustine?
There are 90.84 Females per 100 Males in Gustine.
What is the Median Population Age in Gustine?
Median Population Age in Gustine is 40.7 Years.
What is the Average Family Size in Gustine
Average Family Size in Gustine is 3.1 People.
What is the Average Household Size in Gustine
Average Household Size in Gustine is 2.6 People.
How Large is the Labor Force in Gustine?
There are 2,513 People in the Labor Forcein in Gustine.
What is the Percentage of People in the Labor Force in Gustine?
52.0% of People are in the Labor Force in Gustine.
What is the Unemployment Rate in Gustine?
Unemployment Rate in Gustine is 14.3%.