Cities with the Highest Percentage of Population Employed in Real Estate, Rental & Leasing in New Jersey
RELATED REPORTS & OPTIONS
Real Estate, Rental & Leasing
New Jersey
Compare Cities
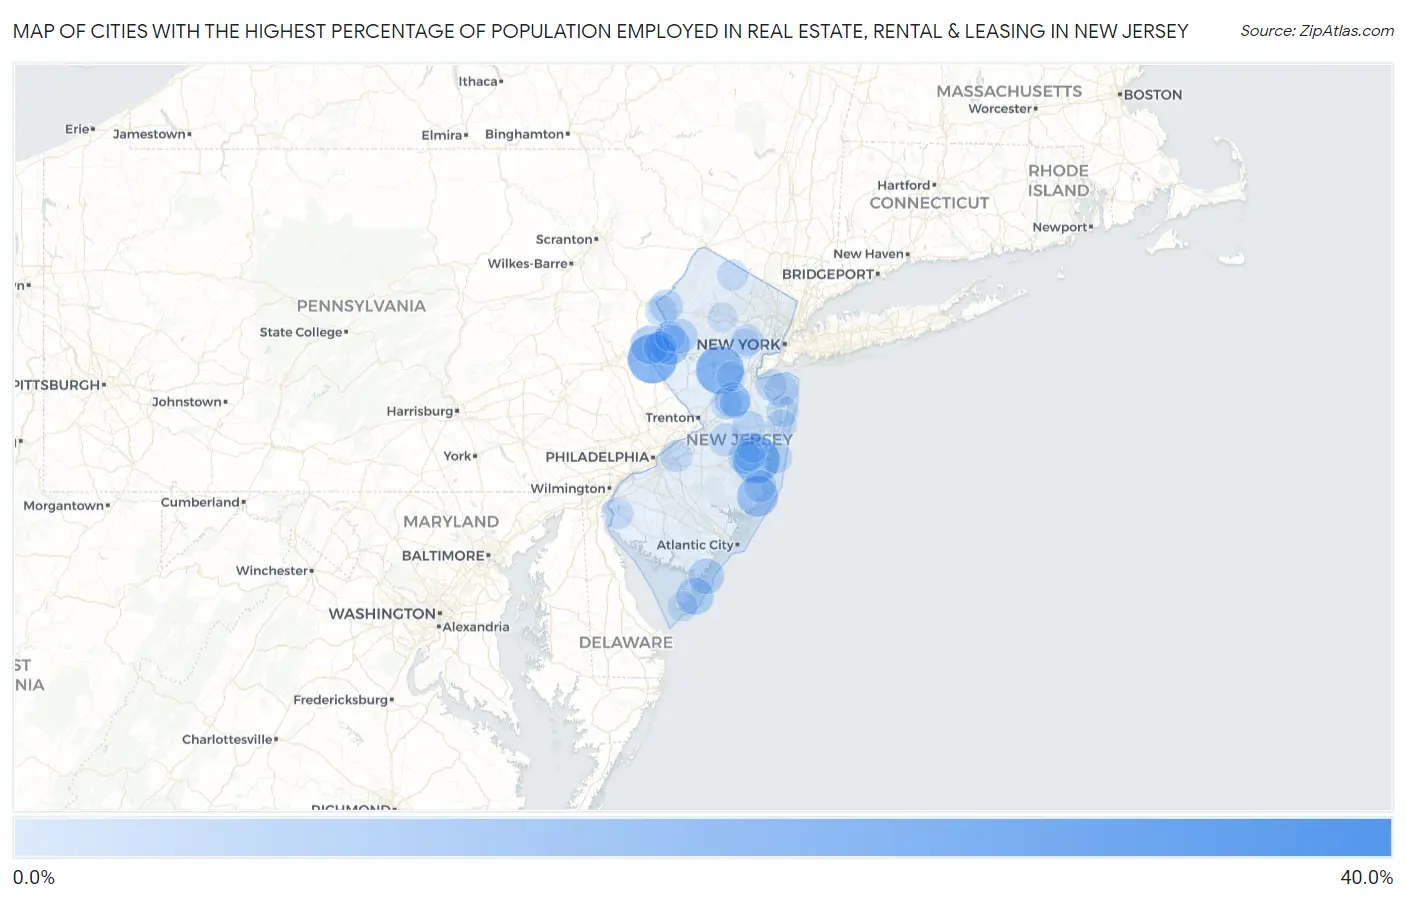
Map of Cities with the Highest Percentage of Population Employed in Real Estate, Rental & Leasing in New Jersey
0.0%
40.0%
Cities with the Highest Percentage of Population Employed in Real Estate, Rental & Leasing in New Jersey
| City | % Employed | vs State | vs National | |
| 1. | Othello | 31.1% | 1.9%(+29.2)#1 | 1.9%(+29.2)#64 |
| 2. | Dorchester | 25.7% | 1.9%(+23.8)#2 | 1.9%(+23.8)#102 |
| 3. | Pottersville | 24.0% | 1.9%(+22.2)#3 | 1.9%(+22.2)#109 |
| 4. | Finesville | 19.4% | 1.9%(+17.5)#4 | 1.9%(+17.5)#156 |
| 5. | Zarephath | 18.2% | 1.9%(+16.3)#5 | 1.9%(+16.3)#179 |
| 6. | Holiday Heights | 17.3% | 1.9%(+15.4)#6 | 1.9%(+15.4)#190 |
| 7. | West Cape May Borough | 15.6% | 1.9%(+13.7)#7 | 1.9%(+13.7)#231 |
| 8. | Harvey Cedars Borough | 13.2% | 1.9%(+11.3)#8 | 1.9%(+11.3)#306 |
| 9. | Glen Ridge Borough | 12.9% | 1.9%(+11.0)#9 | 1.9%(+11.0)#326 |
| 10. | Manahawkin | 12.7% | 1.9%(+10.8)#10 | 1.9%(+10.8)#331 |
| 11. | Asbury | 11.6% | 1.9%(+9.69)#11 | 1.9%(+9.69)#406 |
| 12. | Dorothy | 11.0% | 1.9%(+9.08)#12 | 1.9%(+9.07)#447 |
| 13. | Washington Crossing | 10.9% | 1.9%(+9.02)#13 | 1.9%(+9.02)#453 |
| 14. | Delaware Park | 10.7% | 1.9%(+8.85)#14 | 1.9%(+8.85)#469 |
| 15. | Deal Borough | 9.6% | 1.9%(+7.67)#15 | 1.9%(+7.67)#581 |
| 16. | North Wildwood | 9.5% | 1.9%(+7.58)#16 | 1.9%(+7.58)#593 |
| 17. | Newfield Borough | 9.3% | 1.9%(+7.40)#17 | 1.9%(+7.40)#611 |
| 18. | Cranford | 8.8% | 1.9%(+6.96)#18 | 1.9%(+6.95)#669 |
| 19. | Avalon Borough | 8.7% | 1.9%(+6.81)#19 | 1.9%(+6.80)#690 |
| 20. | Saddle River Borough | 8.6% | 1.9%(+6.70)#20 | 1.9%(+6.70)#709 |
| 21. | Surf City Borough | 8.6% | 1.9%(+6.68)#21 | 1.9%(+6.68)#711 |
| 22. | Sea Isle City | 8.4% | 1.9%(+6.54)#22 | 1.9%(+6.54)#739 |
| 23. | Rossmoor | 8.3% | 1.9%(+6.40)#23 | 1.9%(+6.40)#761 |
| 24. | Roosevelt Borough | 8.1% | 1.9%(+6.17)#24 | 1.9%(+6.17)#815 |
| 25. | Stirling | 8.0% | 1.9%(+6.16)#25 | 1.9%(+6.16)#817 |
| 26. | Beach Haven Borough | 7.9% | 1.9%(+5.96)#26 | 1.9%(+5.96)#851 |
| 27. | Sunset Lake | 7.7% | 1.9%(+5.85)#27 | 1.9%(+5.85)#871 |
| 28. | Sewell | 7.6% | 1.9%(+5.69)#28 | 1.9%(+5.69)#906 |
| 29. | Anderson | 7.6% | 1.9%(+5.68)#29 | 1.9%(+5.68)#910 |
| 30. | Absecon Highlands | 7.5% | 1.9%(+5.64)#30 | 1.9%(+5.64)#925 |
| 31. | Ampere North | 7.3% | 1.9%(+5.40)#31 | 1.9%(+5.40)#970 |
| 32. | Lavallette Borough | 7.1% | 1.9%(+5.23)#32 | 1.9%(+5.23)#1,017 |
| 33. | Belmar Borough | 7.0% | 1.9%(+5.08)#33 | 1.9%(+5.08)#1,053 |
| 34. | Vista Center | 6.7% | 1.9%(+4.84)#34 | 1.9%(+4.84)#1,109 |
| 35. | Stone Harbor Borough | 6.6% | 1.9%(+4.72)#35 | 1.9%(+4.72)#1,150 |
| 36. | Navesink | 6.6% | 1.9%(+4.67)#36 | 1.9%(+4.67)#1,164 |
| 37. | Alpine Borough | 6.6% | 1.9%(+4.66)#37 | 1.9%(+4.66)#1,172 |
| 38. | Crestwood Village | 6.5% | 1.9%(+4.59)#38 | 1.9%(+4.59)#1,196 |
| 39. | Hainesburg | 6.3% | 1.9%(+4.43)#39 | 1.9%(+4.42)#1,247 |
| 40. | New Egypt | 6.1% | 1.9%(+4.23)#40 | 1.9%(+4.23)#1,326 |
| 41. | Barnegat | 6.0% | 1.9%(+4.15)#41 | 1.9%(+4.15)#1,357 |
| 42. | Stewartsville | 6.0% | 1.9%(+4.14)#42 | 1.9%(+4.14)#1,360 |
| 43. | New Vernon | 6.0% | 1.9%(+4.13)#43 | 1.9%(+4.12)#1,368 |
| 44. | Emerson Borough | 5.6% | 1.9%(+3.76)#44 | 1.9%(+3.75)#1,522 |
| 45. | Columbia | 5.6% | 1.9%(+3.73)#45 | 1.9%(+3.73)#1,539 |
| 46. | Peapack And Gladstone Borough | 5.6% | 1.9%(+3.71)#46 | 1.9%(+3.70)#1,544 |
| 47. | Jamesburg Borough | 5.6% | 1.9%(+3.70)#47 | 1.9%(+3.70)#1,549 |
| 48. | Palermo | 5.6% | 1.9%(+3.69)#48 | 1.9%(+3.69)#1,553 |
| 49. | Dover Beaches South | 5.5% | 1.9%(+3.60)#49 | 1.9%(+3.60)#1,598 |
| 50. | Moorestown Lenola | 5.5% | 1.9%(+3.56)#50 | 1.9%(+3.56)#1,612 |
| 51. | Gillette | 5.3% | 1.9%(+3.46)#51 | 1.9%(+3.46)#1,669 |
| 52. | Bedminster | 5.3% | 1.9%(+3.40)#52 | 1.9%(+3.40)#1,698 |
| 53. | Oakhurst | 5.2% | 1.9%(+3.29)#53 | 1.9%(+3.29)#1,758 |
| 54. | Cranbury | 5.2% | 1.9%(+3.29)#54 | 1.9%(+3.29)#1,759 |
| 55. | Salem | 5.1% | 1.9%(+3.20)#55 | 1.9%(+3.20)#1,806 |
| 56. | Far Hills Borough | 5.1% | 1.9%(+3.19)#56 | 1.9%(+3.19)#1,811 |
| 57. | Rocky Hill Borough | 5.0% | 1.9%(+3.11)#57 | 1.9%(+3.11)#1,856 |
| 58. | Mountain Lakes Borough | 5.0% | 1.9%(+3.08)#58 | 1.9%(+3.08)#1,880 |
| 59. | Spring Lake Heights Borough | 4.9% | 1.9%(+3.05)#59 | 1.9%(+3.05)#1,896 |
| 60. | Mendham Borough | 4.9% | 1.9%(+3.03)#60 | 1.9%(+3.03)#1,910 |
| 61. | North Middletown | 4.9% | 1.9%(+2.98)#61 | 1.9%(+2.98)#1,943 |
| 62. | Brookside | 4.8% | 1.9%(+2.96)#62 | 1.9%(+2.95)#1,964 |
| 63. | Short Hills | 4.8% | 1.9%(+2.95)#63 | 1.9%(+2.95)#1,968 |
| 64. | Whittingham | 4.8% | 1.9%(+2.94)#64 | 1.9%(+2.93)#1,978 |
| 65. | Highland Lakes | 4.8% | 1.9%(+2.92)#65 | 1.9%(+2.92)#1,989 |
| 66. | Rumson Borough | 4.8% | 1.9%(+2.89)#66 | 1.9%(+2.88)#2,004 |
| 67. | West Belmar | 4.8% | 1.9%(+2.86)#67 | 1.9%(+2.86)#2,021 |
| 68. | Cresskill Borough | 4.8% | 1.9%(+2.86)#68 | 1.9%(+2.86)#2,022 |
| 69. | Avon By The Sea Borough | 4.7% | 1.9%(+2.76)#69 | 1.9%(+2.76)#2,094 |
| 70. | Leisure Knoll | 4.6% | 1.9%(+2.70)#70 | 1.9%(+2.70)#2,139 |
| 71. | Sea Girt Borough | 4.5% | 1.9%(+2.66)#71 | 1.9%(+2.65)#2,172 |
| 72. | Oceanport Borough | 4.5% | 1.9%(+2.60)#72 | 1.9%(+2.60)#2,216 |
| 73. | Stonebridge | 4.5% | 1.9%(+2.58)#73 | 1.9%(+2.58)#2,231 |
| 74. | Franklin Lakes Borough | 4.5% | 1.9%(+2.58)#74 | 1.9%(+2.58)#2,238 |
| 75. | North Haledon Borough | 4.4% | 1.9%(+2.55)#75 | 1.9%(+2.55)#2,257 |
| 76. | Little Silver Borough | 4.3% | 1.9%(+2.45)#76 | 1.9%(+2.44)#2,342 |
| 77. | Milmay | 4.3% | 1.9%(+2.43)#77 | 1.9%(+2.43)#2,350 |
| 78. | Pine Ridge At Crestwood | 4.3% | 1.9%(+2.38)#78 | 1.9%(+2.38)#2,380 |
| 79. | Hasbrouck Heights Borough | 4.2% | 1.9%(+2.35)#79 | 1.9%(+2.34)#2,417 |
| 80. | Monmouth Beach Borough | 4.2% | 1.9%(+2.34)#80 | 1.9%(+2.33)#2,423 |
| 81. | Summit | 4.2% | 1.9%(+2.30)#81 | 1.9%(+2.30)#2,450 |
| 82. | Brass Castle | 4.2% | 1.9%(+2.30)#82 | 1.9%(+2.30)#2,456 |
| 83. | Mount Tabor | 4.2% | 1.9%(+2.28)#83 | 1.9%(+2.28)#2,468 |
| 84. | Cape May | 4.2% | 1.9%(+2.28)#84 | 1.9%(+2.28)#2,472 |
| 85. | Grenloch | 4.1% | 1.9%(+2.24)#85 | 1.9%(+2.24)#2,511 |
| 86. | Oakland Borough | 4.1% | 1.9%(+2.22)#86 | 1.9%(+2.22)#2,541 |
| 87. | Ridgefield Borough | 4.1% | 1.9%(+2.19)#87 | 1.9%(+2.19)#2,569 |
| 88. | Mantoloking Borough | 4.1% | 1.9%(+2.17)#88 | 1.9%(+2.17)#2,594 |
| 89. | Lincoln Park Borough | 4.0% | 1.9%(+2.10)#89 | 1.9%(+2.10)#2,670 |
| 90. | River Edge Borough | 4.0% | 1.9%(+2.10)#90 | 1.9%(+2.10)#2,674 |
| 91. | Neptune City Borough | 4.0% | 1.9%(+2.08)#91 | 1.9%(+2.08)#2,691 |
| 92. | Newtonville | 4.0% | 1.9%(+2.08)#92 | 1.9%(+2.08)#2,699 |
| 93. | Dover | 4.0% | 1.9%(+2.06)#93 | 1.9%(+2.06)#2,716 |
| 94. | Concordia | 3.9% | 1.9%(+2.02)#94 | 1.9%(+2.02)#2,749 |
| 95. | Springfield | 3.9% | 1.9%(+2.02)#95 | 1.9%(+2.02)#2,752 |
| 96. | Manasquan Borough | 3.9% | 1.9%(+2.02)#96 | 1.9%(+2.02)#2,759 |
| 97. | Haworth Borough | 3.9% | 1.9%(+2.01)#97 | 1.9%(+2.01)#2,765 |
| 98. | East Franklin | 3.9% | 1.9%(+2.00)#98 | 1.9%(+2.00)#2,784 |
| 99. | Bogota Borough | 3.9% | 1.9%(+1.98)#99 | 1.9%(+1.98)#2,807 |
| 100. | Atco | 3.8% | 1.9%(+1.87)#100 | 1.9%(+1.87)#2,934 |
Common Questions
What are the Top 10 Cities with the Highest Percentage of Population Employed in Real Estate, Rental & Leasing in New Jersey?
Top 10 Cities with the Highest Percentage of Population Employed in Real Estate, Rental & Leasing in New Jersey are:
#1
19.4%
#2
18.2%
#3
17.3%
#4
12.7%
#5
11.6%
#6
10.7%
#7
9.5%
#8
8.4%
#9
8.3%
#10
7.6%
What city has the Highest Percentage of Population Employed in Real Estate, Rental & Leasing in New Jersey?
Finesville has the Highest Percentage of Population Employed in Real Estate, Rental & Leasing in New Jersey with 19.4%.
What is the Percentage of Population Employed in Real Estate, Rental & Leasing in the State of New Jersey?
Percentage of Population Employed in Real Estate, Rental & Leasing in New Jersey is 1.9%.
What is the Percentage of Population Employed in Real Estate, Rental & Leasing in the United States?
Percentage of Population Employed in Real Estate, Rental & Leasing in the United States is 1.9%.