Green Valley CDP Solano County, CA Map & Demographics
Green Valley CDP Solano County Overview
$73,532
PER CAPITA INCOME
$164,125
AVG FAMILY INCOME
$135,729
AVG HOUSEHOLD INCOME
0.47
INEQUALITY / GINI INDEX
1,586
TOTAL POPULATION
707
MALE POPULATION
879
FEMALE POPULATION
80.43
MALES / 100 FEMALES
124.33
FEMALES / 100 MALES
58.8
MEDIAN AGE
2.9
AVG FAMILY SIZE
2.7
AVG HOUSEHOLD SIZE
758
LABOR FORCE [ PEOPLE ]
54.3%
PERCENT IN LABOR FORCE
Income in Green Valley CDP Solano County
Income Overview in Green Valley CDP Solano County
Per Capita Income in Green Valley CDP Solano County is $73,532, while median incomes of families and households are $164,125 and $135,729 respectively.
| Characteristic | Number | Measure |
| Per Capita Income | 1,586 | $73,532 |
| Median Family Income | 458 | $164,125 |
| Mean Family Income | 458 | $227,110 |
| Median Household Income | 587 | $135,729 |
| Mean Household Income | 587 | $196,176 |
| Income Deficit | 458 | $0 |
| Wage / Income Gap (%) | 1,586 | 0.00% |
| Wage / Income Gap ($) | 1,586 | 100.00¢ per $1 |
| Gini / Inequality Index | 1,586 | 0.47 |
Earnings by Sex in Green Valley CDP Solano County
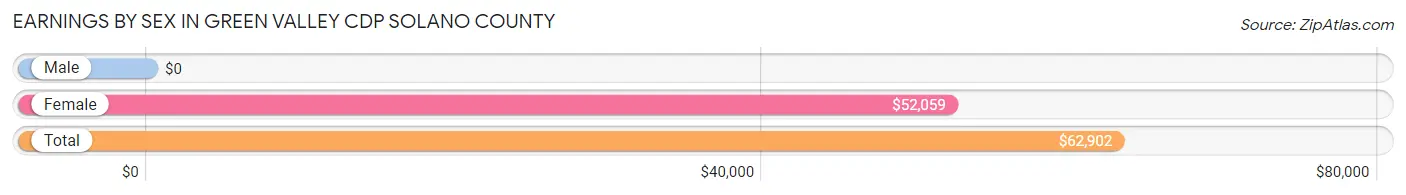
| Sex | Number | Average Earnings |
| Male | 387 (46.7%) | $0 |
| Female | 442 (53.3%) | $52,059 |
| Total | 829 (100.0%) | $62,902 |
Earnings by Sex by Income Bracket in Green Valley CDP Solano County
The most common earnings brackets in Green Valley CDP Solano County are $100,000+ for men (193 | 49.9%) and $100,000+ for women (93 | 21.0%).
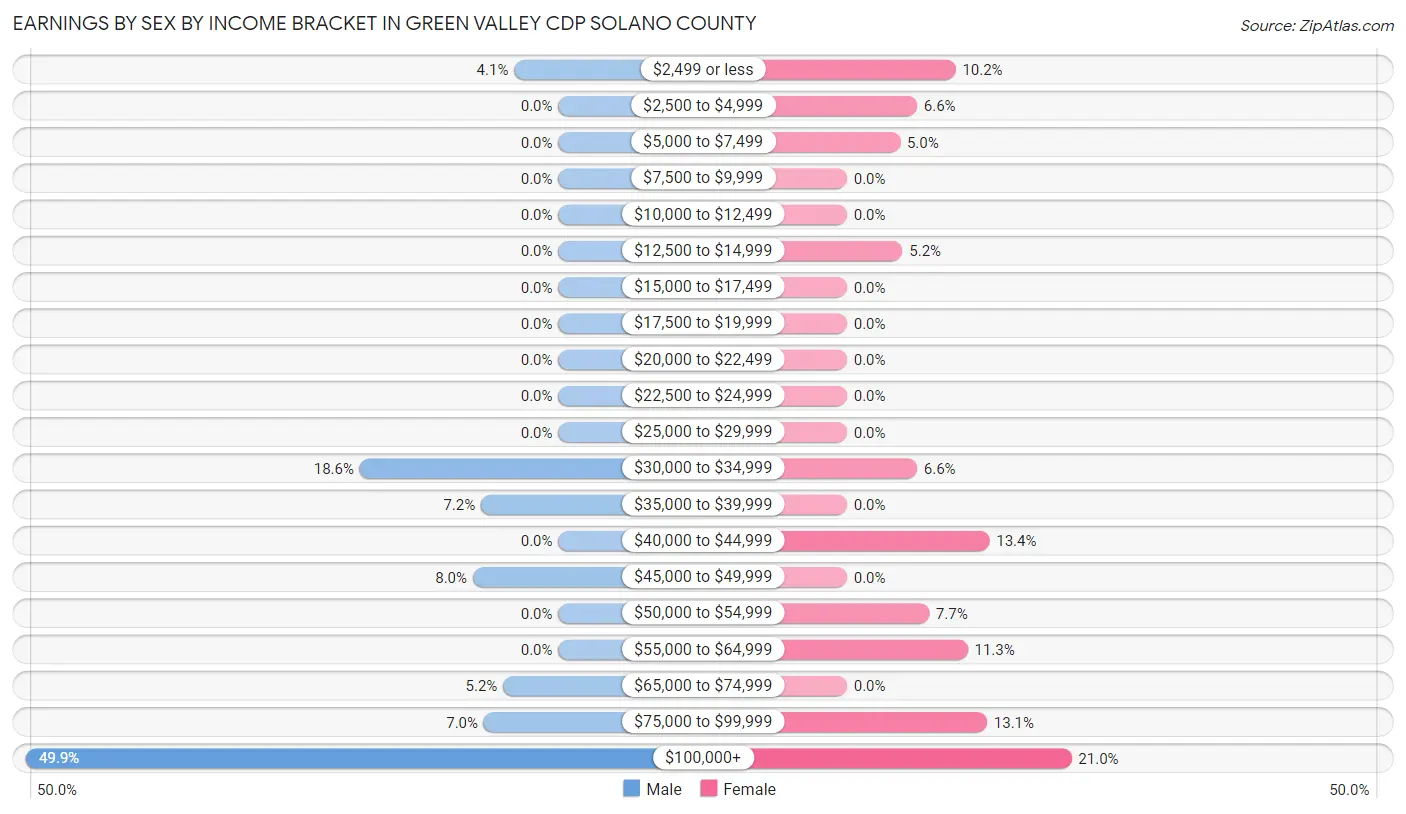
| Income | Male | Female |
| $2,499 or less | 16 (4.1%) | 45 (10.2%) |
| $2,500 to $4,999 | 0 (0.0%) | 29 (6.6%) |
| $5,000 to $7,499 | 0 (0.0%) | 22 (5.0%) |
| $7,500 to $9,999 | 0 (0.0%) | 0 (0.0%) |
| $10,000 to $12,499 | 0 (0.0%) | 0 (0.0%) |
| $12,500 to $14,999 | 0 (0.0%) | 23 (5.2%) |
| $15,000 to $17,499 | 0 (0.0%) | 0 (0.0%) |
| $17,500 to $19,999 | 0 (0.0%) | 0 (0.0%) |
| $20,000 to $22,499 | 0 (0.0%) | 0 (0.0%) |
| $22,500 to $24,999 | 0 (0.0%) | 0 (0.0%) |
| $25,000 to $29,999 | 0 (0.0%) | 0 (0.0%) |
| $30,000 to $34,999 | 72 (18.6%) | 29 (6.6%) |
| $35,000 to $39,999 | 28 (7.2%) | 0 (0.0%) |
| $40,000 to $44,999 | 0 (0.0%) | 59 (13.4%) |
| $45,000 to $49,999 | 31 (8.0%) | 0 (0.0%) |
| $50,000 to $54,999 | 0 (0.0%) | 34 (7.7%) |
| $55,000 to $64,999 | 0 (0.0%) | 50 (11.3%) |
| $65,000 to $74,999 | 20 (5.2%) | 0 (0.0%) |
| $75,000 to $99,999 | 27 (7.0%) | 58 (13.1%) |
| $100,000+ | 193 (49.9%) | 93 (21.0%) |
| Total | 387 (100.0%) | 442 (100.0%) |
Earnings by Sex by Educational Attainment in Green Valley CDP Solano County
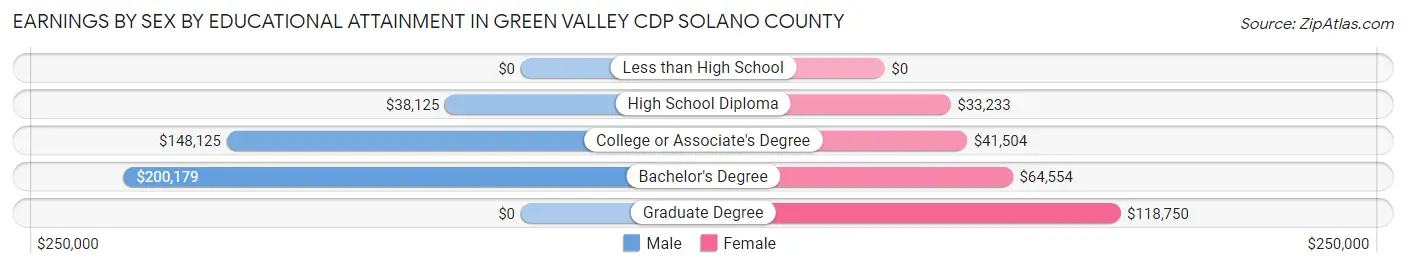
| Educational Attainment | Male Income | Female Income |
| Less than High School | - | - |
| High School Diploma | $38,125 | $33,233 |
| College or Associate's Degree | $148,125 | $41,504 |
| Bachelor's Degree | $200,179 | $64,554 |
| Graduate Degree | - | - |
| Total | - | - |
Family Income in Green Valley CDP Solano County
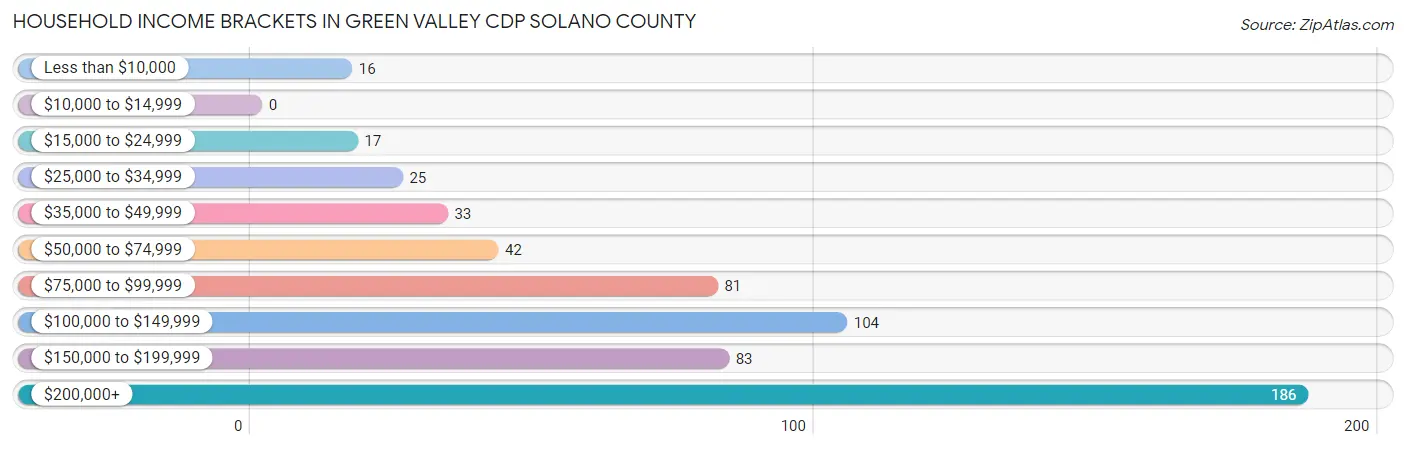
Family Income Brackets in Green Valley CDP Solano County
According to the Green Valley CDP Solano County family income data, there are 186 families falling into the $200,000+ income range, which is the most common income bracket and makes up 40.6% of all families.
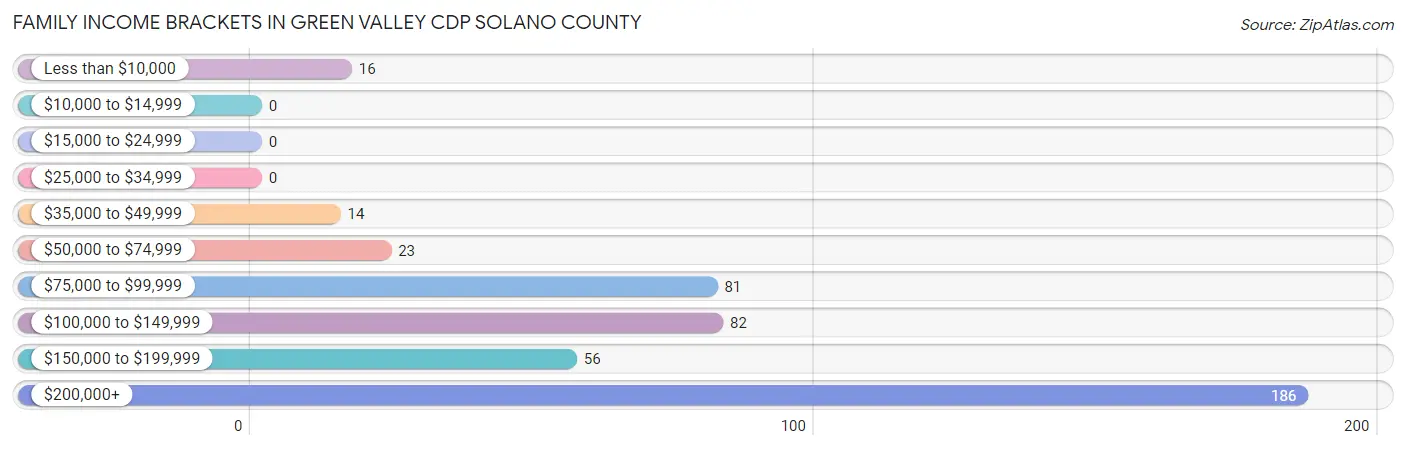
| Income Bracket | # Families | % Families |
| Less than $10,000 | 16 | 3.5% |
| $10,000 to $14,999 | 0 | 0.0% |
| $15,000 to $24,999 | 0 | 0.0% |
| $25,000 to $34,999 | 0 | 0.0% |
| $35,000 to $49,999 | 14 | 3.1% |
| $50,000 to $74,999 | 23 | 5.0% |
| $75,000 to $99,999 | 81 | 17.7% |
| $100,000 to $149,999 | 82 | 17.9% |
| $150,000 to $199,999 | 56 | 12.2% |
| $200,000+ | 186 | 40.6% |
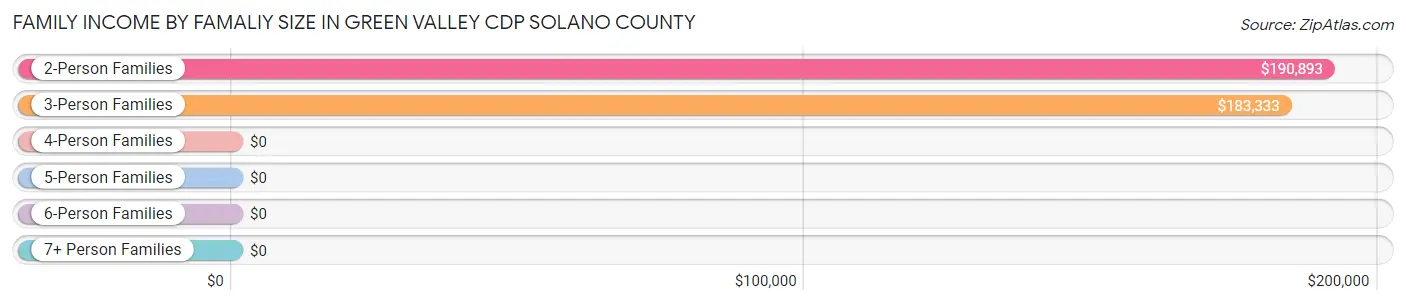
Family Income by Famaliy Size in Green Valley CDP Solano County
2-person families (279 | 60.9%) account for the highest median family income in Green Valley CDP Solano County with $190,893 per family, while 2-person families (279 | 60.9%) have the highest median income of $95,446 per family member.
| Income Bracket | # Families | Median Income |
| 2-Person Families | 279 (60.9%) | $190,893 |
| 3-Person Families | 42 (9.2%) | $183,333 |
| 4-Person Families | 137 (29.9%) | $0 |
| 5-Person Families | 0 (0.0%) | $0 |
| 6-Person Families | 0 (0.0%) | $0 |
| 7+ Person Families | 0 (0.0%) | $0 |
| Total | 458 (100.0%) | $164,125 |
Family Income by Number of Earners in Green Valley CDP Solano County
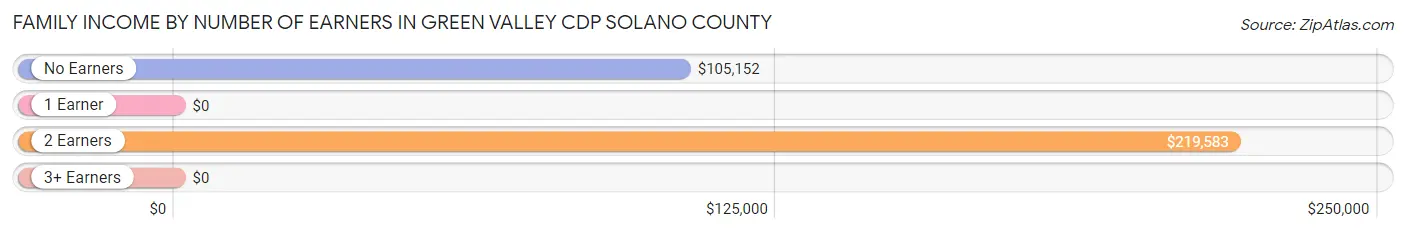
| Number of Earners | # Families | Median Income |
| No Earners | 110 (24.0%) | $105,152 |
| 1 Earner | 53 (11.6%) | $0 |
| 2 Earners | 267 (58.3%) | $219,583 |
| 3+ Earners | 28 (6.1%) | $0 |
| Total | 458 (100.0%) | $164,125 |
Household Income in Green Valley CDP Solano County
Household Income Brackets in Green Valley CDP Solano County
With 186 households falling in the category, the $200,000+ income range is the most frequent in Green Valley CDP Solano County, accounting for 31.7% of all households.
| Income Bracket | # Households | % Households |
| Less than $10,000 | 16 | 2.7% |
| $10,000 to $14,999 | 0 | 0.0% |
| $15,000 to $24,999 | 17 | 2.9% |
| $25,000 to $34,999 | 25 | 4.3% |
| $35,000 to $49,999 | 33 | 5.6% |
| $50,000 to $74,999 | 42 | 7.2% |
| $75,000 to $99,999 | 81 | 13.8% |
| $100,000 to $149,999 | 104 | 17.7% |
| $150,000 to $199,999 | 83 | 14.1% |
| $200,000+ | 186 | 31.7% |
Household Income by Householder Age in Green Valley CDP Solano County
The median household income in Green Valley CDP Solano County is $135,729, with the highest median household income of $233,125 found in the 25 to 44 years age bracket for the primary householder. A total of 39 households (6.6%) fall into this category.
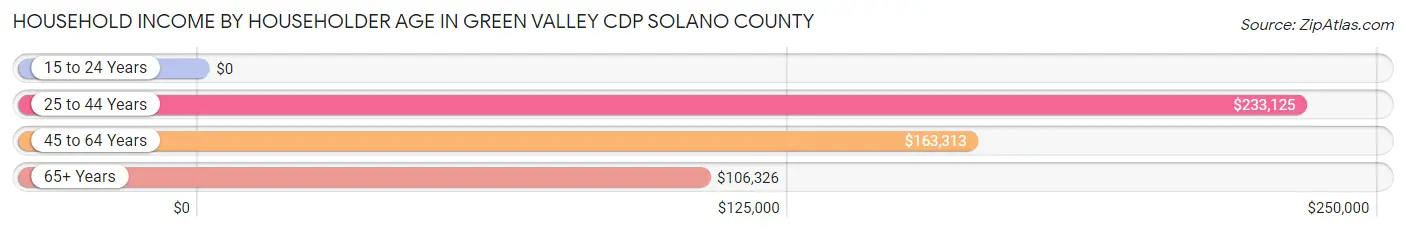
| Income Bracket | # Households | Median Income |
| 15 to 24 Years | 0 (0.0%) | $0 |
| 25 to 44 Years | 39 (6.6%) | $233,125 |
| 45 to 64 Years | 323 (55.0%) | $163,313 |
| 65+ Years | 225 (38.3%) | $106,326 |
| Total | 587 (100.0%) | $135,729 |
Poverty in Green Valley CDP Solano County
Income Below Poverty by Sex and Age in Green Valley CDP Solano County
With 5.1% poverty level for males and 5.1% for females among the residents of Green Valley CDP Solano County, 55 to 64 year old males and 55 to 64 year old females are the most vulnerable to poverty, with 20 males (12.7%) and 29 females (11.1%) in their respective age groups living below the poverty level.
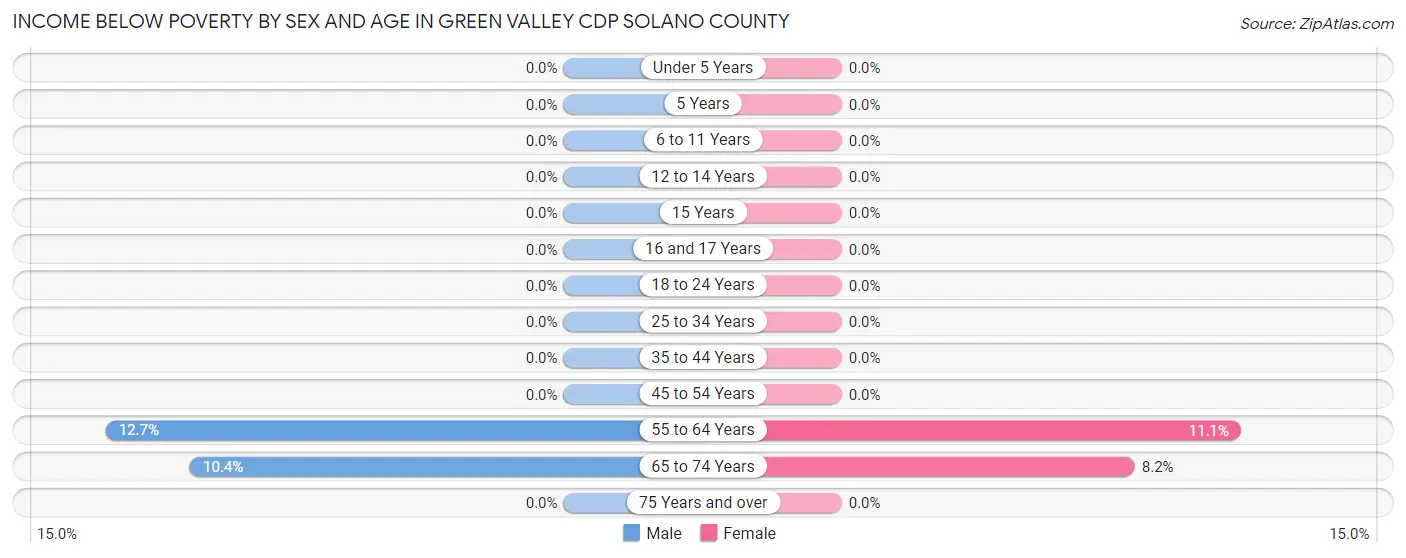
| Age Bracket | Male | Female |
| Under 5 Years | 0 (0.0%) | 0 (0.0%) |
| 5 Years | 0 (0.0%) | 0 (0.0%) |
| 6 to 11 Years | 0 (0.0%) | 0 (0.0%) |
| 12 to 14 Years | 0 (0.0%) | 0 (0.0%) |
| 15 Years | 0 (0.0%) | 0 (0.0%) |
| 16 and 17 Years | 0 (0.0%) | 0 (0.0%) |
| 18 to 24 Years | 0 (0.0%) | 0 (0.0%) |
| 25 to 34 Years | 0 (0.0%) | 0 (0.0%) |
| 35 to 44 Years | 0 (0.0%) | 0 (0.0%) |
| 45 to 54 Years | 0 (0.0%) | 0 (0.0%) |
| 55 to 64 Years | 20 (12.7%) | 29 (11.1%) |
| 65 to 74 Years | 16 (10.4%) | 16 (8.2%) |
| 75 Years and over | 0 (0.0%) | 0 (0.0%) |
| Total | 36 (5.1%) | 45 (5.1%) |
Income Above Poverty by Sex and Age in Green Valley CDP Solano County
According to the poverty statistics in Green Valley CDP Solano County, males aged 5 years and females aged under 5 years are the age groups that are most secure financially, with 100.0% of males and 100.0% of females in these age groups living above the poverty line.
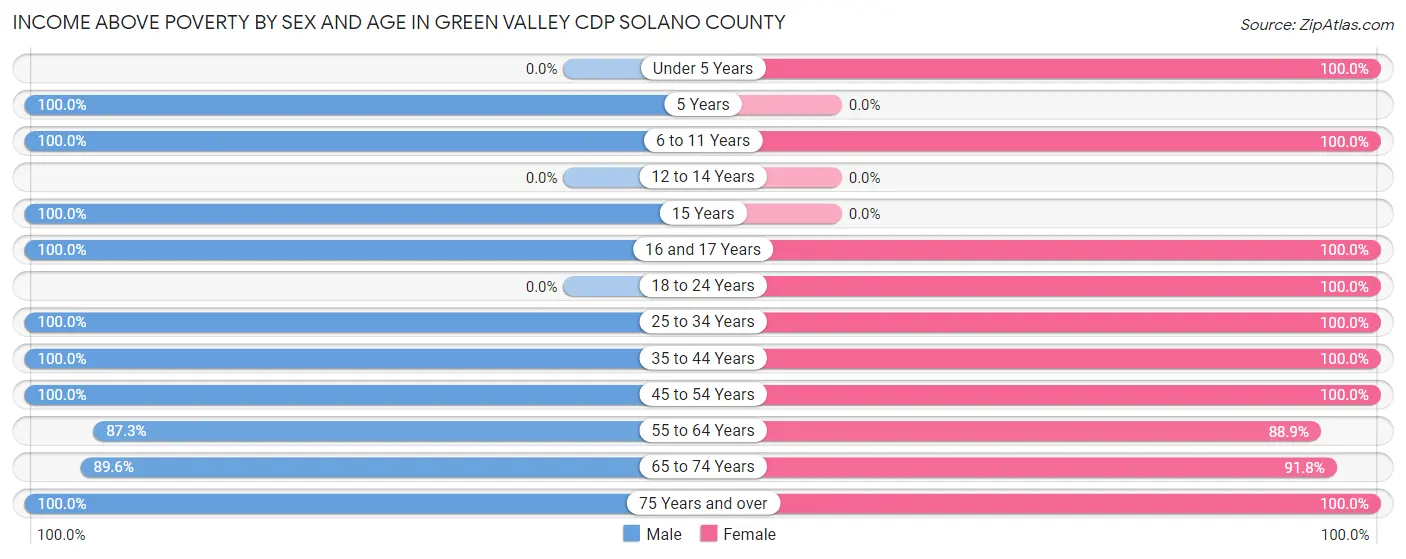
| Age Bracket | Male | Female |
| Under 5 Years | 0 (0.0%) | 77 (100.0%) |
| 5 Years | 17 (100.0%) | 0 (0.0%) |
| 6 to 11 Years | 50 (100.0%) | 38 (100.0%) |
| 12 to 14 Years | 0 (0.0%) | 0 (0.0%) |
| 15 Years | 8 (100.0%) | 0 (0.0%) |
| 16 and 17 Years | 8 (100.0%) | 27 (100.0%) |
| 18 to 24 Years | 0 (0.0%) | 22 (100.0%) |
| 25 to 34 Years | 72 (100.0%) | 92 (100.0%) |
| 35 to 44 Years | 21 (100.0%) | 34 (100.0%) |
| 45 to 54 Years | 114 (100.0%) | 78 (100.0%) |
| 55 to 64 Years | 137 (87.3%) | 232 (88.9%) |
| 65 to 74 Years | 138 (89.6%) | 180 (91.8%) |
| 75 Years and over | 106 (100.0%) | 54 (100.0%) |
| Total | 671 (94.9%) | 834 (94.9%) |
Income Below Poverty Among Married-Couple Families in Green Valley CDP Solano County
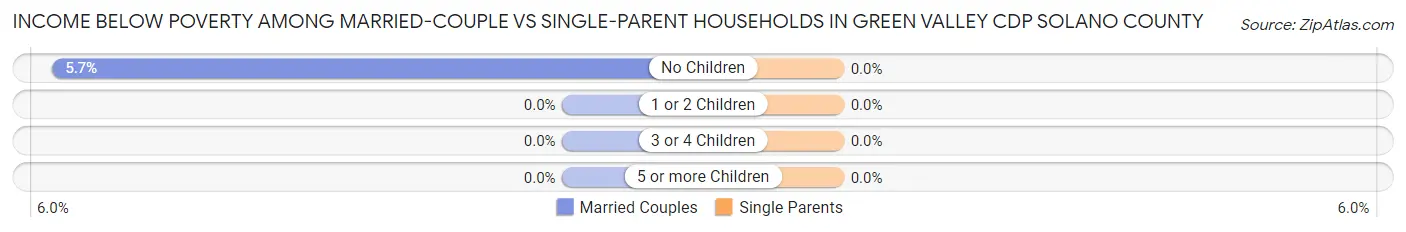
The poverty statistics for married-couple families in Green Valley CDP Solano County show that 4.2% or 16 of the total 385 families live below the poverty line. Families with no children have the highest poverty rate of 5.7%, comprising of 16 families. On the other hand, families with 1 or 2 children have the lowest poverty rate of 0.0%, which includes 0 families.
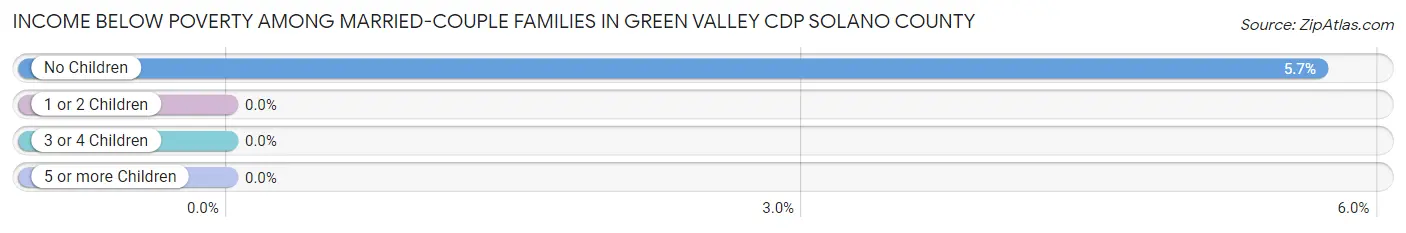
| Children | Above Poverty | Below Poverty |
| No Children | 265 (94.3%) | 16 (5.7%) |
| 1 or 2 Children | 104 (100.0%) | 0 (0.0%) |
| 3 or 4 Children | 0 (0.0%) | 0 (0.0%) |
| 5 or more Children | 0 (0.0%) | 0 (0.0%) |
| Total | 369 (95.8%) | 16 (4.2%) |
Income Below Poverty Among Single-Parent Households in Green Valley CDP Solano County
| Children | Single Father | Single Mother |
| No Children | 0 (0.0%) | 0 (0.0%) |
| 1 or 2 Children | 0 (0.0%) | 0 (0.0%) |
| 3 or 4 Children | 0 (0.0%) | 0 (0.0%) |
| 5 or more Children | 0 (0.0%) | 0 (0.0%) |
| Total | 0 (0.0%) | 0 (0.0%) |
Income Below Poverty Among Married-Couple vs Single-Parent Households in Green Valley CDP Solano County
| Children | Married-Couple Families | Single-Parent Households |
| No Children | 16 (5.7%) | 0 (0.0%) |
| 1 or 2 Children | 0 (0.0%) | 0 (0.0%) |
| 3 or 4 Children | 0 (0.0%) | 0 (0.0%) |
| 5 or more Children | 0 (0.0%) | 0 (0.0%) |
| Total | 16 (4.2%) | 0 (0.0%) |
Race in Green Valley CDP Solano County
The most populous races in Green Valley CDP Solano County are White / Caucasian (1,232 | 77.7%), Two or more Races (174 | 11.0%), and Hispanic or Latino (173 | 10.9%).
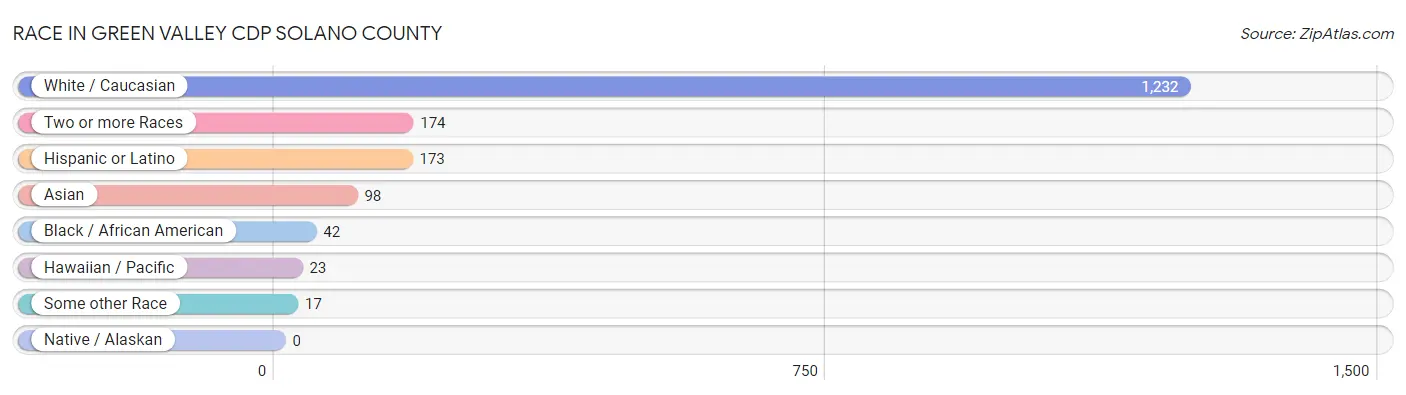
| Race | # Population | % Population |
| Asian | 98 | 6.2% |
| Black / African American | 42 | 2.6% |
| Hawaiian / Pacific | 23 | 1.5% |
| Hispanic or Latino | 173 | 10.9% |
| Native / Alaskan | 0 | 0.0% |
| White / Caucasian | 1,232 | 77.7% |
| Two or more Races | 174 | 11.0% |
| Some other Race | 17 | 1.1% |
| Total | 1,586 | 100.0% |
Ancestry in Green Valley CDP Solano County
The most populous ancestries reported in Green Valley CDP Solano County are European (411 | 25.9%), German (233 | 14.7%), English (219 | 13.8%), Irish (166 | 10.5%), and Mexican (83 | 5.2%), together accounting for 70.1% of all Green Valley CDP Solano County residents.
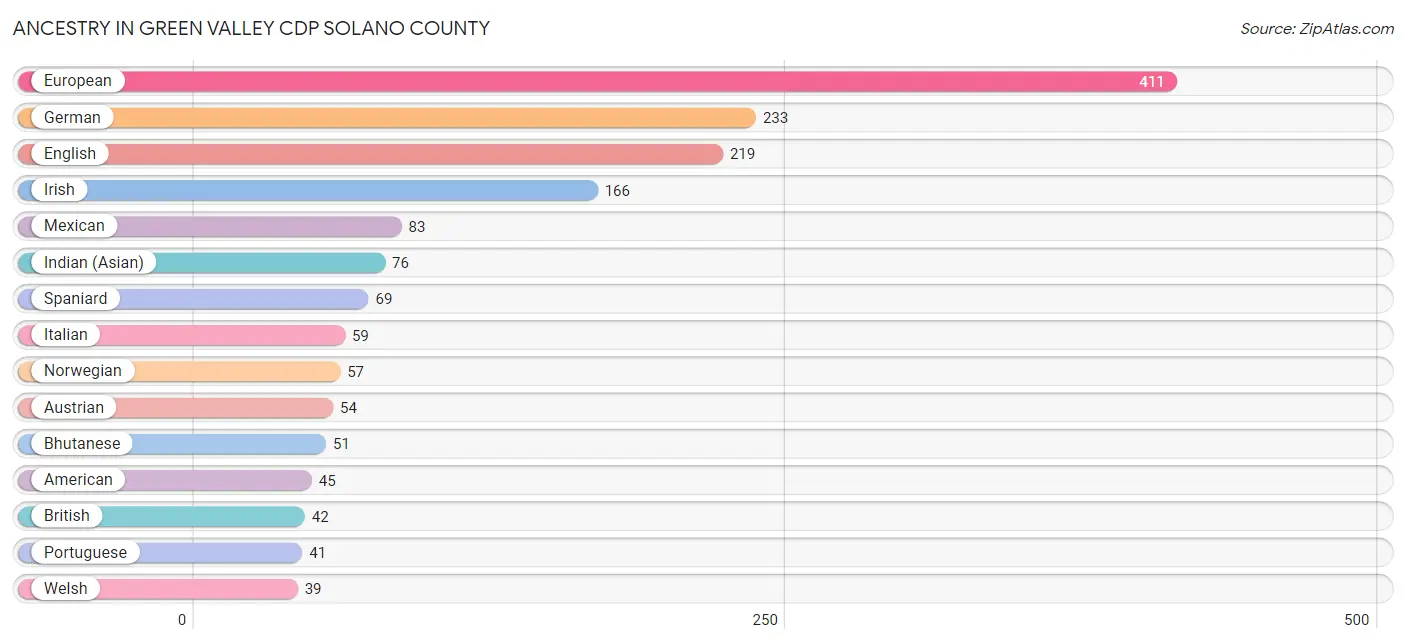
| Ancestry | # Population | % Population |
| African | 27 | 1.7% |
| American | 45 | 2.8% |
| Argentinean | 21 | 1.3% |
| Austrian | 54 | 3.4% |
| Bhutanese | 51 | 3.2% |
| British | 42 | 2.6% |
| Burmese | 26 | 1.6% |
| Danish | 16 | 1.0% |
| Dutch | 8 | 0.5% |
| English | 219 | 13.8% |
| European | 411 | 25.9% |
| Finnish | 10 | 0.6% |
| French | 23 | 1.5% |
| French Canadian | 36 | 2.3% |
| German | 233 | 14.7% |
| Guamanian / Chamorro | 23 | 1.5% |
| Indian (Asian) | 76 | 4.8% |
| Irish | 166 | 10.5% |
| Italian | 59 | 3.7% |
| Mexican | 83 | 5.2% |
| Northern European | 8 | 0.5% |
| Norwegian | 57 | 3.6% |
| Polish | 9 | 0.6% |
| Portuguese | 41 | 2.6% |
| Scotch-Irish | 14 | 0.9% |
| Scottish | 23 | 1.5% |
| Slavic | 14 | 0.9% |
| South American | 21 | 1.3% |
| Spaniard | 69 | 4.3% |
| Subsaharan African | 27 | 1.7% |
| Thai | 21 | 1.3% |
| Welsh | 39 | 2.5% | View All 32 Rows |
Immigrants in Green Valley CDP Solano County
The most numerous immigrant groups reported in Green Valley CDP Solano County came from Europe (76 | 4.8%), Asia (72 | 4.5%), Northern Europe (58 | 3.7%), South Eastern Asia (56 | 3.5%), and Southern Europe (18 | 1.1%), together accounting for 17.6% of all Green Valley CDP Solano County residents.
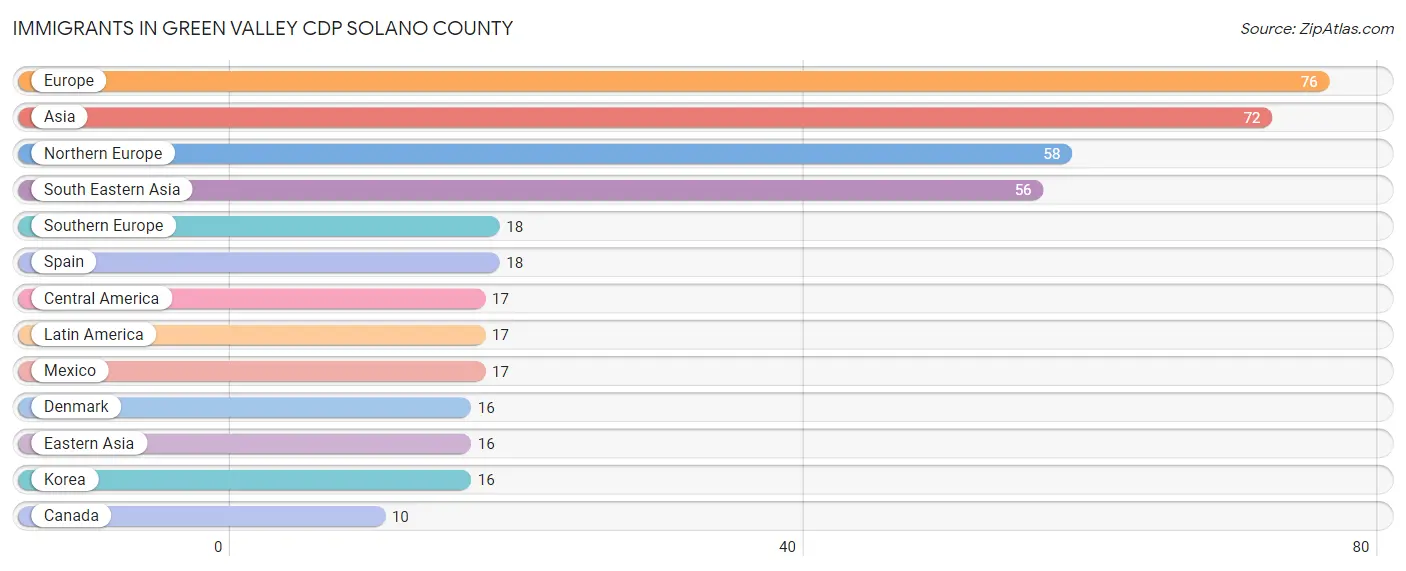
| Immigration Origin | # Population | % Population |
| Asia | 72 | 4.5% |
| Canada | 10 | 0.6% |
| Central America | 17 | 1.1% |
| Denmark | 16 | 1.0% |
| Eastern Asia | 16 | 1.0% |
| Europe | 76 | 4.8% |
| Korea | 16 | 1.0% |
| Latin America | 17 | 1.1% |
| Mexico | 17 | 1.1% |
| Northern Europe | 58 | 3.7% |
| South Eastern Asia | 56 | 3.5% |
| Southern Europe | 18 | 1.1% |
| Spain | 18 | 1.1% | View All 13 Rows |
Sex and Age in Green Valley CDP Solano County
Sex and Age in Green Valley CDP Solano County
The most populous age groups in Green Valley CDP Solano County are 60 to 64 Years (120 | 17.0%) for men and 60 to 64 Years (154 | 17.5%) for women.
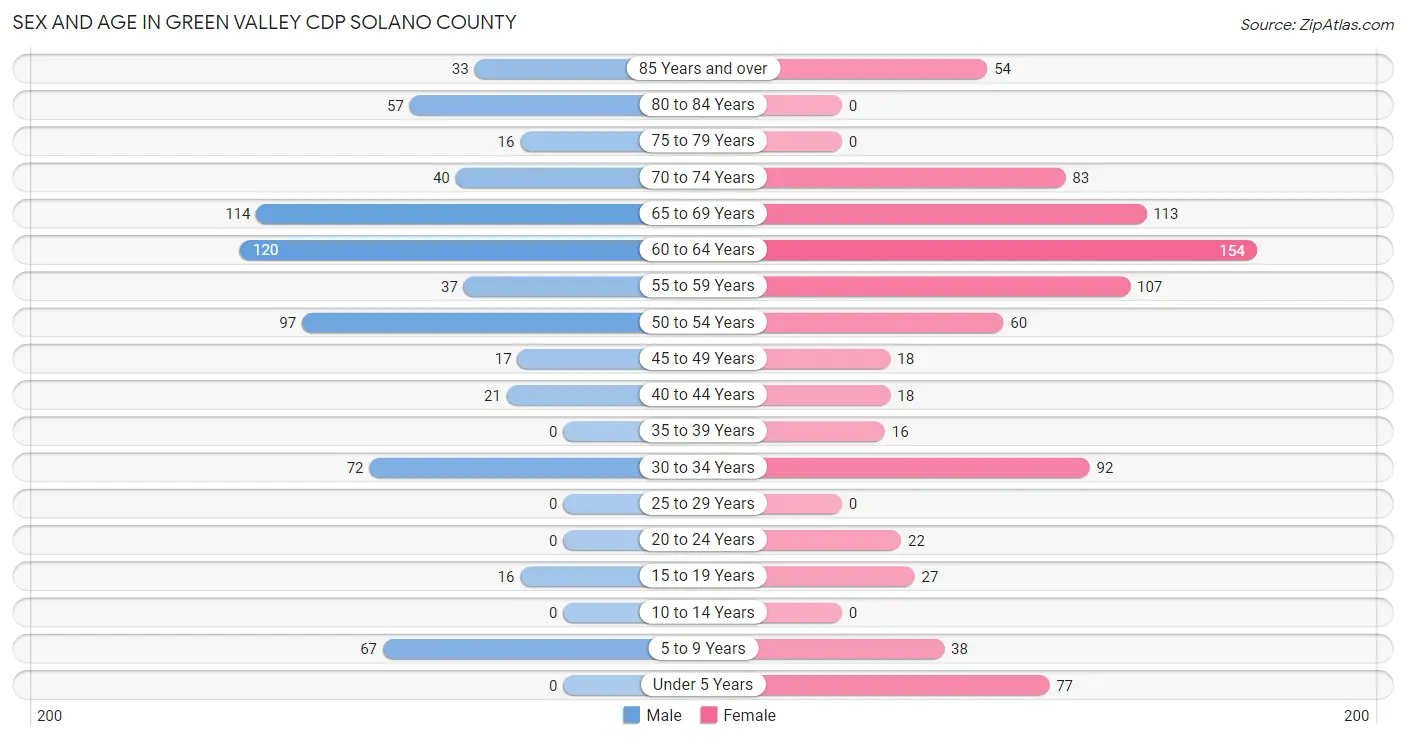
| Age Bracket | Male | Female |
| Under 5 Years | 0 (0.0%) | 77 (8.8%) |
| 5 to 9 Years | 67 (9.5%) | 38 (4.3%) |
| 10 to 14 Years | 0 (0.0%) | 0 (0.0%) |
| 15 to 19 Years | 16 (2.3%) | 27 (3.1%) |
| 20 to 24 Years | 0 (0.0%) | 22 (2.5%) |
| 25 to 29 Years | 0 (0.0%) | 0 (0.0%) |
| 30 to 34 Years | 72 (10.2%) | 92 (10.5%) |
| 35 to 39 Years | 0 (0.0%) | 16 (1.8%) |
| 40 to 44 Years | 21 (3.0%) | 18 (2.1%) |
| 45 to 49 Years | 17 (2.4%) | 18 (2.1%) |
| 50 to 54 Years | 97 (13.7%) | 60 (6.8%) |
| 55 to 59 Years | 37 (5.2%) | 107 (12.2%) |
| 60 to 64 Years | 120 (17.0%) | 154 (17.5%) |
| 65 to 69 Years | 114 (16.1%) | 113 (12.9%) |
| 70 to 74 Years | 40 (5.7%) | 83 (9.4%) |
| 75 to 79 Years | 16 (2.3%) | 0 (0.0%) |
| 80 to 84 Years | 57 (8.1%) | 0 (0.0%) |
| 85 Years and over | 33 (4.7%) | 54 (6.1%) |
| Total | 707 (100.0%) | 879 (100.0%) |
Families and Households in Green Valley CDP Solano County
Median Family Size in Green Valley CDP Solano County
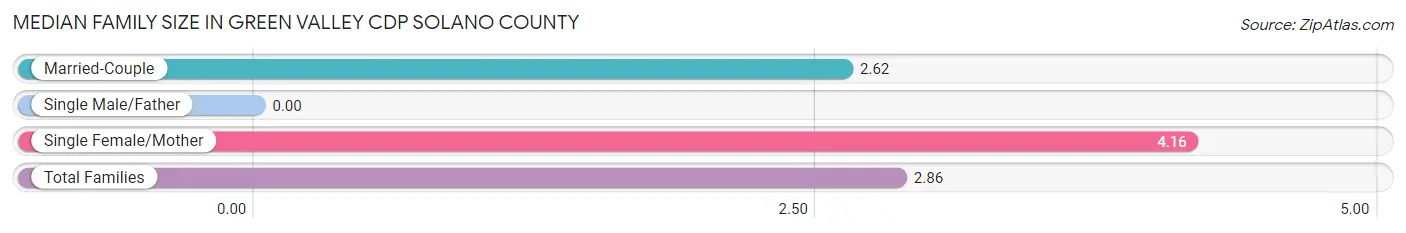
| Family Type | # Families | Family Size |
| Married-Couple | 385 (84.1%) | 2.62 |
| Single Male/Father | 0 (0.0%) | - |
| Single Female/Mother | 73 (15.9%) | 4.16 |
| Total Families | 458 (100.0%) | 2.86 |
Median Household Size in Green Valley CDP Solano County
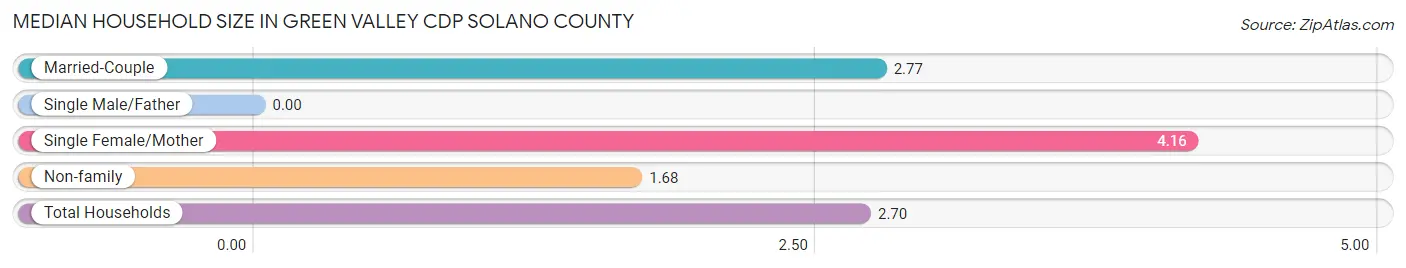
| Household Type | # Households | Household Size |
| Married-Couple | 385 (65.6%) | 2.77 |
| Single Male/Father | 0 (0.0%) | - |
| Single Female/Mother | 73 (12.4%) | 4.16 |
| Non-family | 129 (22.0%) | 1.68 |
| Total Households | 587 (100.0%) | 2.70 |
Household Size by Marriage Status in Green Valley CDP Solano County
Out of a total of 587 households in Green Valley CDP Solano County, 458 (78.0%) are family households, while 129 (22.0%) are nonfamily households. The most numerous type of family households are 2-person households, comprising 252, and the most common type of nonfamily households are 1-person households, comprising 71.
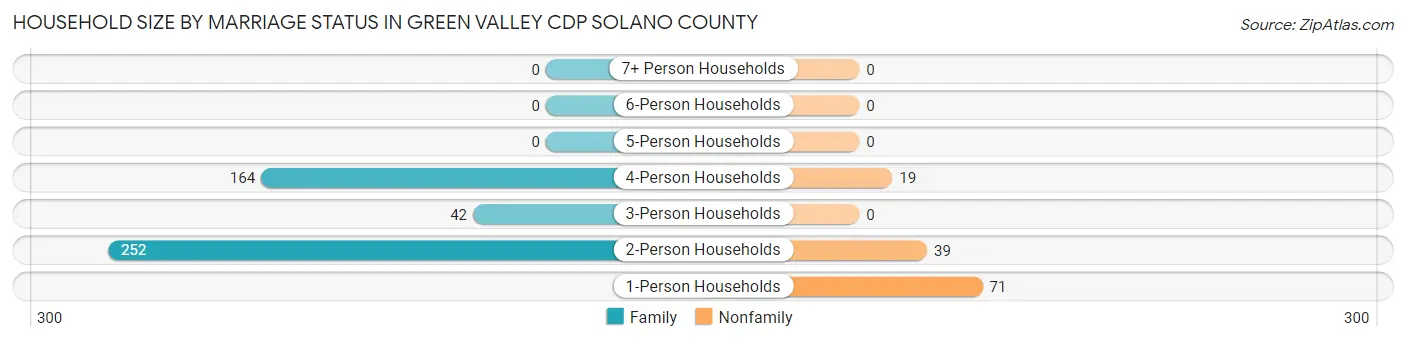
| Household Size | Family Households | Nonfamily Households |
| 1-Person Households | - | 71 (12.1%) |
| 2-Person Households | 252 (42.9%) | 39 (6.6%) |
| 3-Person Households | 42 (7.2%) | 0 (0.0%) |
| 4-Person Households | 164 (27.9%) | 19 (3.2%) |
| 5-Person Households | 0 (0.0%) | 0 (0.0%) |
| 6-Person Households | 0 (0.0%) | 0 (0.0%) |
| 7+ Person Households | 0 (0.0%) | 0 (0.0%) |
| Total | 458 (78.0%) | 129 (22.0%) |
Female Fertility in Green Valley CDP Solano County
Fertility by Age in Green Valley CDP Solano County
Average fertility rate in Green Valley CDP Solano County is 29.0 births per 1,000 women. Women in the age bracket of 35 to 50 years have the highest fertility rate with 95.0 births per 1,000 women. Women in the age bracket of 35 to 50 years acount for 100.0% of all women with births.
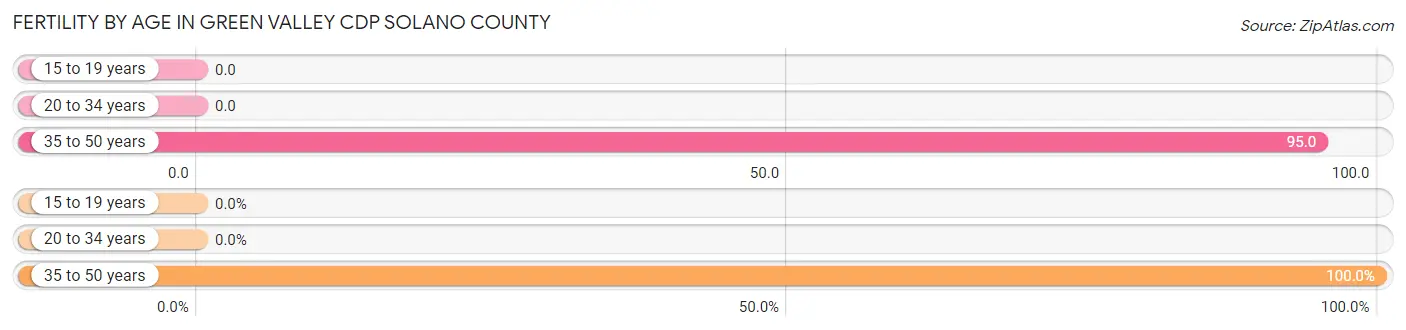
| Age Bracket | Women with Births | Births / 1,000 Women |
| 15 to 19 years | 0 (0.0%) | 0.0 |
| 20 to 34 years | 0 (0.0%) | 0.0 |
| 35 to 50 years | 6 (100.0%) | 95.0 |
| Total | 6 (100.0%) | 29.0 |
Fertility by Age by Marriage Status in Green Valley CDP Solano County
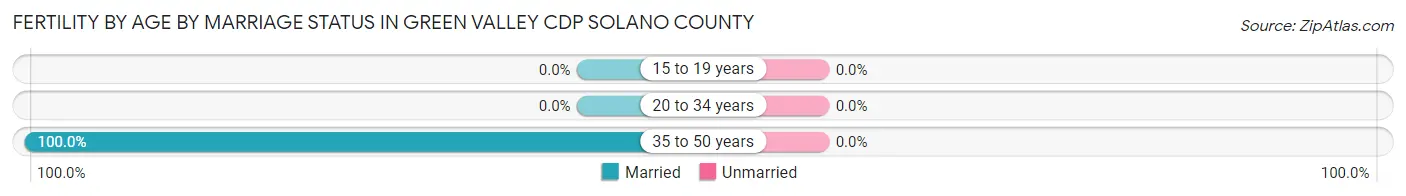
| Age Bracket | Married | Unmarried |
| 15 to 19 years | 0 (0.0%) | 0 (0.0%) |
| 20 to 34 years | 0 (0.0%) | 0 (0.0%) |
| 35 to 50 years | 6 (100.0%) | 0 (0.0%) |
| Total | 6 (100.0%) | 0 (0.0%) |
Fertility by Education in Green Valley CDP Solano County
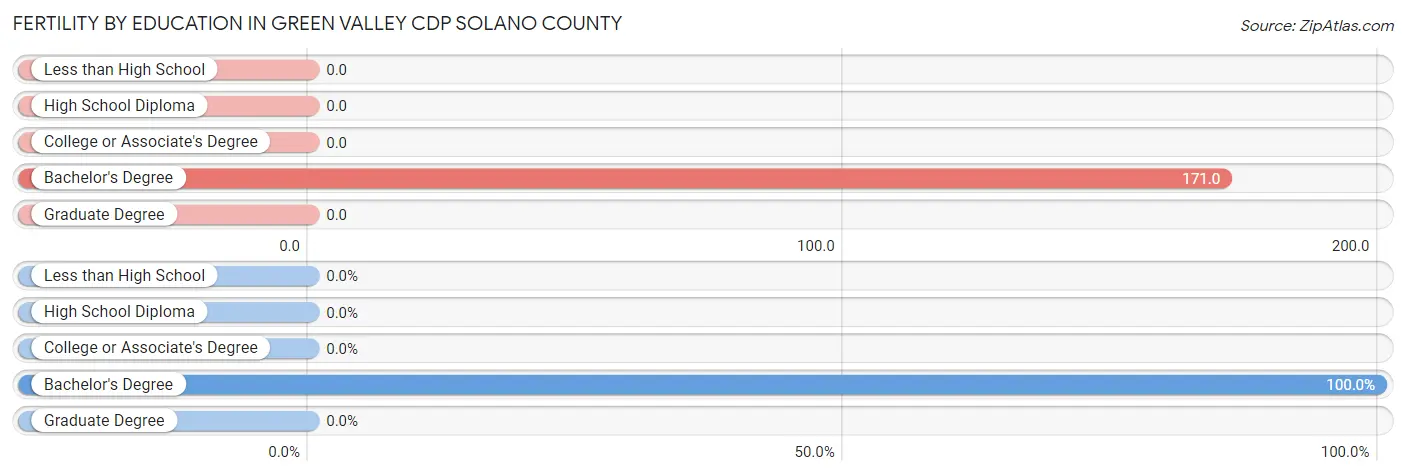
| Educational Attainment | Women with Births | Births / 1,000 Women |
| Less than High School | 0 (0.0%) | 0.0 |
| High School Diploma | 0 (0.0%) | 0.0 |
| College or Associate's Degree | 0 (0.0%) | 0.0 |
| Bachelor's Degree | 6 (100.0%) | 171.0 |
| Graduate Degree | 0 (0.0%) | 0.0 |
| Total | 6 (100.0%) | 29.0 |
Fertility by Education by Marriage Status in Green Valley CDP Solano County
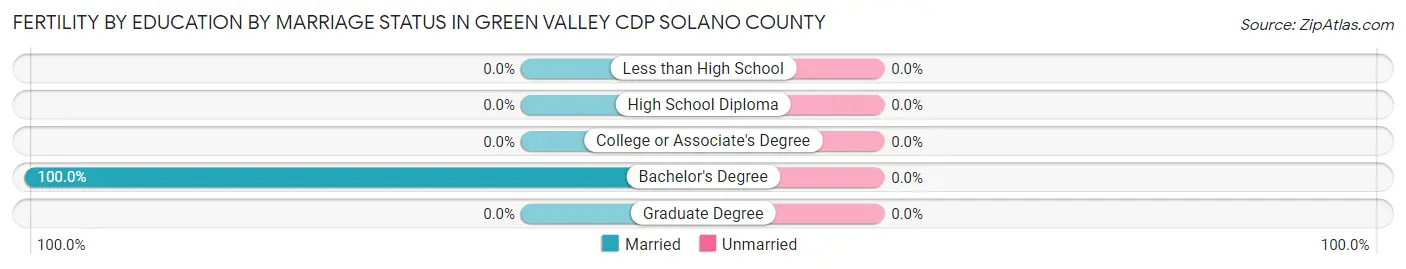
| Educational Attainment | Married | Unmarried |
| Less than High School | 0 (0.0%) | 0 (0.0%) |
| High School Diploma | 0 (0.0%) | 0 (0.0%) |
| College or Associate's Degree | 0 (0.0%) | 0 (0.0%) |
| Bachelor's Degree | 6 (100.0%) | 0 (0.0%) |
| Graduate Degree | 0 (0.0%) | 0 (0.0%) |
| Total | 6 (100.0%) | 0 (0.0%) |
Employment Characteristics in Green Valley CDP Solano County
Employment by Class of Employer in Green Valley CDP Solano County
Among the 701 employed individuals in Green Valley CDP Solano County, private company employees (456 | 65.0%), self-employed (incorporated) (102 | 14.5%), and self-employed (not incorporated) (73 | 10.4%) make up the most common classes of employment.
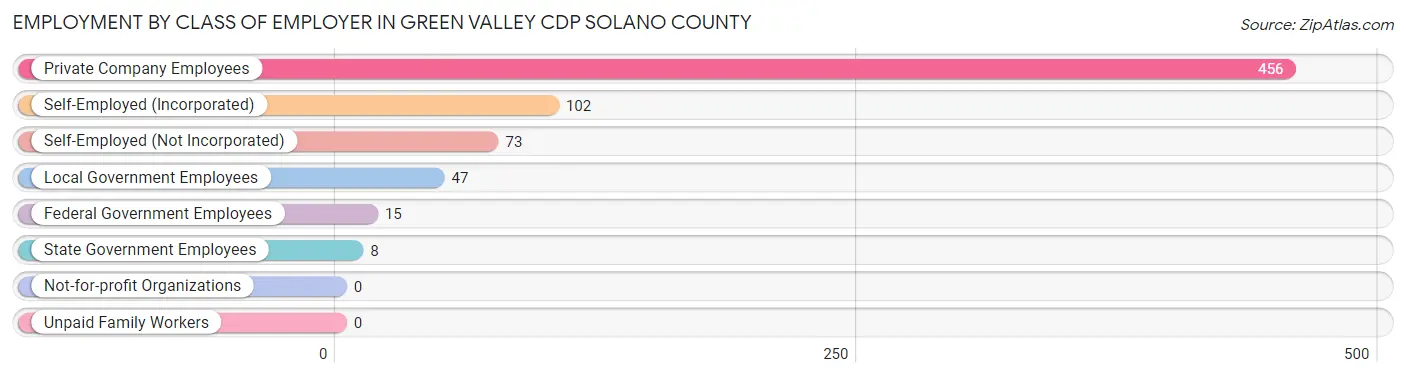
| Employer Class | # Employees | % Employees |
| Private Company Employees | 456 | 65.0% |
| Self-Employed (Incorporated) | 102 | 14.5% |
| Self-Employed (Not Incorporated) | 73 | 10.4% |
| Not-for-profit Organizations | 0 | 0.0% |
| Local Government Employees | 47 | 6.7% |
| State Government Employees | 8 | 1.1% |
| Federal Government Employees | 15 | 2.1% |
| Unpaid Family Workers | 0 | 0.0% |
| Total | 701 | 100.0% |
Employment Status by Age in Green Valley CDP Solano County
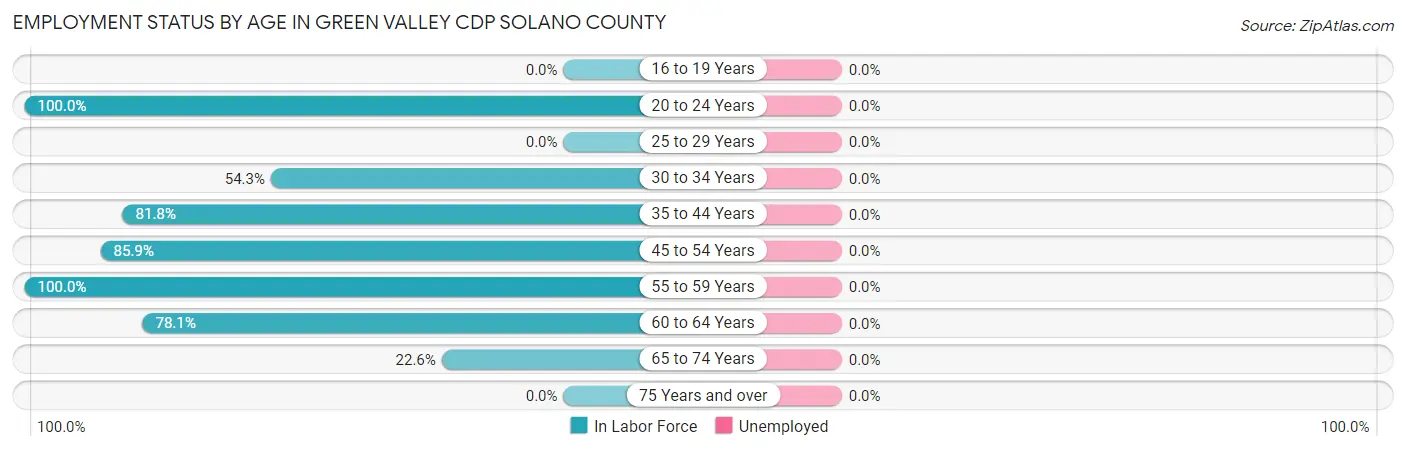
| Age Bracket | In Labor Force | Unemployed |
| 16 to 19 Years | 0 (0.0%) | 0 (0.0%) |
| 20 to 24 Years | 22 (100.0%) | 0 (0.0%) |
| 25 to 29 Years | 0 (0.0%) | 0 (0.0%) |
| 30 to 34 Years | 89 (54.3%) | 0 (0.0%) |
| 35 to 44 Years | 45 (81.8%) | 0 (0.0%) |
| 45 to 54 Years | 165 (85.9%) | 0 (0.0%) |
| 55 to 59 Years | 144 (100.0%) | 0 (0.0%) |
| 60 to 64 Years | 214 (78.1%) | 0 (0.0%) |
| 65 to 74 Years | 79 (22.6%) | 0 (0.0%) |
| 75 Years and over | 0 (0.0%) | 0 (0.0%) |
| Total | 758 (54.3%) | 0 (0.0%) |
Employment Status by Educational Attainment in Green Valley CDP Solano County
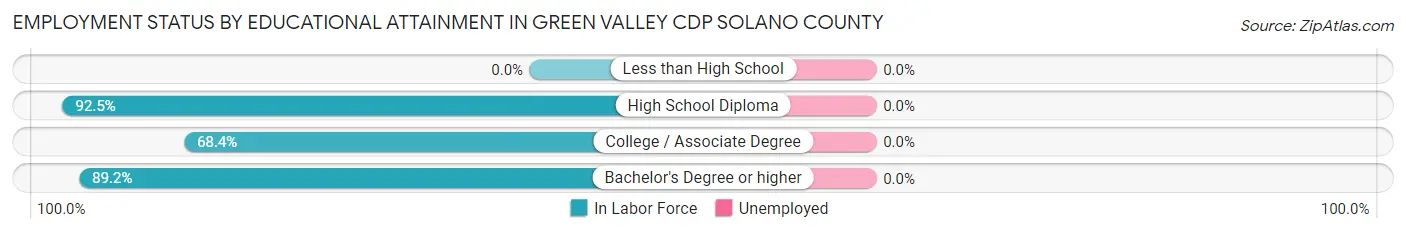
| Educational Attainment | In Labor Force | Unemployed |
| Less than High School | 0 (0.0%) | 0 (0.0%) |
| High School Diploma | 233 (92.5%) | 0 (0.0%) |
| College / Associate Degree | 184 (68.4%) | 0 (0.0%) |
| Bachelor's Degree or higher | 240 (89.2%) | 0 (0.0%) |
| Total | 657 (79.3%) | 0 (0.0%) |
Employment Occupations by Sex in Green Valley CDP Solano County
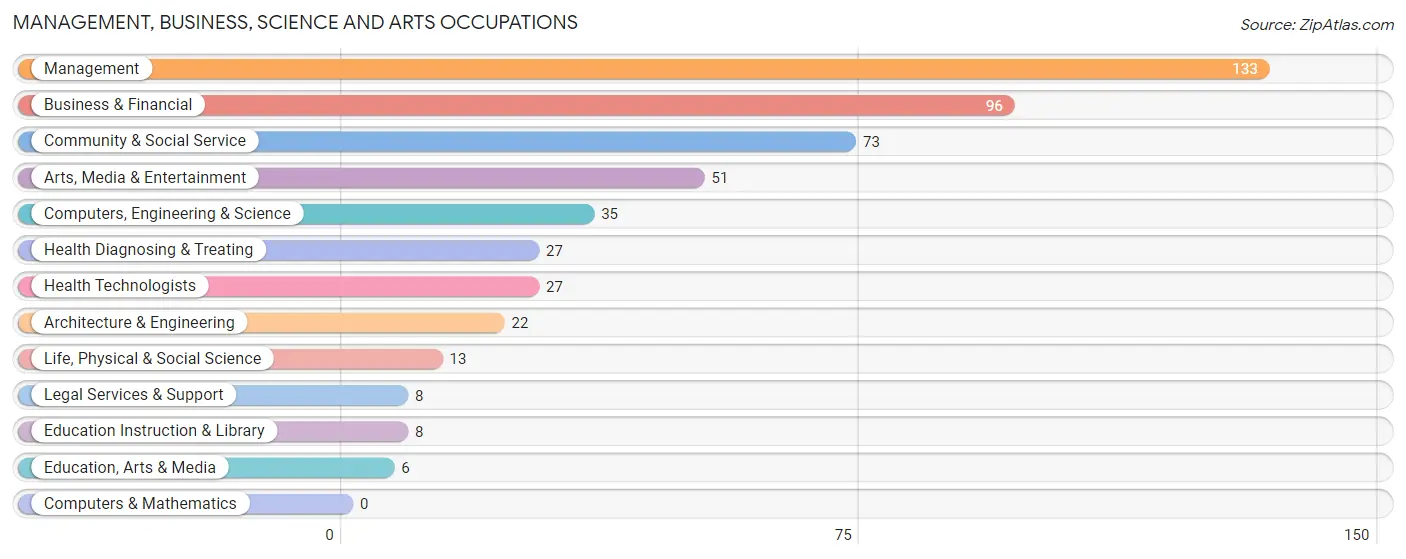
Management, Business, Science and Arts Occupations
The most common Management, Business, Science and Arts occupations in Green Valley CDP Solano County are Management (133 | 17.5%), Business & Financial (96 | 12.7%), Community & Social Service (73 | 9.6%), Arts, Media & Entertainment (51 | 6.7%), and Computers, Engineering & Science (35 | 4.6%).
Management, Business, Science and Arts Occupations by Sex
Within the Management, Business, Science and Arts occupations in Green Valley CDP Solano County, the most male-oriented occupations are Architecture & Engineering (100.0%), Legal Services & Support (100.0%), and Computers, Engineering & Science (62.9%), while the most female-oriented occupations are Business & Financial (100.0%), Life, Physical & Social Science (100.0%), and Education, Arts & Media (100.0%).
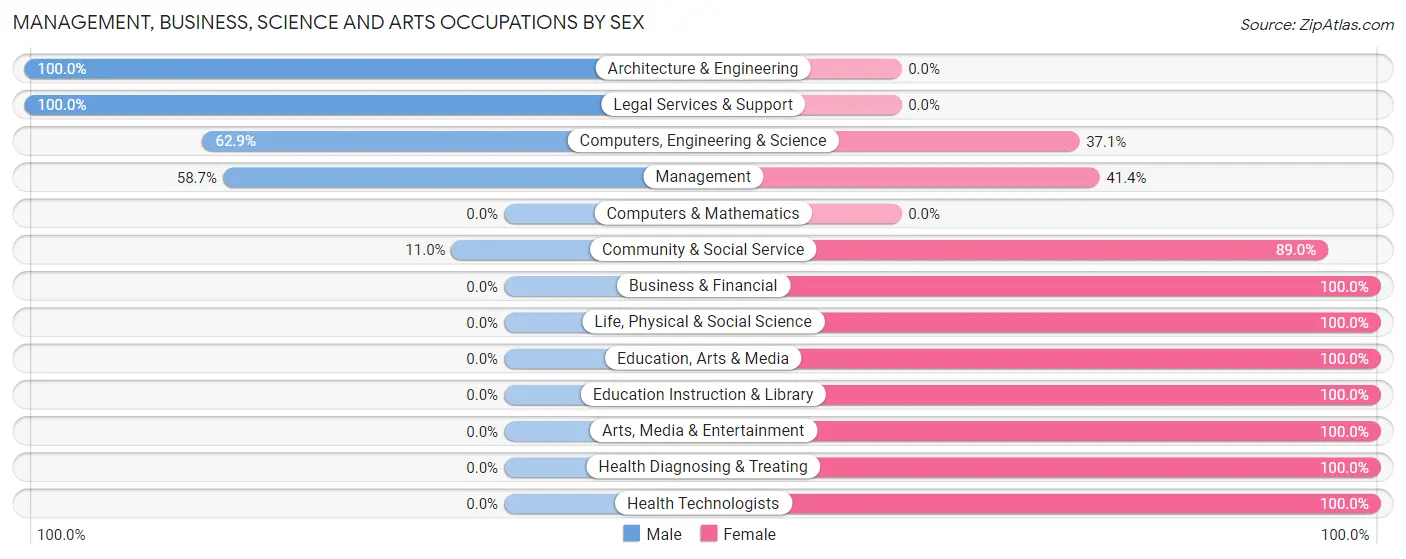
| Occupation | Male | Female |
| Management | 78 (58.7%) | 55 (41.3%) |
| Business & Financial | 0 (0.0%) | 96 (100.0%) |
| Computers, Engineering & Science | 22 (62.9%) | 13 (37.1%) |
| Computers & Mathematics | 0 (0.0%) | 0 (0.0%) |
| Architecture & Engineering | 22 (100.0%) | 0 (0.0%) |
| Life, Physical & Social Science | 0 (0.0%) | 13 (100.0%) |
| Community & Social Service | 8 (11.0%) | 65 (89.0%) |
| Education, Arts & Media | 0 (0.0%) | 6 (100.0%) |
| Legal Services & Support | 8 (100.0%) | 0 (0.0%) |
| Education Instruction & Library | 0 (0.0%) | 8 (100.0%) |
| Arts, Media & Entertainment | 0 (0.0%) | 51 (100.0%) |
| Health Diagnosing & Treating | 0 (0.0%) | 27 (100.0%) |
| Health Technologists | 0 (0.0%) | 27 (100.0%) |
| Total (Category) | 108 (29.7%) | 256 (70.3%) |
| Total (Overall) | 371 (48.9%) | 387 (51.1%) |
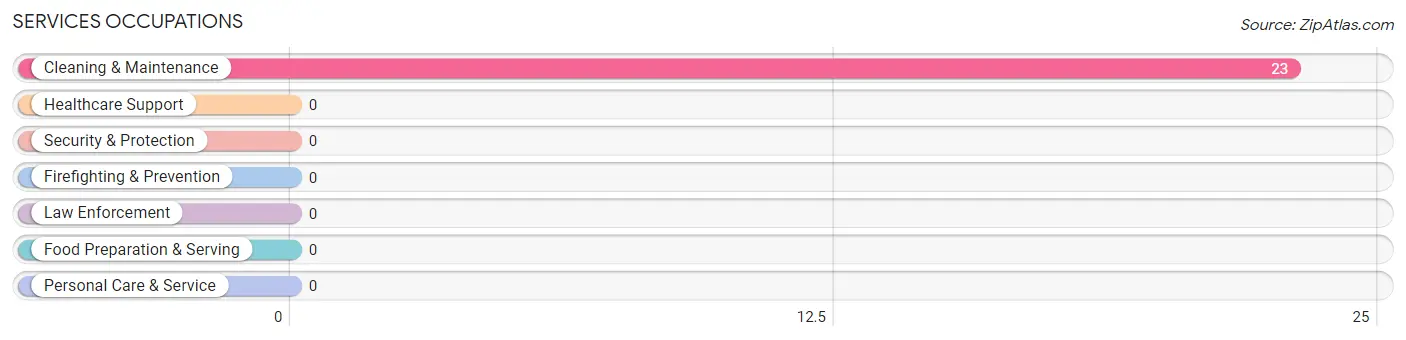
Services Occupations
The most common Services occupations in Green Valley CDP Solano County are , and Cleaning & Maintenance (23 | 3.0%).
Services Occupations by Sex
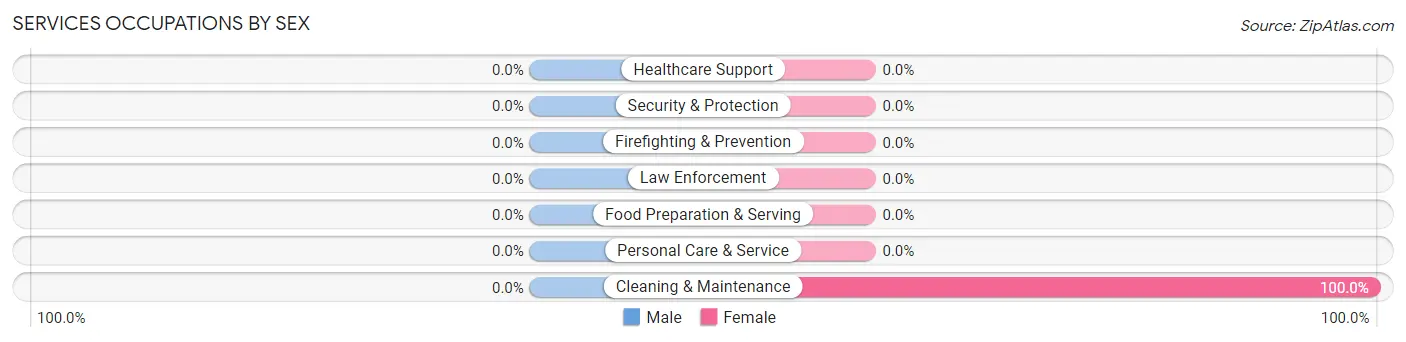
| Occupation | Male | Female |
| Healthcare Support | 0 (0.0%) | 0 (0.0%) |
| Security & Protection | 0 (0.0%) | 0 (0.0%) |
| Firefighting & Prevention | 0 (0.0%) | 0 (0.0%) |
| Law Enforcement | 0 (0.0%) | 0 (0.0%) |
| Food Preparation & Serving | 0 (0.0%) | 0 (0.0%) |
| Cleaning & Maintenance | 0 (0.0%) | 23 (100.0%) |
| Personal Care & Service | 0 (0.0%) | 0 (0.0%) |
| Total (Category) | 0 (0.0%) | 23 (100.0%) |
| Total (Overall) | 371 (48.9%) | 387 (51.1%) |
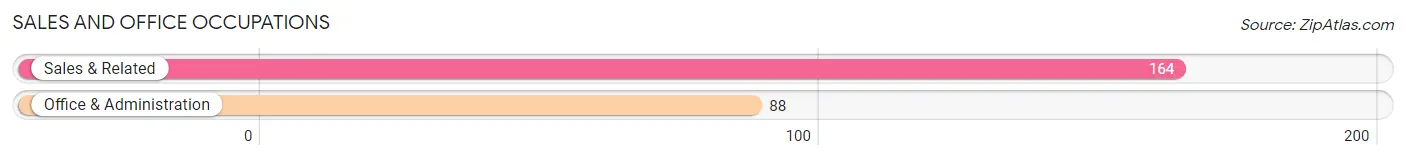
Sales and Office Occupations
The most common Sales and Office occupations in Green Valley CDP Solano County are Sales & Related (164 | 21.6%), and Office & Administration (88 | 11.6%).
Sales and Office Occupations by Sex
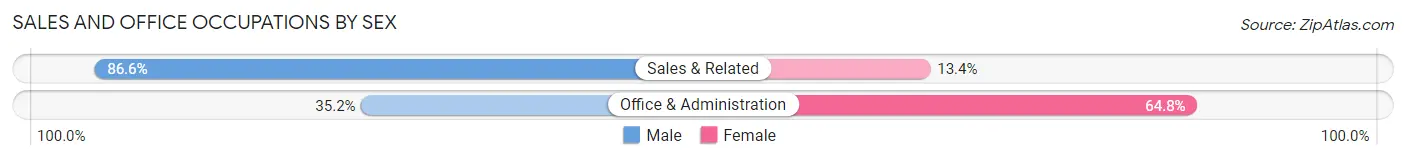
| Occupation | Male | Female |
| Sales & Related | 142 (86.6%) | 22 (13.4%) |
| Office & Administration | 31 (35.2%) | 57 (64.8%) |
| Total (Category) | 173 (68.6%) | 79 (31.4%) |
| Total (Overall) | 371 (48.9%) | 387 (51.1%) |
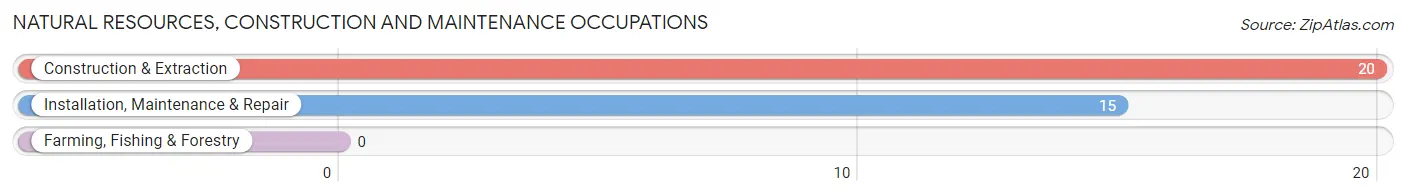
Natural Resources, Construction and Maintenance Occupations
The most common Natural Resources, Construction and Maintenance occupations in Green Valley CDP Solano County are Construction & Extraction (20 | 2.6%), and Installation, Maintenance & Repair (15 | 2.0%).
Natural Resources, Construction and Maintenance Occupations by Sex
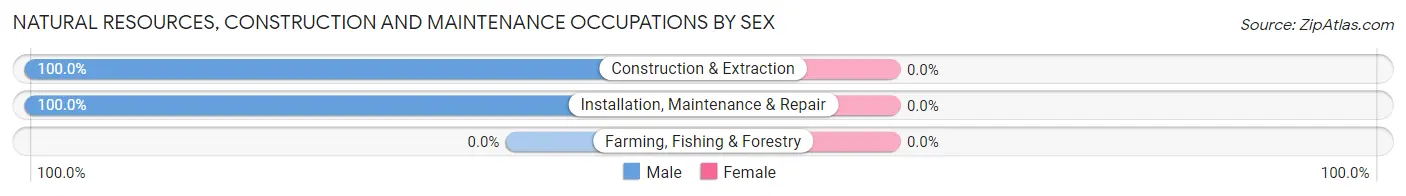
| Occupation | Male | Female |
| Farming, Fishing & Forestry | 0 (0.0%) | 0 (0.0%) |
| Construction & Extraction | 20 (100.0%) | 0 (0.0%) |
| Installation, Maintenance & Repair | 15 (100.0%) | 0 (0.0%) |
| Total (Category) | 35 (100.0%) | 0 (0.0%) |
| Total (Overall) | 371 (48.9%) | 387 (51.1%) |
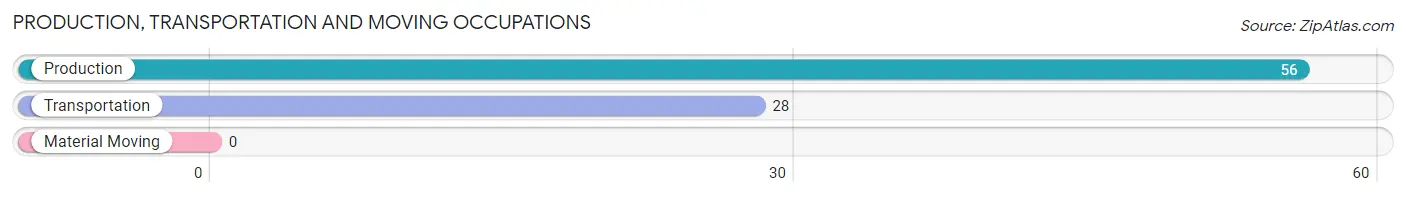
Production, Transportation and Moving Occupations
The most common Production, Transportation and Moving occupations in Green Valley CDP Solano County are Production (56 | 7.4%), and Transportation (28 | 3.7%).
Production, Transportation and Moving Occupations by Sex
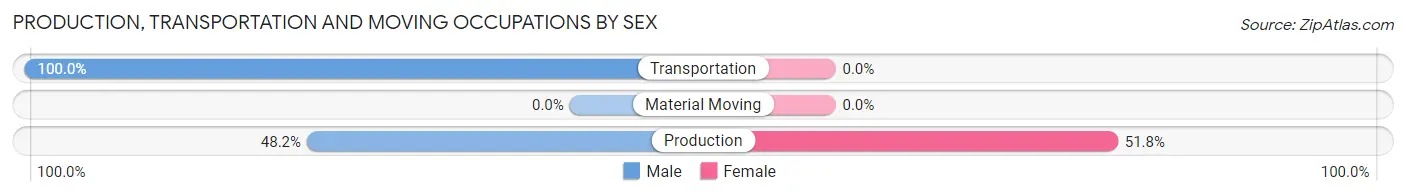
| Occupation | Male | Female |
| Production | 27 (48.2%) | 29 (51.8%) |
| Transportation | 28 (100.0%) | 0 (0.0%) |
| Material Moving | 0 (0.0%) | 0 (0.0%) |
| Total (Category) | 55 (65.5%) | 29 (34.5%) |
| Total (Overall) | 371 (48.9%) | 387 (51.1%) |
Employment Industries by Sex in Green Valley CDP Solano County
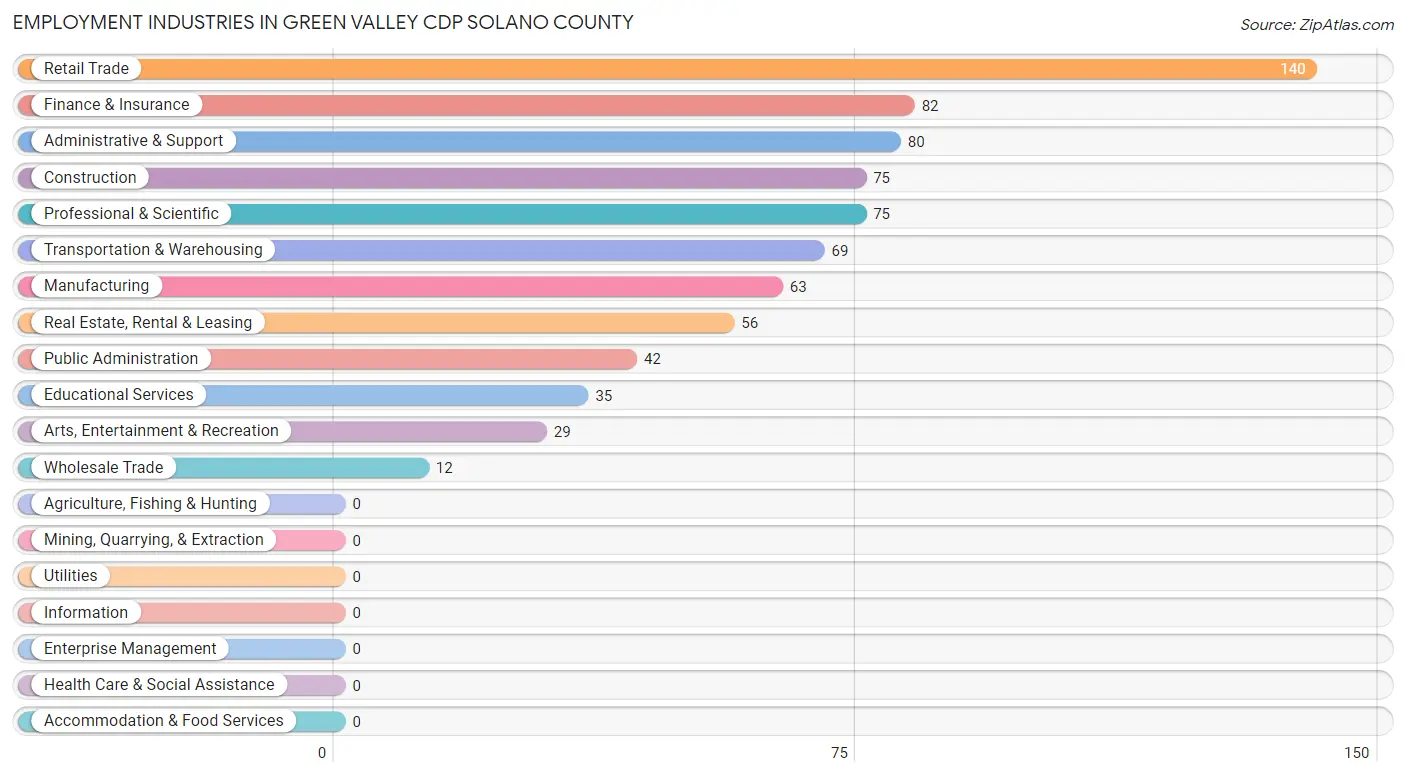
Employment Industries in Green Valley CDP Solano County
The major employment industries in Green Valley CDP Solano County include Retail Trade (140 | 18.5%), Finance & Insurance (82 | 10.8%), Administrative & Support (80 | 10.5%), Construction (75 | 9.9%), and Professional & Scientific (75 | 9.9%).
Employment Industries by Sex in Green Valley CDP Solano County
The Green Valley CDP Solano County industries that see more men than women are Administrative & Support (72.5%), Transportation & Warehousing (71.0%), and Construction (70.7%), whereas the industries that tend to have a higher number of women are Wholesale Trade (100.0%), Finance & Insurance (100.0%), and Educational Services (100.0%).
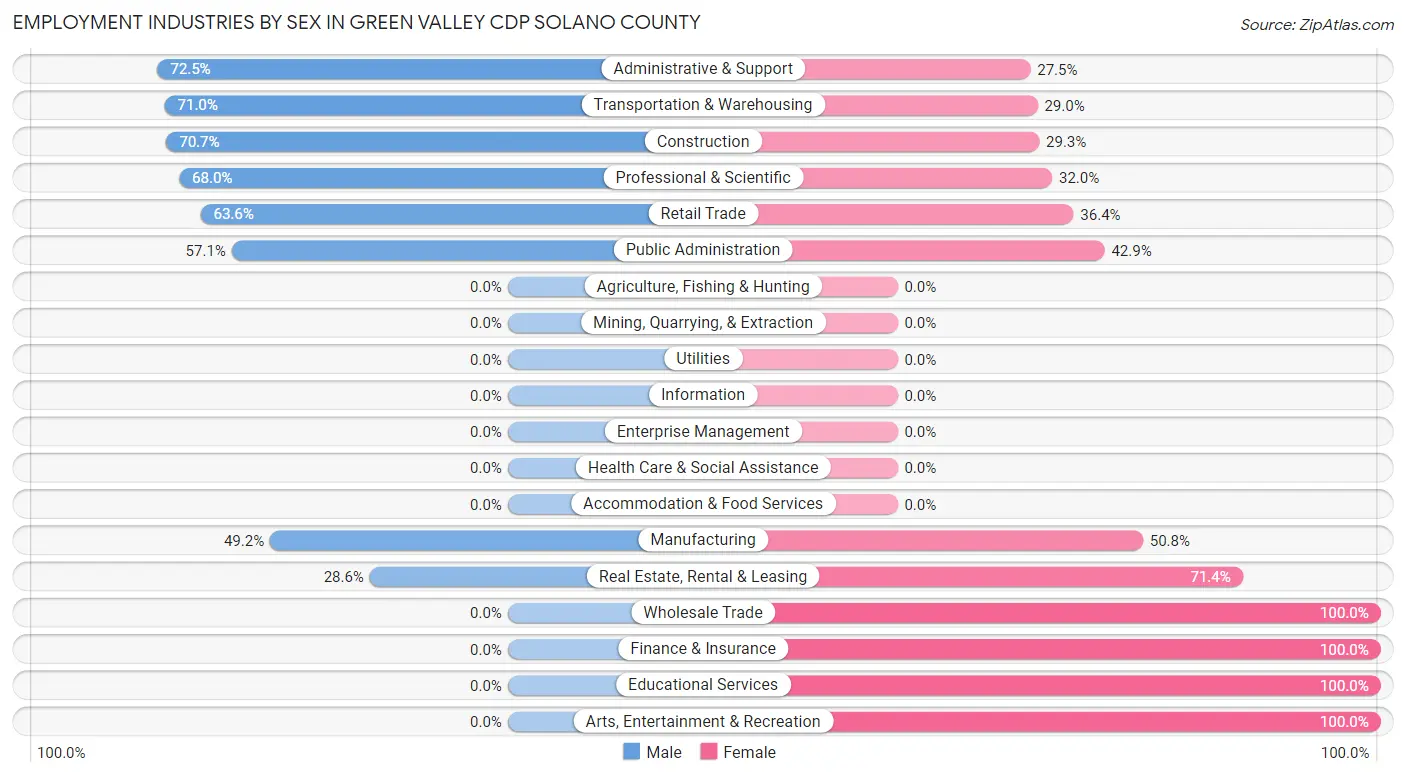
| Industry | Male | Female |
| Agriculture, Fishing & Hunting | 0 (0.0%) | 0 (0.0%) |
| Mining, Quarrying, & Extraction | 0 (0.0%) | 0 (0.0%) |
| Construction | 53 (70.7%) | 22 (29.3%) |
| Manufacturing | 31 (49.2%) | 32 (50.8%) |
| Wholesale Trade | 0 (0.0%) | 12 (100.0%) |
| Retail Trade | 89 (63.6%) | 51 (36.4%) |
| Transportation & Warehousing | 49 (71.0%) | 20 (29.0%) |
| Utilities | 0 (0.0%) | 0 (0.0%) |
| Information | 0 (0.0%) | 0 (0.0%) |
| Finance & Insurance | 0 (0.0%) | 82 (100.0%) |
| Real Estate, Rental & Leasing | 16 (28.6%) | 40 (71.4%) |
| Professional & Scientific | 51 (68.0%) | 24 (32.0%) |
| Enterprise Management | 0 (0.0%) | 0 (0.0%) |
| Administrative & Support | 58 (72.5%) | 22 (27.5%) |
| Educational Services | 0 (0.0%) | 35 (100.0%) |
| Health Care & Social Assistance | 0 (0.0%) | 0 (0.0%) |
| Arts, Entertainment & Recreation | 0 (0.0%) | 29 (100.0%) |
| Accommodation & Food Services | 0 (0.0%) | 0 (0.0%) |
| Public Administration | 24 (57.1%) | 18 (42.9%) |
| Total | 371 (48.9%) | 387 (51.1%) |
Education in Green Valley CDP Solano County
School Enrollment in Green Valley CDP Solano County
The most common levels of schooling among the 280 students in Green Valley CDP Solano County are college / undergraduate (114 | 40.7%), elementary school (68 | 24.3%), and high school (43 | 15.4%).
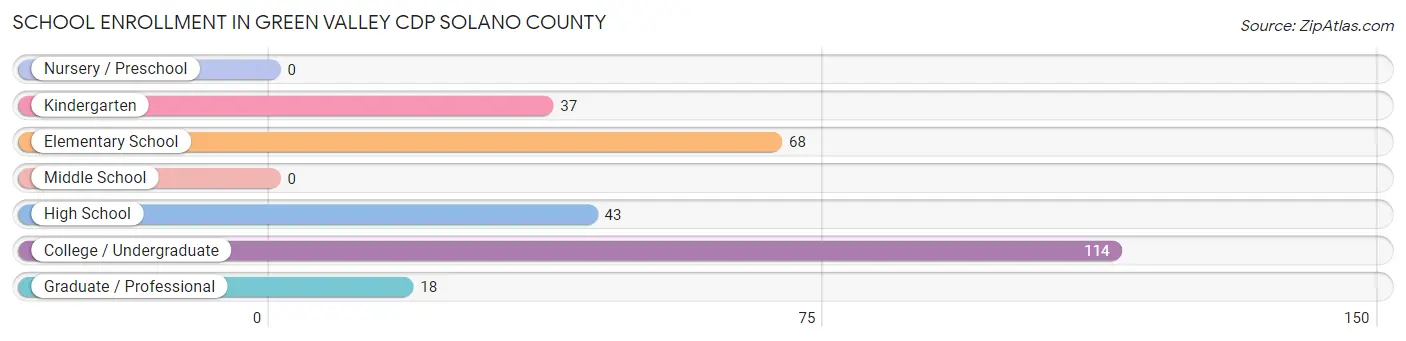
| School Level | # Students | % Students |
| Nursery / Preschool | 0 | 0.0% |
| Kindergarten | 37 | 13.2% |
| Elementary School | 68 | 24.3% |
| Middle School | 0 | 0.0% |
| High School | 43 | 15.4% |
| College / Undergraduate | 114 | 40.7% |
| Graduate / Professional | 18 | 6.4% |
| Total | 280 | 100.0% |
School Enrollment by Age by Funding Source in Green Valley CDP Solano County
Out of a total of 280 students who are enrolled in schools in Green Valley CDP Solano County, 74 (26.4%) attend a private institution, while the remaining 206 (73.6%) are enrolled in public schools. The age group of 35 years and over has the highest likelihood of being enrolled in private schools, with 18 (100.0% in the age bracket) enrolled. Conversely, the age group of 20 to 24 year olds has the lowest likelihood of being enrolled in a private school, with 22 (100.0% in the age bracket) attending a public institution.
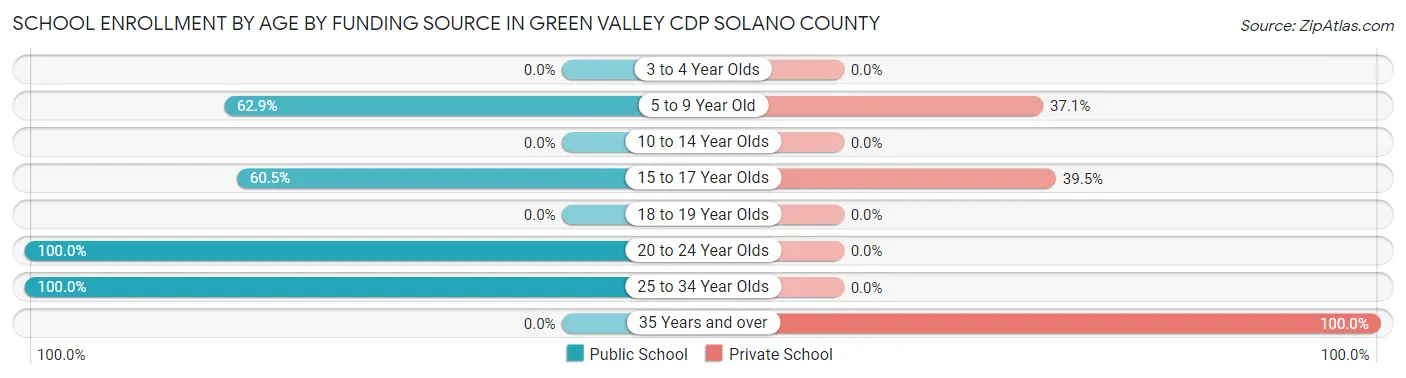
| Age Bracket | Public School | Private School |
| 3 to 4 Year Olds | 0 (0.0%) | 0 (0.0%) |
| 5 to 9 Year Old | 66 (62.9%) | 39 (37.1%) |
| 10 to 14 Year Olds | 0 (0.0%) | 0 (0.0%) |
| 15 to 17 Year Olds | 26 (60.5%) | 17 (39.5%) |
| 18 to 19 Year Olds | 0 (0.0%) | 0 (0.0%) |
| 20 to 24 Year Olds | 22 (100.0%) | 0 (0.0%) |
| 25 to 34 Year Olds | 92 (100.0%) | 0 (0.0%) |
| 35 Years and over | 0 (0.0%) | 18 (100.0%) |
| Total | 206 (73.6%) | 74 (26.4%) |
Educational Attainment by Field of Study in Green Valley CDP Solano County
Business (176 | 25.9%), bio, nature & agricultural (161 | 23.7%), science & technology (83 | 12.2%), education (57 | 8.4%), and engineering (44 | 6.5%) are the most common fields of study among 679 individuals in Green Valley CDP Solano County who have obtained a bachelor's degree or higher.
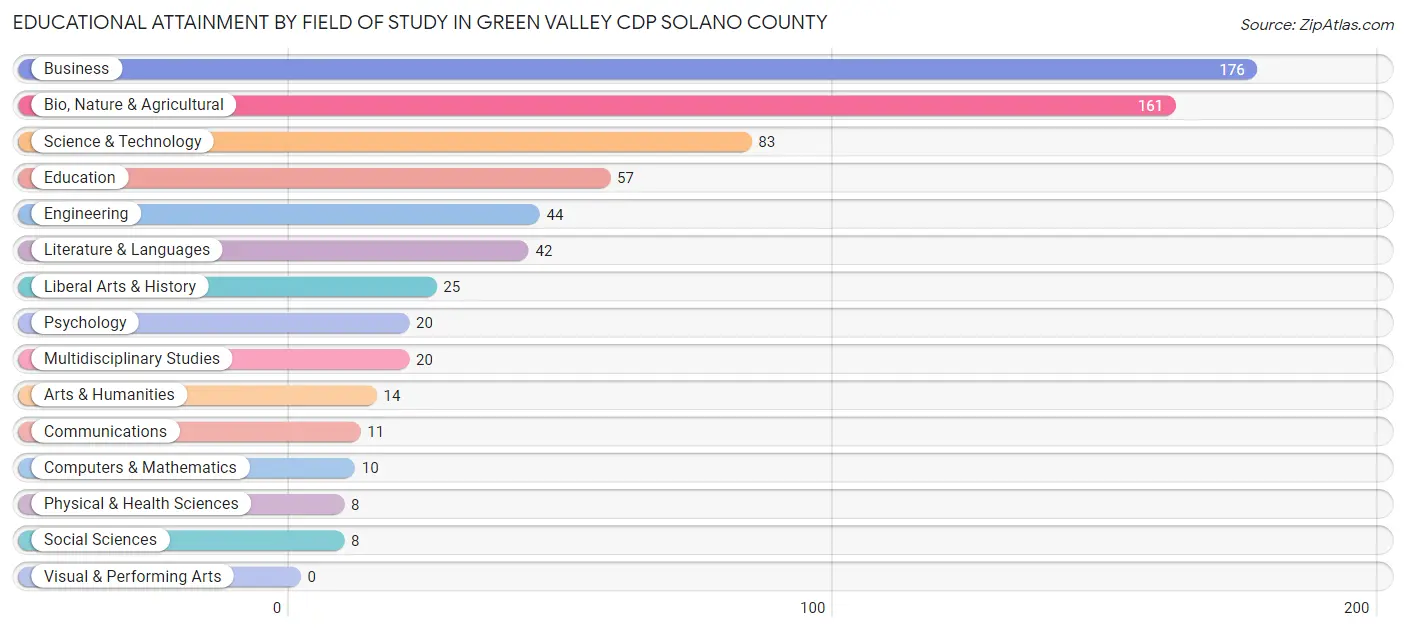
| Field of Study | # Graduates | % Graduates |
| Computers & Mathematics | 10 | 1.5% |
| Bio, Nature & Agricultural | 161 | 23.7% |
| Physical & Health Sciences | 8 | 1.2% |
| Psychology | 20 | 2.9% |
| Social Sciences | 8 | 1.2% |
| Engineering | 44 | 6.5% |
| Multidisciplinary Studies | 20 | 2.9% |
| Science & Technology | 83 | 12.2% |
| Business | 176 | 25.9% |
| Education | 57 | 8.4% |
| Literature & Languages | 42 | 6.2% |
| Liberal Arts & History | 25 | 3.7% |
| Visual & Performing Arts | 0 | 0.0% |
| Communications | 11 | 1.6% |
| Arts & Humanities | 14 | 2.1% |
| Total | 679 | 100.0% |
Transportation & Commute in Green Valley CDP Solano County
Vehicle Availability by Sex in Green Valley CDP Solano County
The most prevalent vehicle ownership categories in Green Valley CDP Solano County are males with 3 vehicles (141, accounting for 41.1%) and females with 3 vehicles (199, making up 39.4%).
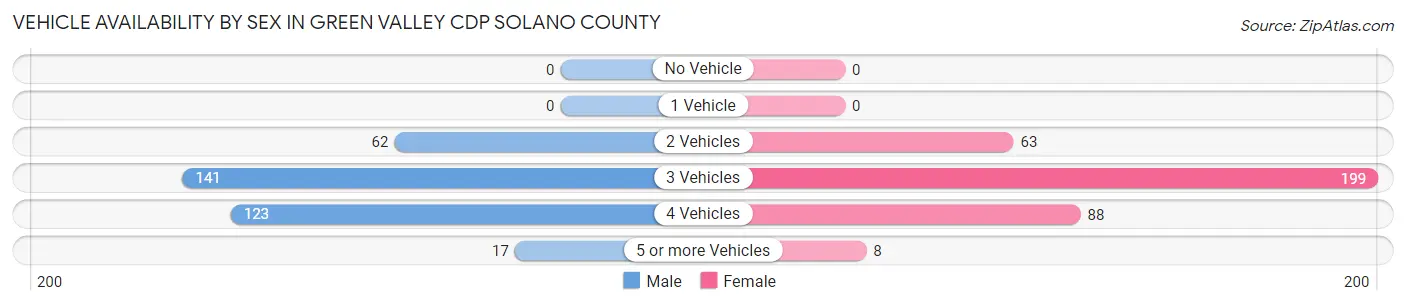
| Vehicles Available | Male | Female |
| No Vehicle | 0 (0.0%) | 0 (0.0%) |
| 1 Vehicle | 0 (0.0%) | 0 (0.0%) |
| 2 Vehicles | 62 (18.1%) | 63 (17.6%) |
| 3 Vehicles | 141 (41.1%) | 199 (55.6%) |
| 4 Vehicles | 123 (35.9%) | 88 (24.6%) |
| 5 or more Vehicles | 17 (5.0%) | 8 (2.2%) |
| Total | 343 (100.0%) | 358 (100.0%) |
Commute Time in Green Valley CDP Solano County
The most frequently occuring commute durations in Green Valley CDP Solano County are 30 to 34 minutes (146 commuters, 24.7%), 25 to 29 minutes (127 commuters, 21.5%), and 60 to 89 minutes (76 commuters, 12.9%).
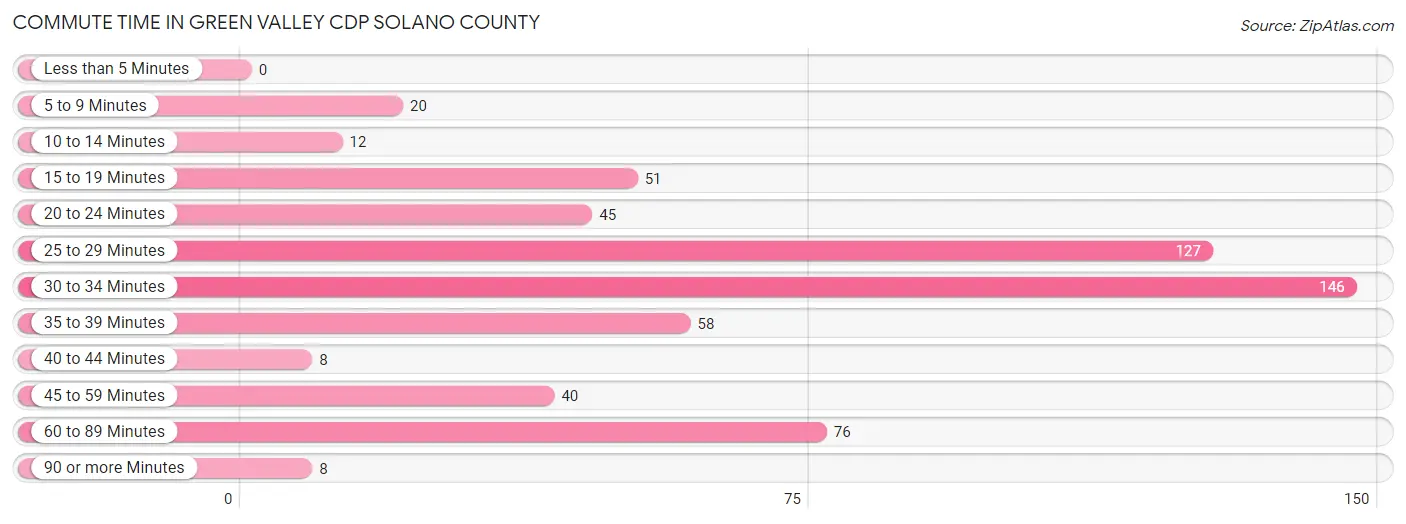
| Commute Time | # Commuters | % Commuters |
| Less than 5 Minutes | 0 | 0.0% |
| 5 to 9 Minutes | 20 | 3.4% |
| 10 to 14 Minutes | 12 | 2.0% |
| 15 to 19 Minutes | 51 | 8.6% |
| 20 to 24 Minutes | 45 | 7.6% |
| 25 to 29 Minutes | 127 | 21.5% |
| 30 to 34 Minutes | 146 | 24.7% |
| 35 to 39 Minutes | 58 | 9.8% |
| 40 to 44 Minutes | 8 | 1.3% |
| 45 to 59 Minutes | 40 | 6.8% |
| 60 to 89 Minutes | 76 | 12.9% |
| 90 or more Minutes | 8 | 1.3% |
Commute Time by Sex in Green Valley CDP Solano County
The most common commute times in Green Valley CDP Solano County are 30 to 34 minutes (87 commuters, 27.2%) for males and 25 to 29 minutes (59 commuters, 21.8%) for females.
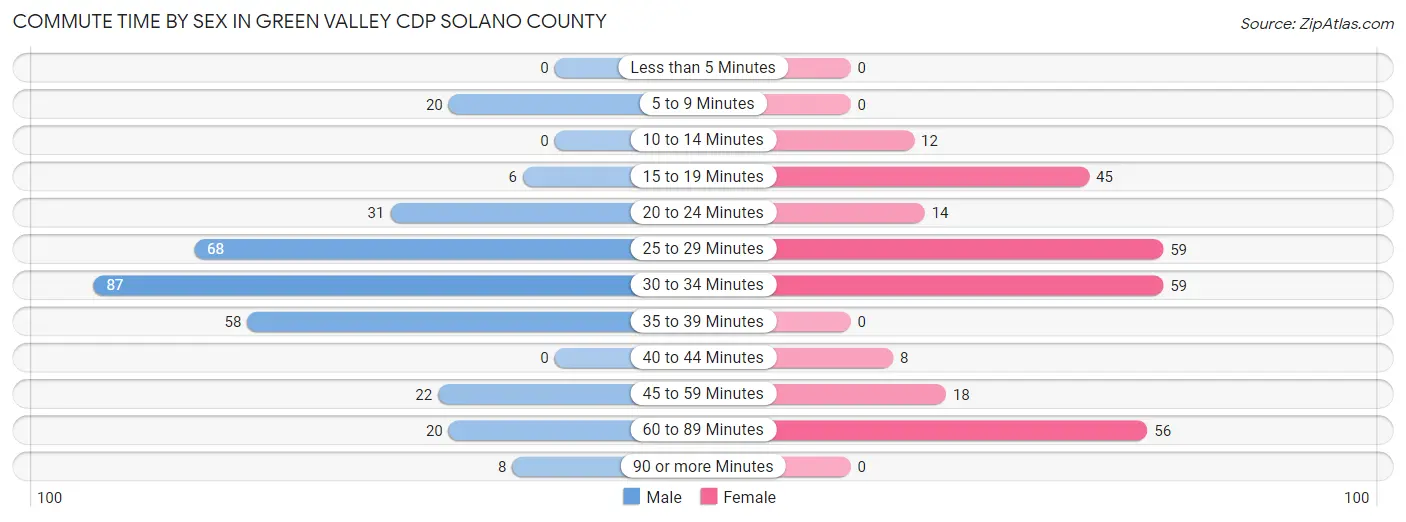
| Commute Time | Male | Female |
| Less than 5 Minutes | 0 (0.0%) | 0 (0.0%) |
| 5 to 9 Minutes | 20 (6.2%) | 0 (0.0%) |
| 10 to 14 Minutes | 0 (0.0%) | 12 (4.4%) |
| 15 to 19 Minutes | 6 (1.9%) | 45 (16.6%) |
| 20 to 24 Minutes | 31 (9.7%) | 14 (5.2%) |
| 25 to 29 Minutes | 68 (21.2%) | 59 (21.8%) |
| 30 to 34 Minutes | 87 (27.2%) | 59 (21.8%) |
| 35 to 39 Minutes | 58 (18.1%) | 0 (0.0%) |
| 40 to 44 Minutes | 0 (0.0%) | 8 (2.9%) |
| 45 to 59 Minutes | 22 (6.9%) | 18 (6.6%) |
| 60 to 89 Minutes | 20 (6.2%) | 56 (20.7%) |
| 90 or more Minutes | 8 (2.5%) | 0 (0.0%) |
Time of Departure to Work by Sex in Green Valley CDP Solano County
The most frequent times of departure to work in Green Valley CDP Solano County are 12:00 PM to 3:59 PM (103, 32.2%) for males and 6:30 AM to 6:59 AM (77, 28.4%) for females.
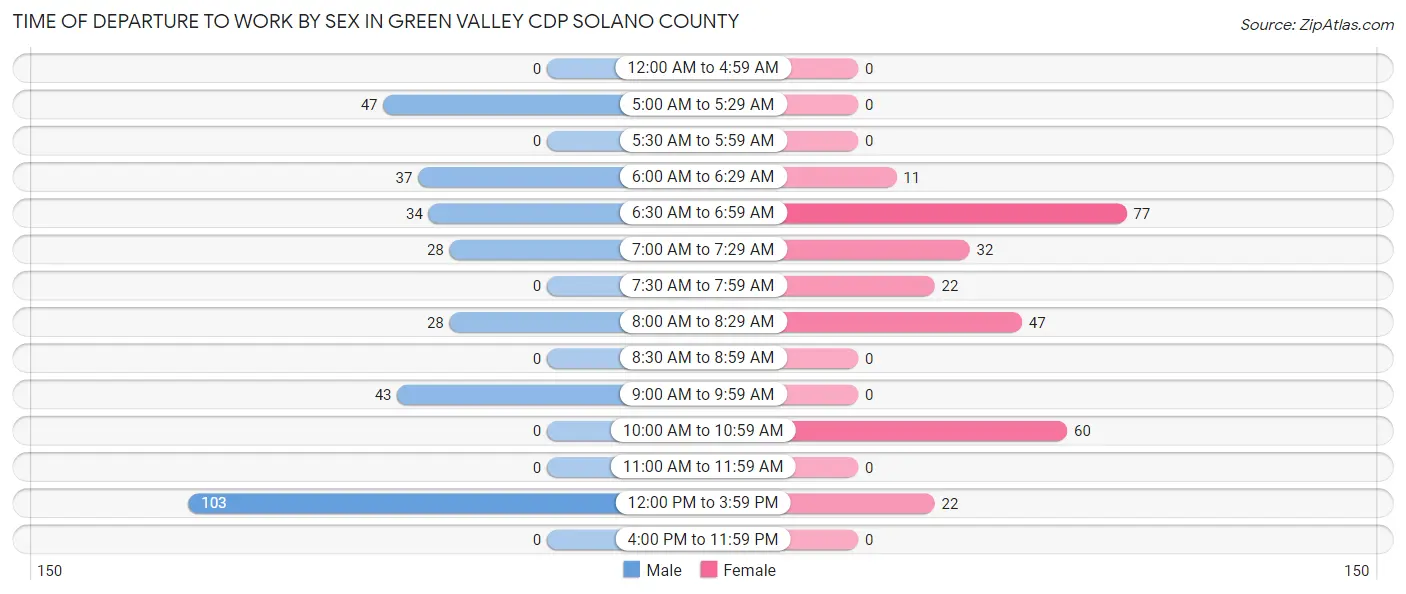
| Time of Departure | Male | Female |
| 12:00 AM to 4:59 AM | 0 (0.0%) | 0 (0.0%) |
| 5:00 AM to 5:29 AM | 47 (14.7%) | 0 (0.0%) |
| 5:30 AM to 5:59 AM | 0 (0.0%) | 0 (0.0%) |
| 6:00 AM to 6:29 AM | 37 (11.6%) | 11 (4.1%) |
| 6:30 AM to 6:59 AM | 34 (10.6%) | 77 (28.4%) |
| 7:00 AM to 7:29 AM | 28 (8.7%) | 32 (11.8%) |
| 7:30 AM to 7:59 AM | 0 (0.0%) | 22 (8.1%) |
| 8:00 AM to 8:29 AM | 28 (8.7%) | 47 (17.3%) |
| 8:30 AM to 8:59 AM | 0 (0.0%) | 0 (0.0%) |
| 9:00 AM to 9:59 AM | 43 (13.4%) | 0 (0.0%) |
| 10:00 AM to 10:59 AM | 0 (0.0%) | 60 (22.1%) |
| 11:00 AM to 11:59 AM | 0 (0.0%) | 0 (0.0%) |
| 12:00 PM to 3:59 PM | 103 (32.2%) | 22 (8.1%) |
| 4:00 PM to 11:59 PM | 0 (0.0%) | 0 (0.0%) |
| Total | 320 (100.0%) | 271 (100.0%) |
Housing Occupancy in Green Valley CDP Solano County
Occupancy by Ownership in Green Valley CDP Solano County
Of the total 587 dwellings in Green Valley CDP Solano County, owner-occupied units account for 568 (96.8%), while renter-occupied units make up 19 (3.2%).
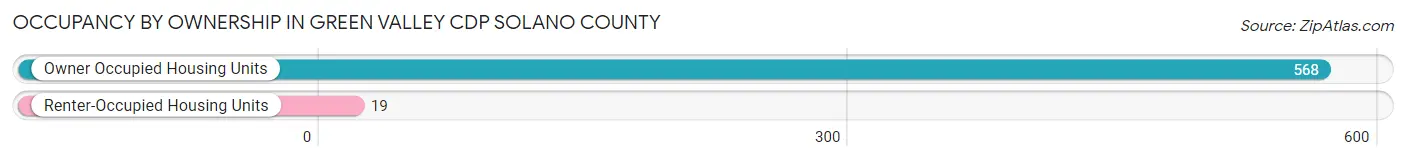
| Occupancy | # Housing Units | % Housing Units |
| Owner Occupied Housing Units | 568 | 96.8% |
| Renter-Occupied Housing Units | 19 | 3.2% |
| Total Occupied Housing Units | 587 | 100.0% |
Occupancy by Household Size in Green Valley CDP Solano County
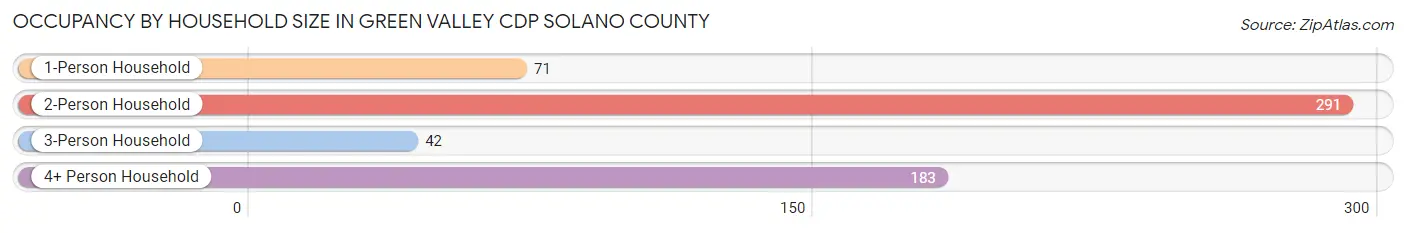
| Household Size | # Housing Units | % Housing Units |
| 1-Person Household | 71 | 12.1% |
| 2-Person Household | 291 | 49.6% |
| 3-Person Household | 42 | 7.2% |
| 4+ Person Household | 183 | 31.2% |
| Total Housing Units | 587 | 100.0% |
Occupancy by Ownership by Household Size in Green Valley CDP Solano County
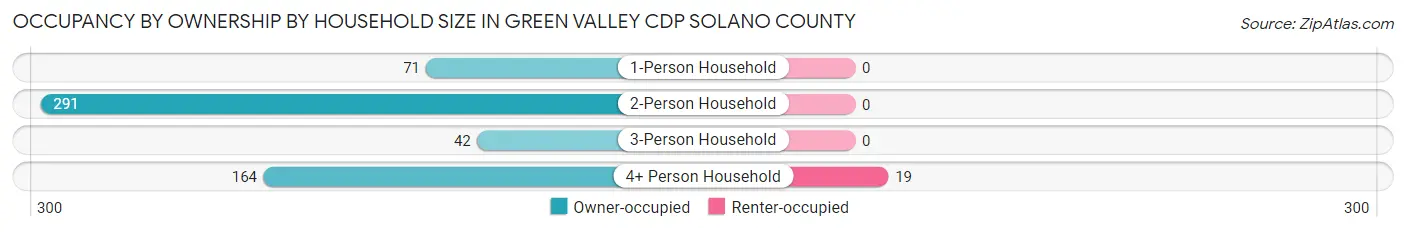
| Household Size | Owner-occupied | Renter-occupied |
| 1-Person Household | 71 (100.0%) | 0 (0.0%) |
| 2-Person Household | 291 (100.0%) | 0 (0.0%) |
| 3-Person Household | 42 (100.0%) | 0 (0.0%) |
| 4+ Person Household | 164 (89.6%) | 19 (10.4%) |
| Total Housing Units | 568 (96.8%) | 19 (3.2%) |
Occupancy by Educational Attainment in Green Valley CDP Solano County
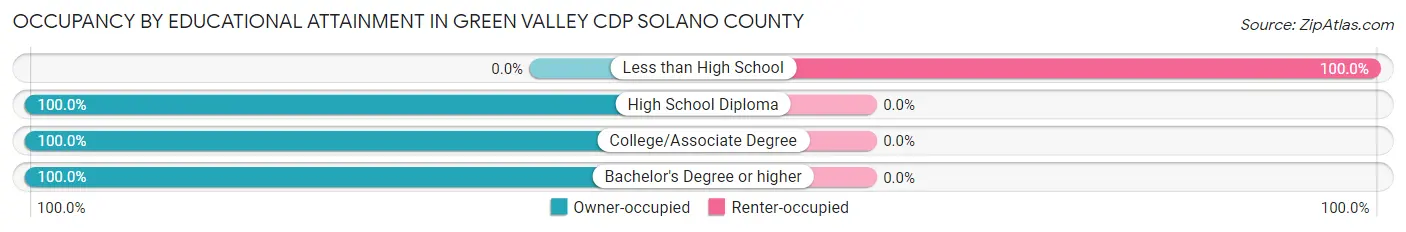
| Household Size | Owner-occupied | Renter-occupied |
| Less than High School | 0 (0.0%) | 19 (100.0%) |
| High School Diploma | 63 (100.0%) | 0 (0.0%) |
| College/Associate Degree | 160 (100.0%) | 0 (0.0%) |
| Bachelor's Degree or higher | 345 (100.0%) | 0 (0.0%) |
Occupancy by Age of Householder in Green Valley CDP Solano County
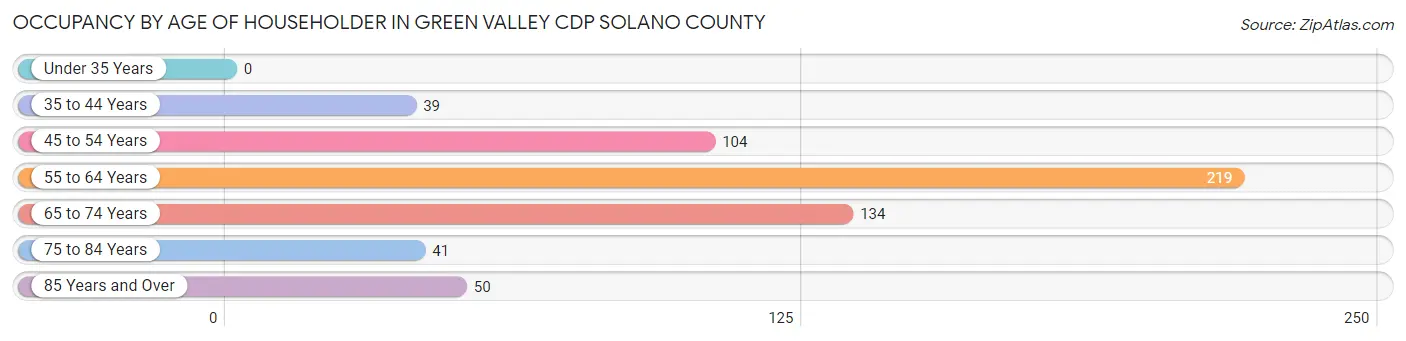
| Age Bracket | # Households | % Households |
| Under 35 Years | 0 | 0.0% |
| 35 to 44 Years | 39 | 6.6% |
| 45 to 54 Years | 104 | 17.7% |
| 55 to 64 Years | 219 | 37.3% |
| 65 to 74 Years | 134 | 22.8% |
| 75 to 84 Years | 41 | 7.0% |
| 85 Years and Over | 50 | 8.5% |
| Total | 587 | 100.0% |
Housing Finances in Green Valley CDP Solano County
Median Income by Occupancy in Green Valley CDP Solano County
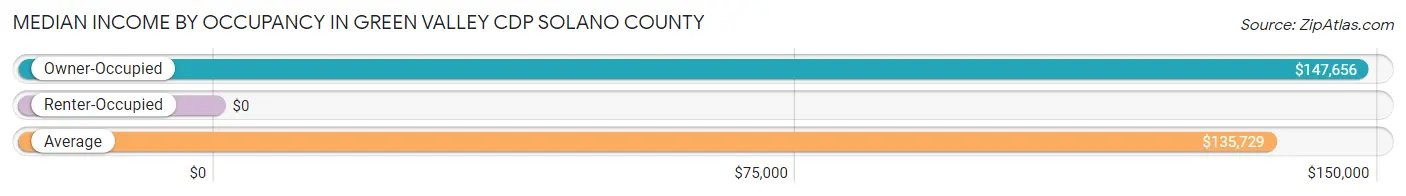
| Occupancy Type | # Households | Median Income |
| Owner-Occupied | 568 (96.8%) | $147,656 |
| Renter-Occupied | 19 (3.2%) | $0 |
| Average | 587 (100.0%) | $135,729 |
Occupancy by Householder Income Bracket in Green Valley CDP Solano County
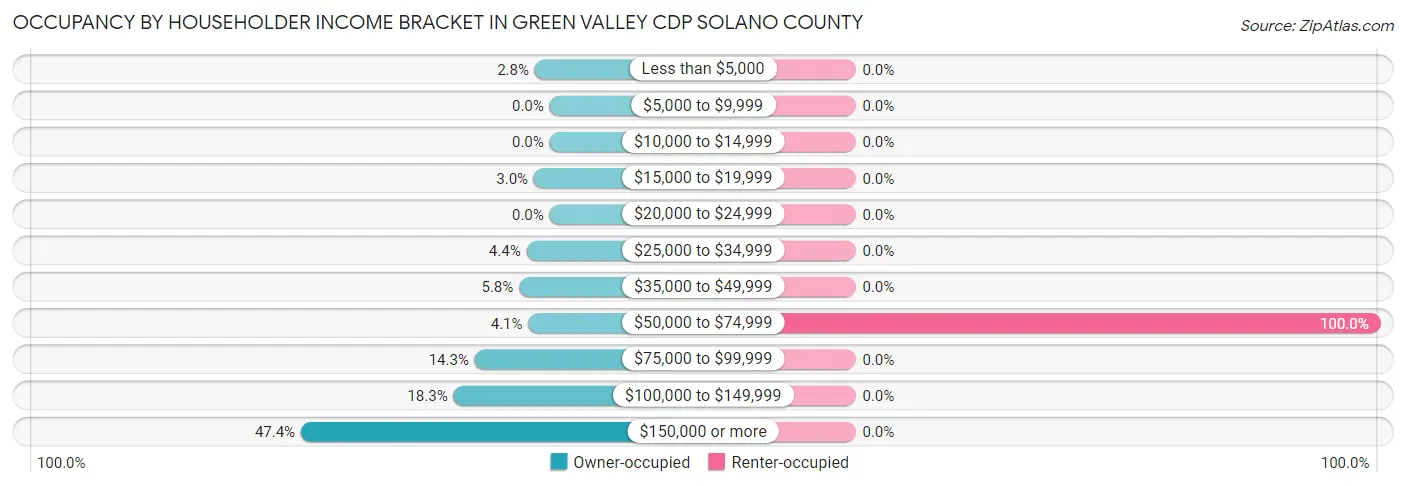
| Income Bracket | Owner-occupied | Renter-occupied |
| Less than $5,000 | 16 (2.8%) | 0 (0.0%) |
| $5,000 to $9,999 | 0 (0.0%) | 0 (0.0%) |
| $10,000 to $14,999 | 0 (0.0%) | 0 (0.0%) |
| $15,000 to $19,999 | 17 (3.0%) | 0 (0.0%) |
| $20,000 to $24,999 | 0 (0.0%) | 0 (0.0%) |
| $25,000 to $34,999 | 25 (4.4%) | 0 (0.0%) |
| $35,000 to $49,999 | 33 (5.8%) | 0 (0.0%) |
| $50,000 to $74,999 | 23 (4.1%) | 19 (100.0%) |
| $75,000 to $99,999 | 81 (14.3%) | 0 (0.0%) |
| $100,000 to $149,999 | 104 (18.3%) | 0 (0.0%) |
| $150,000 or more | 269 (47.4%) | 0 (0.0%) |
| Total | 568 (100.0%) | 19 (100.0%) |
Monthly Housing Cost Tiers in Green Valley CDP Solano County
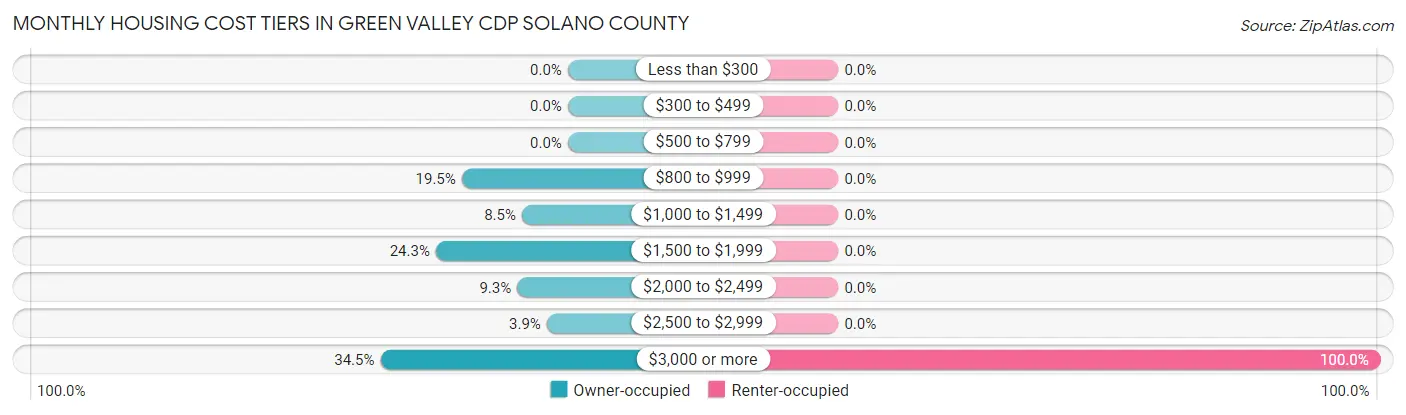
| Monthly Cost | Owner-occupied | Renter-occupied |
| Less than $300 | 0 (0.0%) | 0 (0.0%) |
| $300 to $499 | 0 (0.0%) | 0 (0.0%) |
| $500 to $799 | 0 (0.0%) | 0 (0.0%) |
| $800 to $999 | 111 (19.5%) | 0 (0.0%) |
| $1,000 to $1,499 | 48 (8.5%) | 0 (0.0%) |
| $1,500 to $1,999 | 138 (24.3%) | 0 (0.0%) |
| $2,000 to $2,499 | 53 (9.3%) | 0 (0.0%) |
| $2,500 to $2,999 | 22 (3.9%) | 0 (0.0%) |
| $3,000 or more | 196 (34.5%) | 19 (100.0%) |
| Total | 568 (100.0%) | 19 (100.0%) |
Physical Housing Characteristics in Green Valley CDP Solano County
Housing Structures in Green Valley CDP Solano County
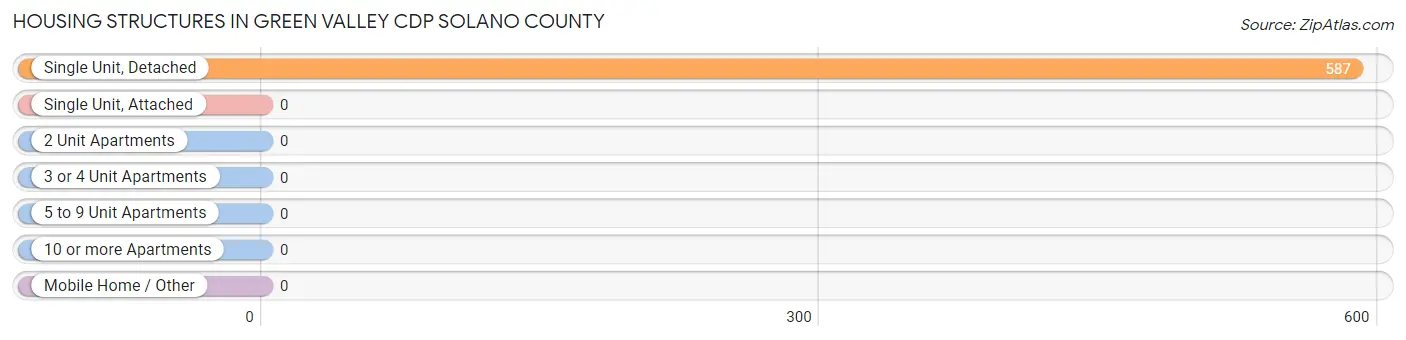
| Structure Type | # Housing Units | % Housing Units |
| Single Unit, Detached | 587 | 100.0% |
| Single Unit, Attached | 0 | 0.0% |
| 2 Unit Apartments | 0 | 0.0% |
| 3 or 4 Unit Apartments | 0 | 0.0% |
| 5 to 9 Unit Apartments | 0 | 0.0% |
| 10 or more Apartments | 0 | 0.0% |
| Mobile Home / Other | 0 | 0.0% |
| Total | 587 | 100.0% |
Housing Structures by Occupancy in Green Valley CDP Solano County
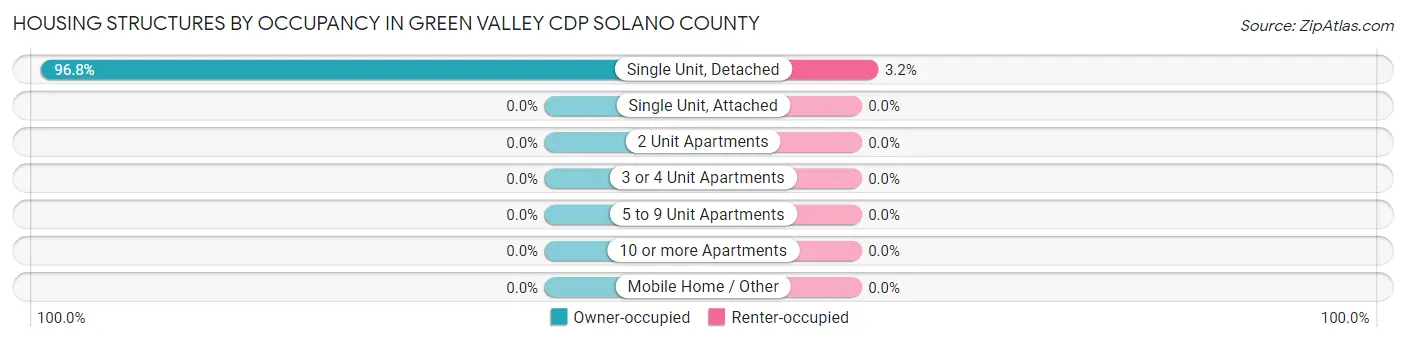
| Structure Type | Owner-occupied | Renter-occupied |
| Single Unit, Detached | 568 (96.8%) | 19 (3.2%) |
| Single Unit, Attached | 0 (0.0%) | 0 (0.0%) |
| 2 Unit Apartments | 0 (0.0%) | 0 (0.0%) |
| 3 or 4 Unit Apartments | 0 (0.0%) | 0 (0.0%) |
| 5 to 9 Unit Apartments | 0 (0.0%) | 0 (0.0%) |
| 10 or more Apartments | 0 (0.0%) | 0 (0.0%) |
| Mobile Home / Other | 0 (0.0%) | 0 (0.0%) |
| Total | 568 (96.8%) | 19 (3.2%) |
Housing Structures by Number of Rooms in Green Valley CDP Solano County
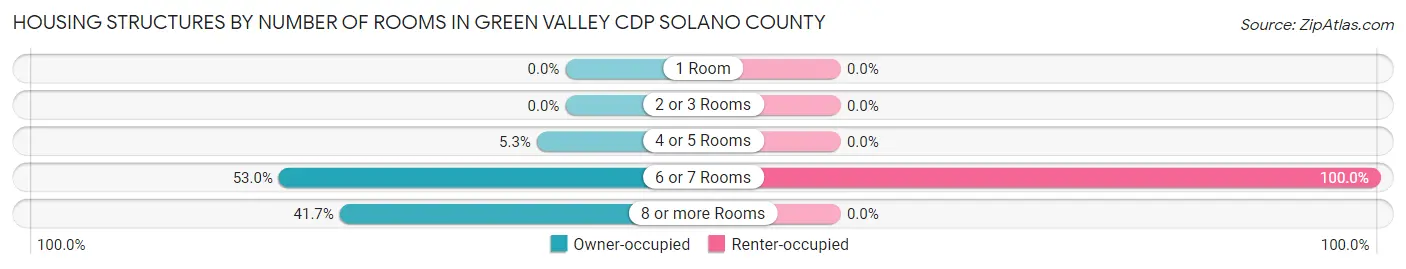
| Number of Rooms | Owner-occupied | Renter-occupied |
| 1 Room | 0 (0.0%) | 0 (0.0%) |
| 2 or 3 Rooms | 0 (0.0%) | 0 (0.0%) |
| 4 or 5 Rooms | 30 (5.3%) | 0 (0.0%) |
| 6 or 7 Rooms | 301 (53.0%) | 19 (100.0%) |
| 8 or more Rooms | 237 (41.7%) | 0 (0.0%) |
| Total | 568 (100.0%) | 19 (100.0%) |
Housing Structure by Heating Type in Green Valley CDP Solano County
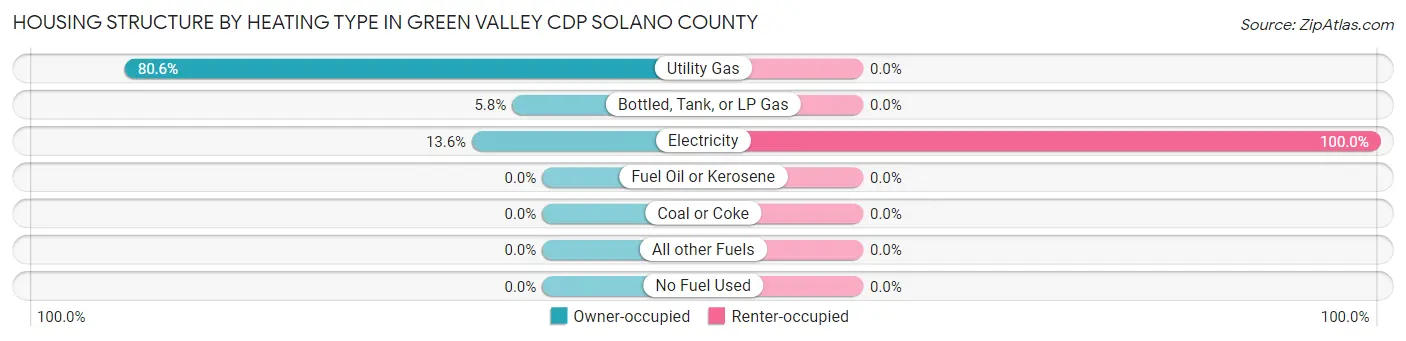
| Heating Type | Owner-occupied | Renter-occupied |
| Utility Gas | 458 (80.6%) | 0 (0.0%) |
| Bottled, Tank, or LP Gas | 33 (5.8%) | 0 (0.0%) |
| Electricity | 77 (13.6%) | 19 (100.0%) |
| Fuel Oil or Kerosene | 0 (0.0%) | 0 (0.0%) |
| Coal or Coke | 0 (0.0%) | 0 (0.0%) |
| All other Fuels | 0 (0.0%) | 0 (0.0%) |
| No Fuel Used | 0 (0.0%) | 0 (0.0%) |
| Total | 568 (100.0%) | 19 (100.0%) |
Household Vehicle Usage in Green Valley CDP Solano County
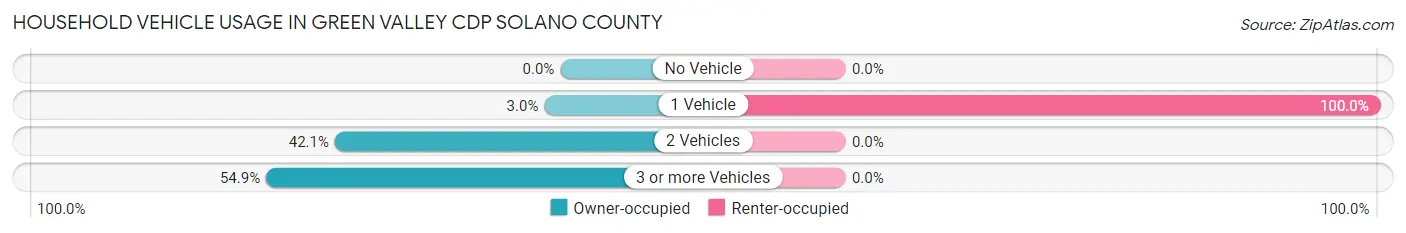
| Vehicles per Household | Owner-occupied | Renter-occupied |
| No Vehicle | 0 (0.0%) | 0 (0.0%) |
| 1 Vehicle | 17 (3.0%) | 19 (100.0%) |
| 2 Vehicles | 239 (42.1%) | 0 (0.0%) |
| 3 or more Vehicles | 312 (54.9%) | 0 (0.0%) |
| Total | 568 (100.0%) | 19 (100.0%) |
Real Estate & Mortgages in Green Valley CDP Solano County
Real Estate and Mortgage Overview in Green Valley CDP Solano County
| Characteristic | Without Mortgage | With Mortgage |
| Housing Units | 254 | 314 |
| Median Property Value | $1,081,200 | $1,147,200 |
| Median Household Income | - | - |
| Monthly Housing Costs | $1,243 | $196 |
| Real Estate Taxes | $5,698 | $0 |
Property Value by Mortgage Status in Green Valley CDP Solano County
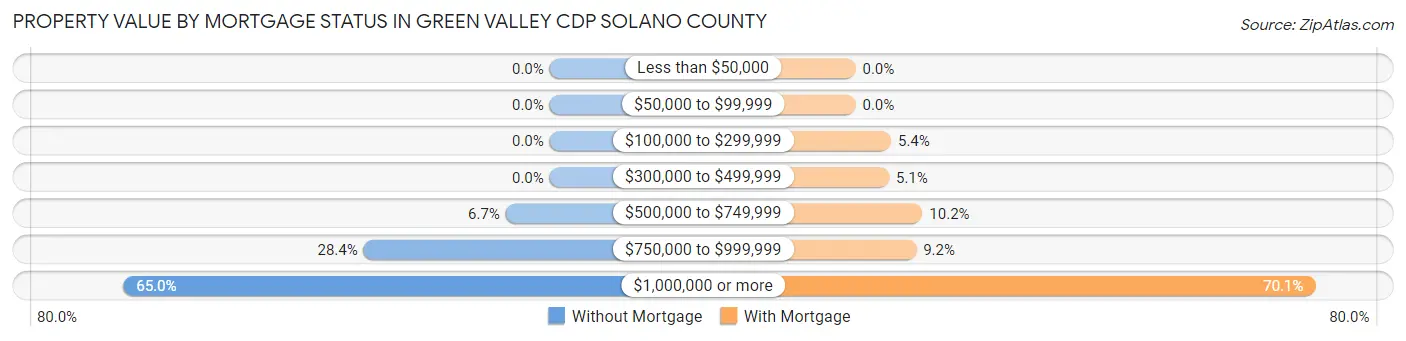
| Property Value | Without Mortgage | With Mortgage |
| Less than $50,000 | 0 (0.0%) | 0 (0.0%) |
| $50,000 to $99,999 | 0 (0.0%) | 0 (0.0%) |
| $100,000 to $299,999 | 0 (0.0%) | 17 (5.4%) |
| $300,000 to $499,999 | 0 (0.0%) | 16 (5.1%) |
| $500,000 to $749,999 | 17 (6.7%) | 32 (10.2%) |
| $750,000 to $999,999 | 72 (28.3%) | 29 (9.2%) |
| $1,000,000 or more | 165 (65.0%) | 220 (70.1%) |
| Total | 254 (100.0%) | 314 (100.0%) |
Household Income by Mortgage Status in Green Valley CDP Solano County
| Household Income | Without Mortgage | With Mortgage |
| Less than $10,000 | 0 (0.0%) | 16 (5.1%) |
| $10,000 to $24,999 | 17 (6.7%) | 16 (5.1%) |
| $25,000 to $34,999 | 25 (9.8%) | 0 (0.0%) |
| $35,000 to $49,999 | 0 (0.0%) | 0 (0.0%) |
| $50,000 to $74,999 | 23 (9.1%) | 33 (10.5%) |
| $75,000 to $99,999 | 59 (23.2%) | 0 (0.0%) |
| $100,000 to $149,999 | 28 (11.0%) | 22 (7.0%) |
| $150,000 or more | 102 (40.2%) | 76 (24.2%) |
| Total | 254 (100.0%) | 314 (100.0%) |
Property Value to Household Income Ratio in Green Valley CDP Solano County
| Value-to-Income Ratio | Without Mortgage | With Mortgage |
| Less than 2.0x | 32 (12.6%) | 155,926 (49,658.0%) |
| 2.0x to 2.9x | 0 (0.0%) | 25 (8.0%) |
| 3.0x to 3.9x | 28 (11.0%) | 24 (7.6%) |
| 4.0x or more | 194 (76.4%) | 41 (13.1%) |
| Total | 254 (100.0%) | 314 (100.0%) |
Real Estate Taxes by Mortgage Status in Green Valley CDP Solano County
| Property Taxes | Without Mortgage | With Mortgage |
| Less than $800 | 0 (0.0%) | 16 (5.1%) |
| $800 to $1,499 | 0 (0.0%) | 0 (0.0%) |
| $800 to $1,499 | 254 (100.0%) | 0 (0.0%) |
| Total | 254 (100.0%) | 314 (100.0%) |
Health & Disability in Green Valley CDP Solano County
Health Insurance Coverage by Age in Green Valley CDP Solano County
| Age Bracket | With Coverage | Without Coverage |
| Under 6 Years | 94 (100.0%) | 0 (0.0%) |
| 6 to 18 Years | 131 (100.0%) | 0 (0.0%) |
| 19 to 25 Years | 22 (100.0%) | 0 (0.0%) |
| 26 to 34 Years | 164 (100.0%) | 0 (0.0%) |
| 35 to 44 Years | 55 (100.0%) | 0 (0.0%) |
| 45 to 54 Years | 192 (100.0%) | 0 (0.0%) |
| 55 to 64 Years | 418 (100.0%) | 0 (0.0%) |
| 65 to 74 Years | 350 (100.0%) | 0 (0.0%) |
| 75 Years and older | 160 (100.0%) | 0 (0.0%) |
| Total | 1,586 (100.0%) | 0 (0.0%) |
Health Insurance Coverage by Citizenship Status in Green Valley CDP Solano County
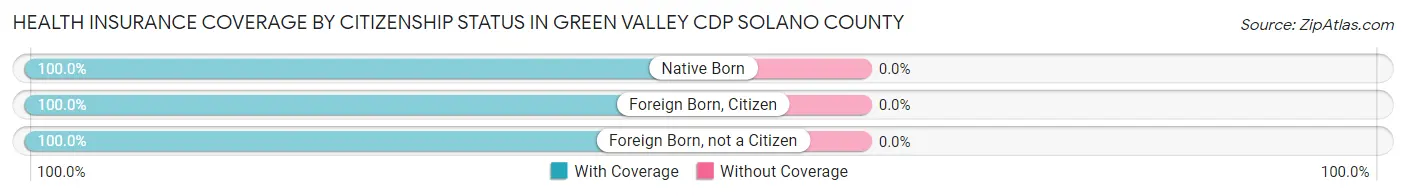
| Citizenship Status | With Coverage | Without Coverage |
| Native Born | 94 (100.0%) | 0 (0.0%) |
| Foreign Born, Citizen | 131 (100.0%) | 0 (0.0%) |
| Foreign Born, not a Citizen | 22 (100.0%) | 0 (0.0%) |
Health Insurance Coverage by Household Income in Green Valley CDP Solano County
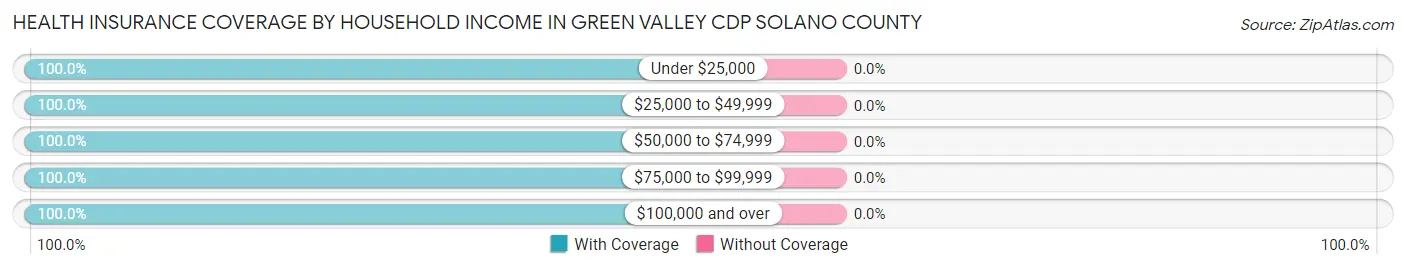
| Household Income | With Coverage | Without Coverage |
| Under $25,000 | 49 (100.0%) | 0 (0.0%) |
| $25,000 to $49,999 | 81 (100.0%) | 0 (0.0%) |
| $50,000 to $74,999 | 116 (100.0%) | 0 (0.0%) |
| $75,000 to $99,999 | 312 (100.0%) | 0 (0.0%) |
| $100,000 and over | 1,028 (100.0%) | 0 (0.0%) |
Public vs Private Health Insurance Coverage by Age in Green Valley CDP Solano County
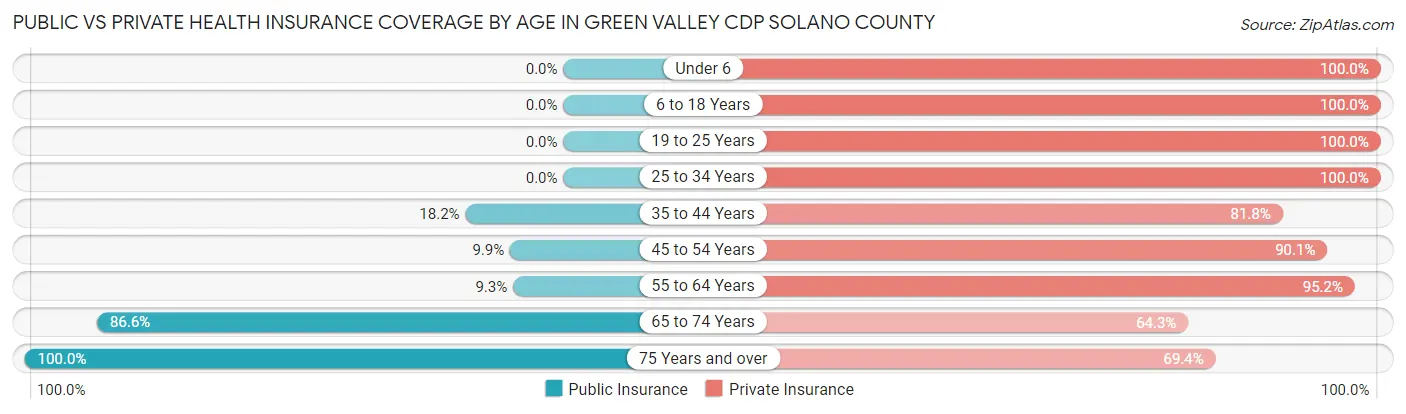
| Age Bracket | Public Insurance | Private Insurance |
| Under 6 | 0 (0.0%) | 94 (100.0%) |
| 6 to 18 Years | 0 (0.0%) | 131 (100.0%) |
| 19 to 25 Years | 0 (0.0%) | 22 (100.0%) |
| 25 to 34 Years | 0 (0.0%) | 164 (100.0%) |
| 35 to 44 Years | 10 (18.2%) | 45 (81.8%) |
| 45 to 54 Years | 19 (9.9%) | 173 (90.1%) |
| 55 to 64 Years | 39 (9.3%) | 398 (95.2%) |
| 65 to 74 Years | 303 (86.6%) | 225 (64.3%) |
| 75 Years and over | 160 (100.0%) | 111 (69.4%) |
| Total | 531 (33.5%) | 1,363 (85.9%) |
Disability Status by Sex by Age in Green Valley CDP Solano County
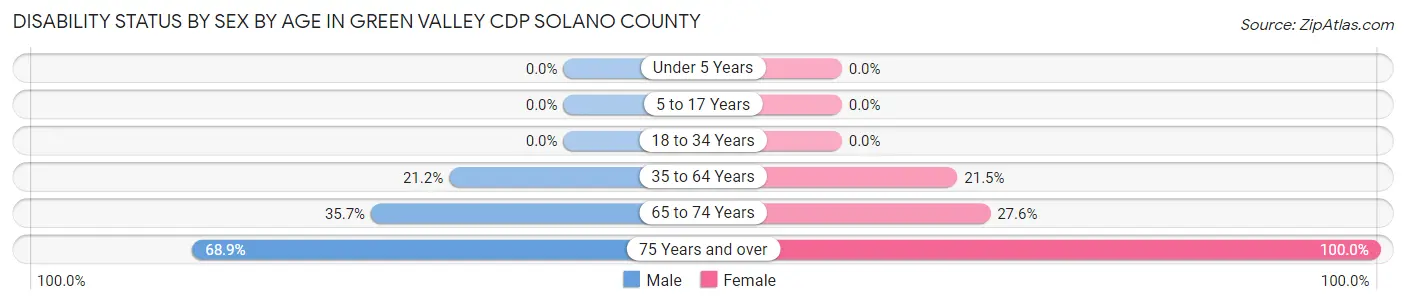
| Age Bracket | Male | Female |
| Under 5 Years | 0 (0.0%) | 0 (0.0%) |
| 5 to 17 Years | 0 (0.0%) | 0 (0.0%) |
| 18 to 34 Years | 0 (0.0%) | 0 (0.0%) |
| 35 to 64 Years | 62 (21.2%) | 80 (21.4%) |
| 65 to 74 Years | 55 (35.7%) | 54 (27.6%) |
| 75 Years and over | 73 (68.9%) | 54 (100.0%) |
Disability Class by Sex by Age in Green Valley CDP Solano County
Disability Class: Hearing Difficulty
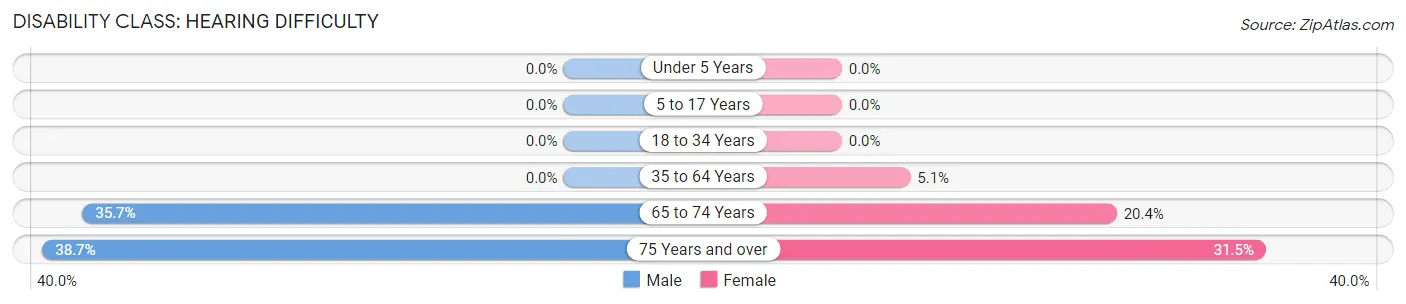
| Age Bracket | Male | Female |
| Under 5 Years | 0 (0.0%) | 0 (0.0%) |
| 5 to 17 Years | 0 (0.0%) | 0 (0.0%) |
| 18 to 34 Years | 0 (0.0%) | 0 (0.0%) |
| 35 to 64 Years | 0 (0.0%) | 19 (5.1%) |
| 65 to 74 Years | 55 (35.7%) | 40 (20.4%) |
| 75 Years and over | 41 (38.7%) | 17 (31.5%) |
Disability Class: Vision Difficulty
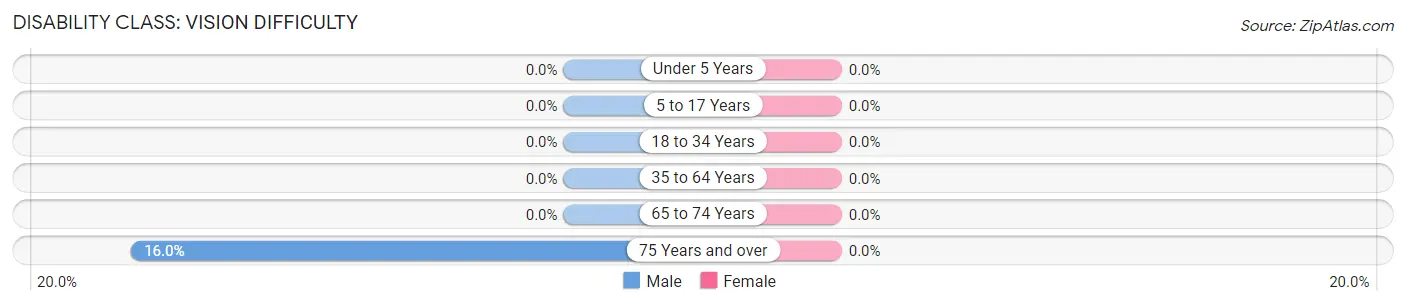
| Age Bracket | Male | Female |
| Under 5 Years | 0 (0.0%) | 0 (0.0%) |
| 5 to 17 Years | 0 (0.0%) | 0 (0.0%) |
| 18 to 34 Years | 0 (0.0%) | 0 (0.0%) |
| 35 to 64 Years | 0 (0.0%) | 0 (0.0%) |
| 65 to 74 Years | 0 (0.0%) | 0 (0.0%) |
| 75 Years and over | 17 (16.0%) | 0 (0.0%) |
Disability Class: Cognitive Difficulty
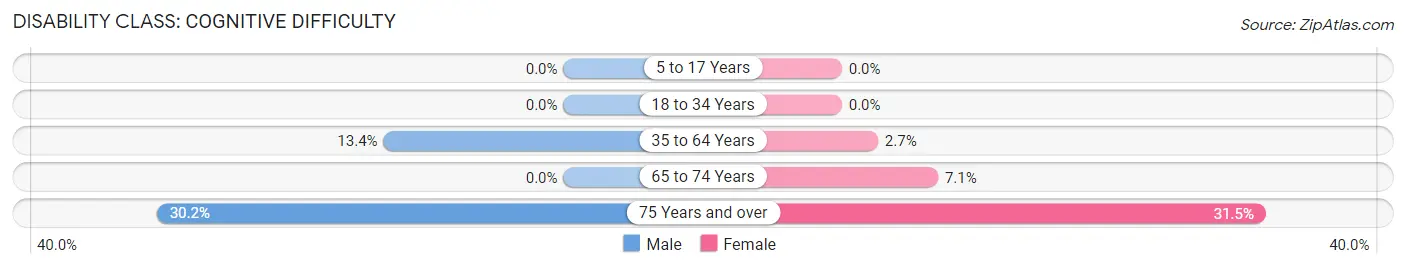
| Age Bracket | Male | Female |
| 5 to 17 Years | 0 (0.0%) | 0 (0.0%) |
| 18 to 34 Years | 0 (0.0%) | 0 (0.0%) |
| 35 to 64 Years | 39 (13.4%) | 10 (2.7%) |
| 65 to 74 Years | 0 (0.0%) | 14 (7.1%) |
| 75 Years and over | 32 (30.2%) | 17 (31.5%) |
Disability Class: Ambulatory Difficulty
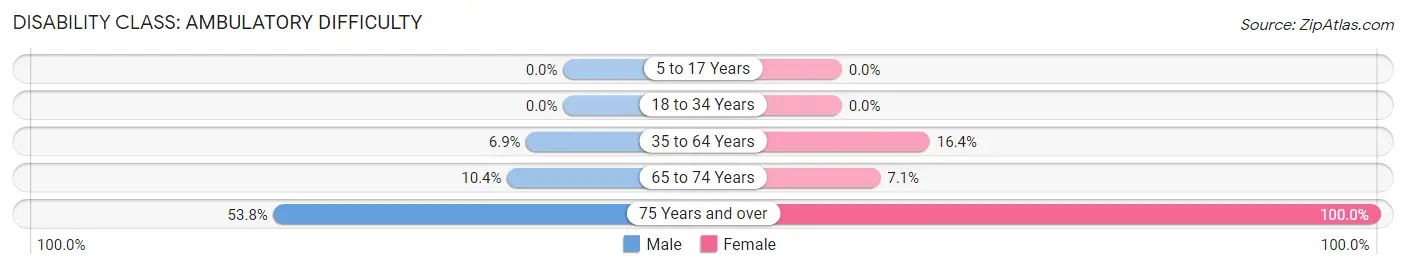
| Age Bracket | Male | Female |
| 5 to 17 Years | 0 (0.0%) | 0 (0.0%) |
| 18 to 34 Years | 0 (0.0%) | 0 (0.0%) |
| 35 to 64 Years | 20 (6.9%) | 61 (16.4%) |
| 65 to 74 Years | 16 (10.4%) | 14 (7.1%) |
| 75 Years and over | 57 (53.8%) | 54 (100.0%) |
Disability Class: Self-Care Difficulty
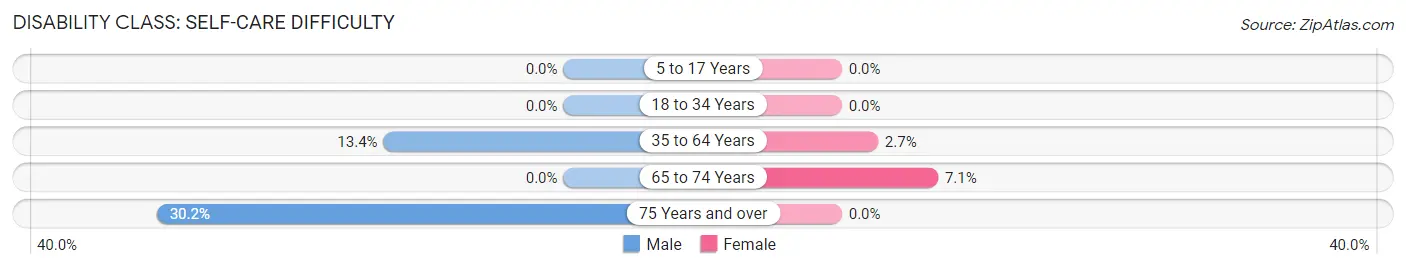
| Age Bracket | Male | Female |
| 5 to 17 Years | 0 (0.0%) | 0 (0.0%) |
| 18 to 34 Years | 0 (0.0%) | 0 (0.0%) |
| 35 to 64 Years | 39 (13.4%) | 10 (2.7%) |
| 65 to 74 Years | 0 (0.0%) | 14 (7.1%) |
| 75 Years and over | 32 (30.2%) | 0 (0.0%) |
Technology Access in Green Valley CDP Solano County
Computing Device Access in Green Valley CDP Solano County
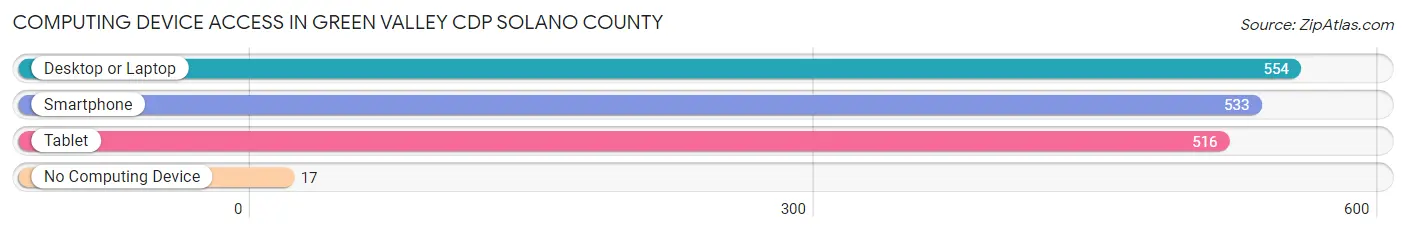
| Device Type | # Households | % Households |
| Desktop or Laptop | 554 | 94.4% |
| Smartphone | 533 | 90.8% |
| Tablet | 516 | 87.9% |
| No Computing Device | 17 | 2.9% |
| Total | 587 | 100.0% |
Internet Access in Green Valley CDP Solano County
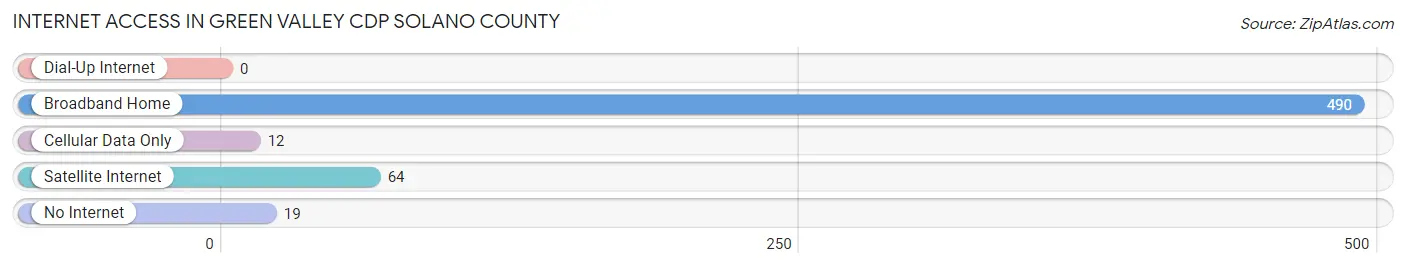
| Internet Type | # Households | % Households |
| Dial-Up Internet | 0 | 0.0% |
| Broadband Home | 490 | 83.5% |
| Cellular Data Only | 12 | 2.0% |
| Satellite Internet | 64 | 10.9% |
| No Internet | 19 | 3.2% |
| Total | 587 | 100.0% |
Green Valley CDP Solano County Summary
History
The history of Green Valley CDP, Solano County, California dates back to the mid-1800s when the area was first settled by European immigrants. The area was originally part of the Rancho Suisun Mexican land grant, which was granted to the Suisun Indians in 1843. The area was then divided into several smaller parcels and sold to settlers in the 1850s. The first settlers in the area were mostly farmers and ranchers who grew wheat, barley, and other crops.
The area was officially incorporated as the Green Valley CDP in 1891. The name was chosen to reflect the lush green landscape of the area. The area was primarily agricultural until the 1950s when the population began to grow rapidly due to the influx of people from the Bay Area. This growth was fueled by the construction of the nearby Travis Air Force Base, which brought many new jobs to the area.
The population of Green Valley CDP continued to grow throughout the 1960s and 1970s, and by the 1980s the area had become a popular destination for commuters from the Bay Area. The population peaked in the 1990s and has since stabilized.
Geography
Green Valley CDP is located in Solano County, California, approximately 30 miles northeast of San Francisco. The area is situated in the Suisun Valley, which is part of the larger Sacramento Valley. The area is characterized by rolling hills and lush green valleys, and is home to several small lakes and streams.
The climate in Green Valley CDP is mild and temperate, with average temperatures ranging from the mid-50s in the winter to the mid-80s in the summer. The area receives an average of 20 inches of rain per year, and is generally sunny and dry during the summer months.
Economy
The economy of Green Valley CDP is primarily driven by agriculture and tourism. The area is home to several wineries and vineyards, as well as a number of small farms and ranches. The area is also home to several small businesses, including restaurants, retail stores, and professional services.
The area is also home to Travis Air Force Base, which is the largest employer in the area. The base provides a significant number of jobs to the local economy, and is a major contributor to the area’s economic growth.
Demographics
As of the 2010 census, the population of Green Valley CDP was 8,845. The population is primarily white (77.3%), followed by Hispanic or Latino (14.2%), Asian (4.2%), and African American (2.2%). The median household income in the area is $68,845, and the median home value is $346,400.
The area is served by the Solano County Office of Education, which provides public education to the area’s students. The area is also home to several private schools, including Green Valley Christian Academy and Solano Christian Academy.
Conclusion
Green Valley CDP is a small community located in Solano County, California. The area is characterized by rolling hills and lush green valleys, and is home to several wineries and vineyards, as well as a number of small businesses. The area is also home to Travis Air Force Base, which is the largest employer in the area. The population of Green Valley CDP is primarily white, followed by Hispanic or Latino, Asian, and African American. The median household income in the area is $68,845, and the median home value is $346,400.
Common Questions
What is Per Capita Income in Green Valley CDP Solano County?
Per Capita income in Green Valley CDP Solano County is $73,532.
What is the Median Family Income in Green Valley CDP Solano County?
Median Family Income in Green Valley CDP Solano County is $164,125.
What is the Median Household income in Green Valley CDP Solano County?
Median Household Income in Green Valley CDP Solano County is $135,729.
What is Inequality or Gini Index in Green Valley CDP Solano County?
Inequality or Gini Index in Green Valley CDP Solano County is 0.47.
What is the Total Population of Green Valley CDP Solano County?
Total Population of Green Valley CDP Solano County is 1,586.
What is the Total Male Population of Green Valley CDP Solano County?
Total Male Population of Green Valley CDP Solano County is 707.
What is the Total Female Population of Green Valley CDP Solano County?
Total Female Population of Green Valley CDP Solano County is 879.
What is the Ratio of Males per 100 Females in Green Valley CDP Solano County?
There are 80.43 Males per 100 Females in Green Valley CDP Solano County.
What is the Ratio of Females per 100 Males in Green Valley CDP Solano County?
There are 124.33 Females per 100 Males in Green Valley CDP Solano County.
What is the Median Population Age in Green Valley CDP Solano County?
Median Population Age in Green Valley CDP Solano County is 58.8 Years.
What is the Average Family Size in Green Valley CDP Solano County
Average Family Size in Green Valley CDP Solano County is 2.9 People.
What is the Average Household Size in Green Valley CDP Solano County
Average Household Size in Green Valley CDP Solano County is 2.7 People.
How Large is the Labor Force in Green Valley CDP Solano County?
There are 758 People in the Labor Forcein in Green Valley CDP Solano County.
What is the Percentage of People in the Labor Force in Green Valley CDP Solano County?
54.3% of People are in the Labor Force in Green Valley CDP Solano County.