Zip Codes with the Highest Percentage of Population Employed in Real Estate, Rental & Leasing in Danville, CA
RELATED REPORTS & OPTIONS
Real Estate, Rental & Leasing
Danville
Compare Zip Codes
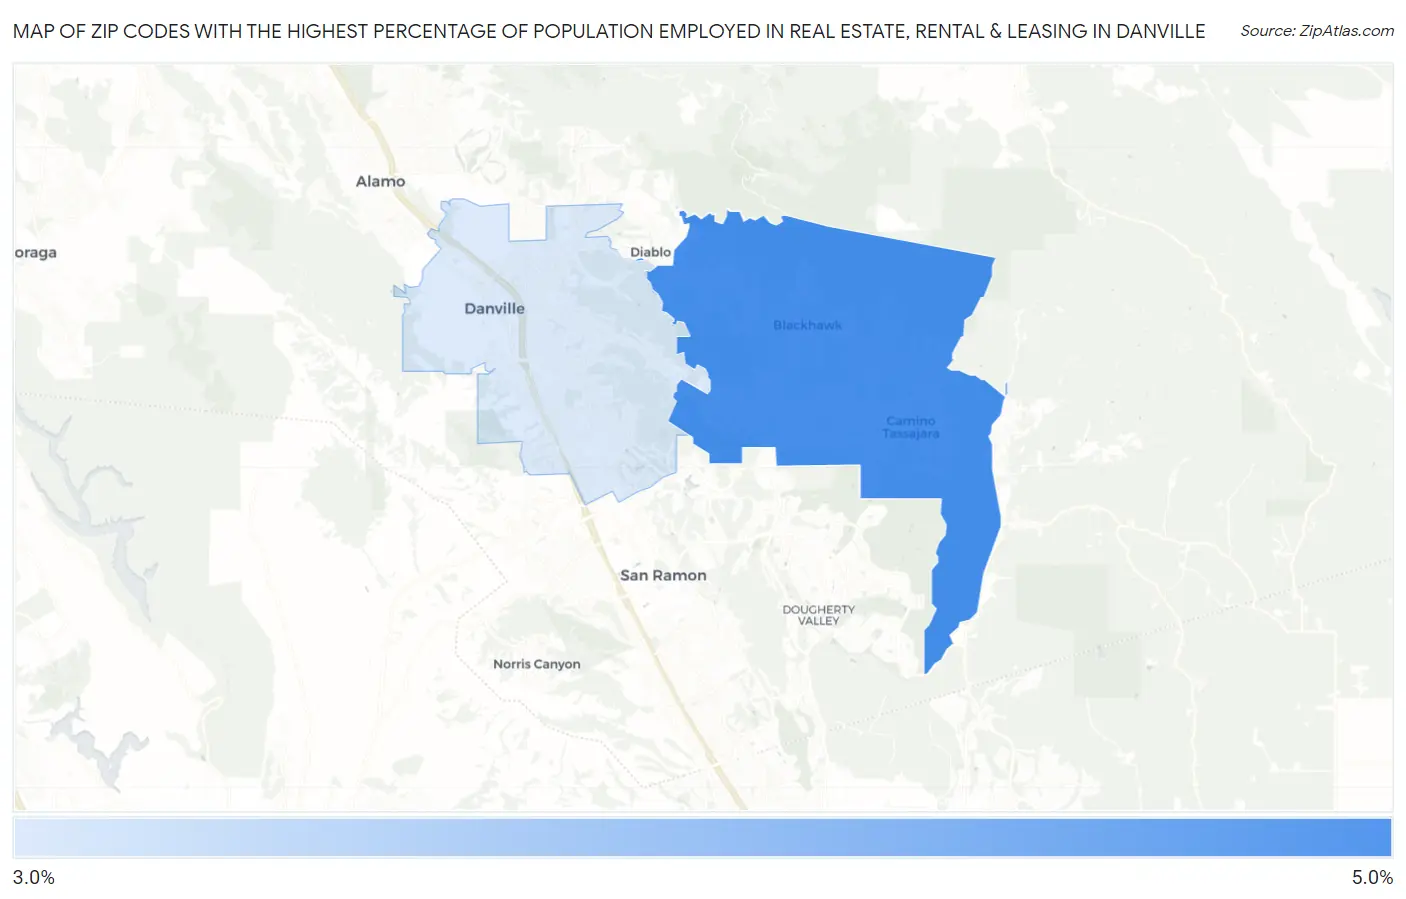
Map of Zip Codes with the Highest Percentage of Population Employed in Real Estate, Rental & Leasing in Danville
3.9%
4.3%
Zip Codes with the Highest Percentage of Population Employed in Real Estate, Rental & Leasing in Danville, CA
| Zip Code | % Employed | vs State | vs National | |
| 1. | 94506 | 4.3% | 2.1%(+2.23)#161 | 1.9%(+2.46)#1,831 |
| 2. | 94526 | 3.9% | 2.1%(+1.74)#206 | 1.9%(+1.96)#2,324 |
1
Common Questions
What are the Top Zip Codes with the Highest Percentage of Population Employed in Real Estate, Rental & Leasing in Danville, CA?
Top Zip Codes with the Highest Percentage of Population Employed in Real Estate, Rental & Leasing in Danville, CA are:
What zip code has the Highest Percentage of Population Employed in Real Estate, Rental & Leasing in Danville, CA?
94506 has the Highest Percentage of Population Employed in Real Estate, Rental & Leasing in Danville, CA with 4.3%.
What is the Percentage of Population Employed in Real Estate, Rental & Leasing in Danville, CA?
Percentage of Population Employed in Real Estate, Rental & Leasing in Danville is 3.7%.
What is the Percentage of Population Employed in Real Estate, Rental & Leasing in California?
Percentage of Population Employed in Real Estate, Rental & Leasing in California is 2.1%.
What is the Percentage of Population Employed in Real Estate, Rental & Leasing in the United States?
Percentage of Population Employed in Real Estate, Rental & Leasing in the United States is 1.9%.