Cities with the Highest Percentage of Population Employed in Real Estate, Rental & Leasing in Texas
RELATED REPORTS & OPTIONS
Real Estate, Rental & Leasing
Texas
Compare Cities
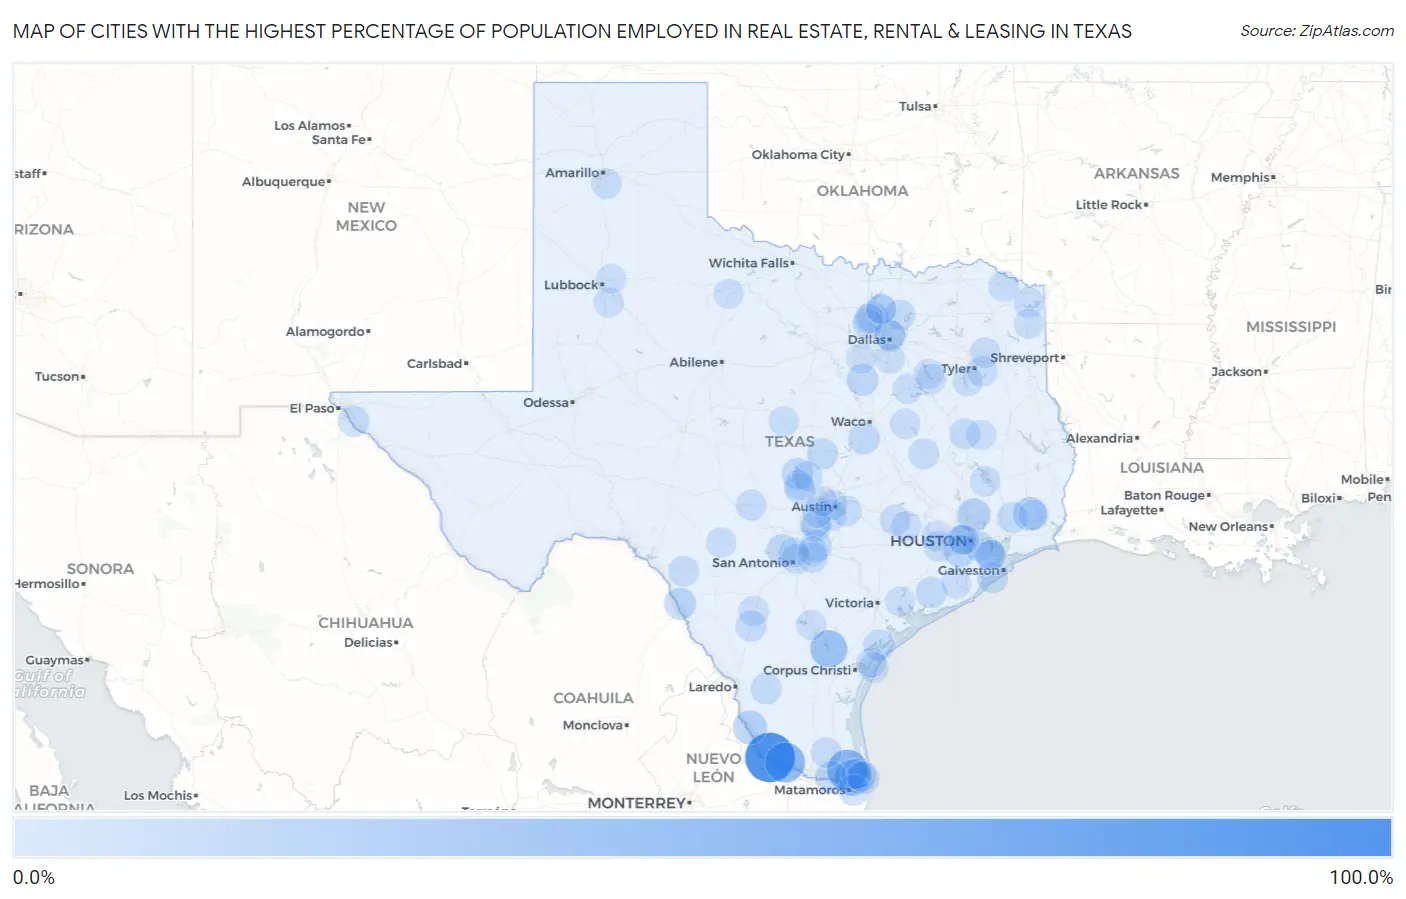
Map of Cities with the Highest Percentage of Population Employed in Real Estate, Rental & Leasing in Texas
0.0%
100.0%
Cities with the Highest Percentage of Population Employed in Real Estate, Rental & Leasing in Texas
| City | % Employed | vs State | vs National | |
| 1. | Los Alvarez | 100.0% | 2.0%(+98.0)#1 | 1.9%(+98.1)#1 |
| 2. | Lozano | 55.5% | 2.0%(+53.5)#2 | 1.9%(+53.6)#17 |
| 3. | Villarreal | 52.2% | 2.0%(+50.2)#3 | 1.9%(+50.3)#21 |
| 4. | Edgewater Estates | 38.1% | 2.0%(+36.1)#4 | 1.9%(+36.2)#46 |
| 5. | Orason | 34.0% | 2.0%(+32.0)#5 | 1.9%(+32.1)#55 |
| 6. | Falcon Lake Estates | 23.0% | 2.0%(+21.0)#6 | 1.9%(+21.1)#120 |
| 7. | Pinewood Estates | 21.8% | 2.0%(+19.8)#7 | 1.9%(+19.9)#130 |
| 8. | Porter Heights | 20.8% | 2.0%(+18.8)#8 | 1.9%(+18.9)#144 |
| 9. | Bluetown | 16.4% | 2.0%(+14.4)#9 | 1.9%(+14.5)#209 |
| 10. | Fifth Street | 16.3% | 2.0%(+14.3)#10 | 1.9%(+14.4)#211 |
| 11. | Elm Creek | 14.7% | 2.0%(+12.7)#11 | 1.9%(+12.8)#257 |
| 12. | Grey Forest | 14.0% | 2.0%(+12.0)#12 | 1.9%(+12.1)#278 |
| 13. | Covington | 13.9% | 2.0%(+11.9)#13 | 1.9%(+12.0)#282 |
| 14. | Copper Canyon | 13.1% | 2.0%(+11.0)#14 | 1.9%(+11.2)#311 |
| 15. | Buchanan Dam | 13.0% | 2.0%(+11.0)#15 | 1.9%(+11.1)#313 |
| 16. | Laguna Heights | 12.9% | 2.0%(+10.9)#16 | 1.9%(+11.0)#317 |
| 17. | Lake Dunlap | 12.3% | 2.0%(+10.3)#17 | 1.9%(+10.4)#360 |
| 18. | Markham | 12.1% | 2.0%(+10.1)#18 | 1.9%(+10.2)#371 |
| 19. | Grangerland | 12.1% | 2.0%(+10.1)#19 | 1.9%(+10.2)#372 |
| 20. | Villa Pancho | 11.7% | 2.0%(+9.67)#20 | 1.9%(+9.78)#397 |
| 21. | Double Horn | 11.7% | 2.0%(+9.66)#21 | 1.9%(+9.77)#400 |
| 22. | Wadsworth | 11.5% | 2.0%(+9.50)#22 | 1.9%(+9.61)#412 |
| 23. | Jamaica Beach | 11.5% | 2.0%(+9.46)#23 | 1.9%(+9.58)#415 |
| 24. | Morning Glory | 11.4% | 2.0%(+9.41)#24 | 1.9%(+9.52)#418 |
| 25. | Oilton | 11.3% | 2.0%(+9.28)#25 | 1.9%(+9.40)#425 |
| 26. | Kempner | 11.1% | 2.0%(+9.09)#26 | 1.9%(+9.20)#438 |
| 27. | Bruceville Eddy | 11.1% | 2.0%(+9.07)#27 | 1.9%(+9.19)#439 |
| 28. | Lamar | 10.9% | 2.0%(+8.92)#28 | 1.9%(+9.04)#450 |
| 29. | Cotulla | 10.6% | 2.0%(+8.55)#29 | 1.9%(+8.67)#482 |
| 30. | Daisetta | 10.1% | 2.0%(+8.10)#30 | 1.9%(+8.21)#524 |
| 31. | San Leanna | 10.0% | 2.0%(+7.95)#31 | 1.9%(+8.06)#543 |
| 32. | Latexo | 9.6% | 2.0%(+7.55)#32 | 1.9%(+7.67)#582 |
| 33. | Horseshoe Bay | 9.5% | 2.0%(+7.51)#33 | 1.9%(+7.62)#591 |
| 34. | Highland Park | 9.5% | 2.0%(+7.47)#34 | 1.9%(+7.58)#592 |
| 35. | Hilltop Lakes | 9.1% | 2.0%(+7.14)#35 | 1.9%(+7.25)#626 |
| 36. | Zuehl | 9.1% | 2.0%(+7.13)#36 | 1.9%(+7.25)#627 |
| 37. | Garfield | 9.0% | 2.0%(+7.04)#37 | 1.9%(+7.16)#648 |
| 38. | Fairview | 8.7% | 2.0%(+6.73)#38 | 1.9%(+6.85)#685 |
| 39. | Woodcreek | 8.7% | 2.0%(+6.72)#39 | 1.9%(+6.84)#687 |
| 40. | Fort Clark Springs | 8.7% | 2.0%(+6.66)#40 | 1.9%(+6.77)#698 |
| 41. | Wimberley | 8.5% | 2.0%(+6.52)#41 | 1.9%(+6.63)#719 |
| 42. | Avery | 8.5% | 2.0%(+6.47)#42 | 1.9%(+6.58)#728 |
| 43. | Weston Lakes | 8.5% | 2.0%(+6.46)#43 | 1.9%(+6.57)#730 |
| 44. | University Park | 8.3% | 2.0%(+6.34)#44 | 1.9%(+6.46)#749 |
| 45. | Harper | 8.3% | 2.0%(+6.31)#45 | 1.9%(+6.42)#758 |
| 46. | Lasara | 8.2% | 2.0%(+6.23)#46 | 1.9%(+6.34)#769 |
| 47. | Round Top | 8.1% | 2.0%(+6.06)#47 | 1.9%(+6.17)#814 |
| 48. | New Chapel Hill | 8.0% | 2.0%(+5.99)#48 | 1.9%(+6.11)#825 |
| 49. | Lake Tanglewood | 8.0% | 2.0%(+5.96)#49 | 1.9%(+6.07)#832 |
| 50. | Hilshire Village | 7.8% | 2.0%(+5.80)#50 | 1.9%(+5.92)#858 |
| 51. | Maud | 7.8% | 2.0%(+5.79)#51 | 1.9%(+5.90)#860 |
| 52. | Mound | 7.8% | 2.0%(+5.74)#52 | 1.9%(+5.86)#869 |
| 53. | Port Aransas | 7.7% | 2.0%(+5.72)#53 | 1.9%(+5.84)#872 |
| 54. | Cape Royale | 7.6% | 2.0%(+5.61)#54 | 1.9%(+5.73)#898 |
| 55. | South Frydek | 7.5% | 2.0%(+5.51)#55 | 1.9%(+5.63)#929 |
| 56. | Groesbeck | 7.5% | 2.0%(+5.46)#56 | 1.9%(+5.58)#939 |
| 57. | Dilley | 7.5% | 2.0%(+5.45)#57 | 1.9%(+5.57)#940 |
| 58. | Pattison | 7.3% | 2.0%(+5.31)#58 | 1.9%(+5.43)#963 |
| 59. | Stockton Bend | 7.3% | 2.0%(+5.28)#59 | 1.9%(+5.40)#971 |
| 60. | Dripping Springs | 7.3% | 2.0%(+5.26)#60 | 1.9%(+5.38)#977 |
| 61. | Industry | 7.1% | 2.0%(+5.14)#61 | 1.9%(+5.25)#1,006 |
| 62. | El Lago | 7.1% | 2.0%(+5.05)#62 | 1.9%(+5.17)#1,029 |
| 63. | Big Sandy | 7.0% | 2.0%(+5.04)#63 | 1.9%(+5.15)#1,031 |
| 64. | Bayview | 7.0% | 2.0%(+5.01)#64 | 1.9%(+5.13)#1,036 |
| 65. | Three Rivers | 6.9% | 2.0%(+4.88)#65 | 1.9%(+5.00)#1,074 |
| 66. | Wilson | 6.8% | 2.0%(+4.75)#66 | 1.9%(+4.87)#1,105 |
| 67. | Laguna Vista | 6.7% | 2.0%(+4.73)#67 | 1.9%(+4.85)#1,108 |
| 68. | Trophy Club | 6.7% | 2.0%(+4.69)#68 | 1.9%(+4.80)#1,114 |
| 69. | Leakey | 6.6% | 2.0%(+4.61)#69 | 1.9%(+4.73)#1,143 |
| 70. | Mullin | 6.6% | 2.0%(+4.60)#70 | 1.9%(+4.71)#1,152 |
| 71. | Linden | 6.6% | 2.0%(+4.58)#71 | 1.9%(+4.69)#1,158 |
| 72. | Retreat | 6.5% | 2.0%(+4.49)#72 | 1.9%(+4.60)#1,193 |
| 73. | South Houston | 6.5% | 2.0%(+4.45)#73 | 1.9%(+4.57)#1,201 |
| 74. | Paloma Creek South | 6.4% | 2.0%(+4.42)#74 | 1.9%(+4.54)#1,207 |
| 75. | Burnet | 6.4% | 2.0%(+4.36)#75 | 1.9%(+4.48)#1,228 |
| 76. | Lakeside Town Tarrant County | 6.3% | 2.0%(+4.27)#76 | 1.9%(+4.38)#1,255 |
| 77. | Emerald Bay | 6.3% | 2.0%(+4.27)#77 | 1.9%(+4.38)#1,256 |
| 78. | Aransas Pass | 6.3% | 2.0%(+4.26)#78 | 1.9%(+4.37)#1,259 |
| 79. | Bevil Oaks | 6.2% | 2.0%(+4.24)#79 | 1.9%(+4.36)#1,266 |
| 80. | Kennard | 6.2% | 2.0%(+4.24)#80 | 1.9%(+4.36)#1,270 |
| 81. | Clear Lake Shores | 6.2% | 2.0%(+4.21)#81 | 1.9%(+4.33)#1,288 |
| 82. | Highland Haven | 6.2% | 2.0%(+4.19)#82 | 1.9%(+4.30)#1,299 |
| 83. | West Lake Hills | 6.1% | 2.0%(+4.12)#83 | 1.9%(+4.23)#1,325 |
| 84. | Munday | 6.1% | 2.0%(+4.11)#84 | 1.9%(+4.22)#1,328 |
| 85. | Terrell Hills | 6.1% | 2.0%(+4.08)#85 | 1.9%(+4.20)#1,338 |
| 86. | Hill Country Village | 6.0% | 2.0%(+4.04)#86 | 1.9%(+4.15)#1,352 |
| 87. | Enchanted Oaks | 6.0% | 2.0%(+4.03)#87 | 1.9%(+4.14)#1,361 |
| 88. | Bunker Hill Village | 6.0% | 2.0%(+3.98)#88 | 1.9%(+4.10)#1,381 |
| 89. | Bartonville | 5.9% | 2.0%(+3.93)#89 | 1.9%(+4.04)#1,407 |
| 90. | The Hills | 5.9% | 2.0%(+3.91)#90 | 1.9%(+4.03)#1,411 |
| 91. | Wild Peach Village | 5.9% | 2.0%(+3.90)#91 | 1.9%(+4.02)#1,414 |
| 92. | Star Harbor | 5.9% | 2.0%(+3.87)#92 | 1.9%(+3.99)#1,421 |
| 93. | Santa Clara | 5.8% | 2.0%(+3.83)#93 | 1.9%(+3.94)#1,444 |
| 94. | Idalou | 5.8% | 2.0%(+3.79)#94 | 1.9%(+3.90)#1,463 |
| 95. | Paloma Creek | 5.7% | 2.0%(+3.73)#95 | 1.9%(+3.85)#1,484 |
| 96. | Kemah | 5.7% | 2.0%(+3.70)#96 | 1.9%(+3.82)#1,497 |
| 97. | Hunters Creek Village | 5.7% | 2.0%(+3.68)#97 | 1.9%(+3.80)#1,502 |
| 98. | Briaroaks | 5.6% | 2.0%(+3.58)#98 | 1.9%(+3.70)#1,546 |
| 99. | Vanderbilt | 5.6% | 2.0%(+3.58)#99 | 1.9%(+3.69)#1,551 |
| 100. | Pecan Hill | 5.5% | 2.0%(+3.52)#100 | 1.9%(+3.63)#1,580 |
Common Questions
What are the Top 10 Cities with the Highest Percentage of Population Employed in Real Estate, Rental & Leasing in Texas?
Top 10 Cities with the Highest Percentage of Population Employed in Real Estate, Rental & Leasing in Texas are:
#1
100.0%
#2
55.5%
#3
52.2%
#4
38.1%
#5
34.0%
#6
23.0%
#7
21.8%
#8
20.8%
#9
16.4%
#10
16.3%
What city has the Highest Percentage of Population Employed in Real Estate, Rental & Leasing in Texas?
Los Alvarez has the Highest Percentage of Population Employed in Real Estate, Rental & Leasing in Texas with 100.0%.
What is the Percentage of Population Employed in Real Estate, Rental & Leasing in the State of Texas?
Percentage of Population Employed in Real Estate, Rental & Leasing in Texas is 2.0%.
What is the Percentage of Population Employed in Real Estate, Rental & Leasing in the United States?
Percentage of Population Employed in Real Estate, Rental & Leasing in the United States is 1.9%.