Cities with the Highest Percentage of Population Employed in Real Estate, Rental & Leasing in Michigan
RELATED REPORTS & OPTIONS
Real Estate, Rental & Leasing
Michigan
Compare Cities
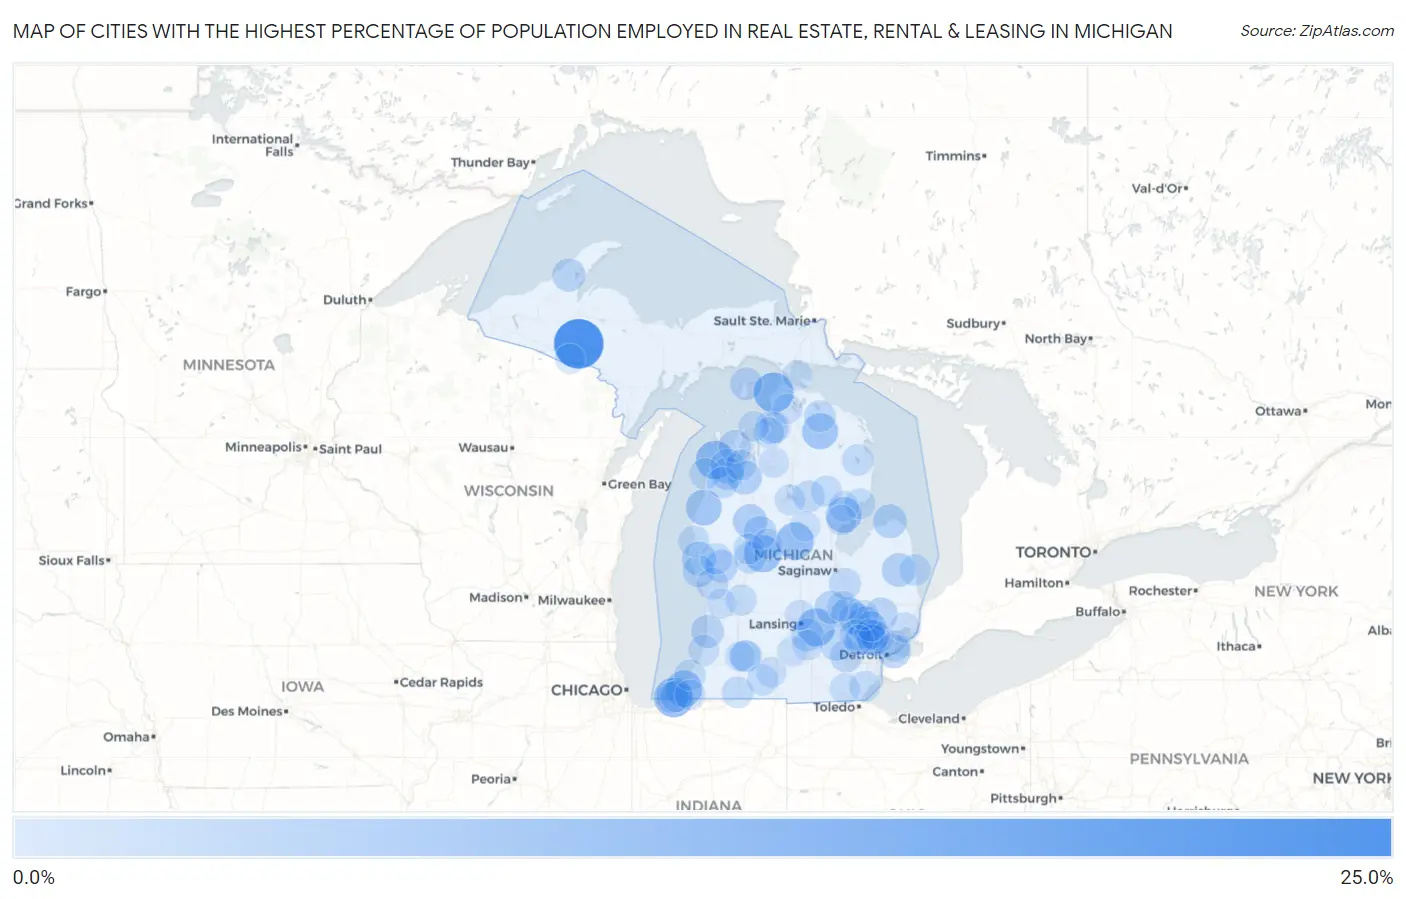
Map of Cities with the Highest Percentage of Population Employed in Real Estate, Rental & Leasing in Michigan
0.0%
25.0%
Cities with the Highest Percentage of Population Employed in Real Estate, Rental & Leasing in Michigan
| City | % Employed | vs State | vs National | |
| 1. | Amasa | 22.2% | 1.5%(+20.7)#1 | 1.9%(+20.3)#127 |
| 2. | Fulton | 18.5% | 1.5%(+17.0)#2 | 1.9%(+16.6)#171 |
| 3. | Grand Marais | 15.1% | 1.5%(+13.6)#3 | 1.9%(+13.2)#245 |
| 4. | Cross Village | 12.5% | 1.5%(+11.0)#4 | 1.9%(+10.6)#347 |
| 5. | Grand Beach | 11.8% | 1.5%(+10.3)#5 | 1.9%(+9.87)#391 |
| 6. | Elm Hall | 11.5% | 1.5%(+9.97)#6 | 1.9%(+9.58)#414 |
| 7. | Empire | 10.8% | 1.5%(+9.31)#7 | 1.9%(+8.92)#463 |
| 8. | Williamston | 10.5% | 1.5%(+9.00)#8 | 1.9%(+8.62)#484 |
| 9. | Loomis | 10.1% | 1.5%(+8.56)#9 | 1.9%(+8.18)#528 |
| 10. | Mecosta | 9.8% | 1.5%(+8.34)#10 | 1.9%(+7.95)#554 |
| 11. | Shorewood Tower Hills Harbert | 9.1% | 1.5%(+7.63)#11 | 1.9%(+7.24)#629 |
| 12. | Canada Creek Ranch | 8.5% | 1.5%(+7.03)#12 | 1.9%(+6.64)#715 |
| 13. | Stronach | 8.3% | 1.5%(+6.83)#13 | 1.9%(+6.44)#754 |
| 14. | Twining | 8.2% | 1.5%(+6.71)#14 | 1.9%(+6.33)#772 |
| 15. | Shaftsburg | 7.8% | 1.5%(+6.27)#15 | 1.9%(+5.88)#865 |
| 16. | Lake Fenton | 7.6% | 1.5%(+6.09)#16 | 1.9%(+5.71)#900 |
| 17. | Village Of Clarkston | 7.3% | 1.5%(+5.77)#17 | 1.9%(+5.38)#974 |
| 18. | Lake Ann | 6.9% | 1.5%(+5.37)#18 | 1.9%(+4.98)#1,079 |
| 19. | Le Roy | 6.7% | 1.5%(+5.16)#19 | 1.9%(+4.77)#1,124 |
| 20. | Grosse Pointe Park | 6.4% | 1.5%(+4.86)#20 | 1.9%(+4.47)#1,230 |
| 21. | Kingsley | 6.4% | 1.5%(+4.85)#21 | 1.9%(+4.47)#1,231 |
| 22. | New Era | 6.4% | 1.5%(+4.85)#22 | 1.9%(+4.46)#1,233 |
| 23. | Port Austin | 6.3% | 1.5%(+4.81)#23 | 1.9%(+4.42)#1,249 |
| 24. | Sandusky | 6.1% | 1.5%(+4.60)#24 | 1.9%(+4.21)#1,333 |
| 25. | Vernon | 5.7% | 1.5%(+4.16)#25 | 1.9%(+3.77)#1,514 |
| 26. | South Range | 5.7% | 1.5%(+4.15)#26 | 1.9%(+3.76)#1,520 |
| 27. | Bingham Farms | 5.6% | 1.5%(+4.07)#27 | 1.9%(+3.69)#1,556 |
| 28. | Douglas | 5.5% | 1.5%(+4.01)#28 | 1.9%(+3.62)#1,585 |
| 29. | Evart | 5.5% | 1.5%(+3.99)#29 | 1.9%(+3.60)#1,601 |
| 30. | Fremont | 5.4% | 1.5%(+3.93)#30 | 1.9%(+3.55)#1,618 |
| 31. | Bendon | 5.4% | 1.5%(+3.93)#31 | 1.9%(+3.54)#1,620 |
| 32. | Mason | 5.4% | 1.5%(+3.90)#32 | 1.9%(+3.52)#1,631 |
| 33. | Leonard | 5.1% | 1.5%(+3.64)#33 | 1.9%(+3.26)#1,783 |
| 34. | Advance | 5.1% | 1.5%(+3.56)#34 | 1.9%(+3.17)#1,826 |
| 35. | Kincheloe | 5.1% | 1.5%(+3.55)#35 | 1.9%(+3.16)#1,829 |
| 36. | Holly | 5.0% | 1.5%(+3.51)#36 | 1.9%(+3.13)#1,848 |
| 37. | St James | 5.0% | 1.5%(+3.49)#37 | 1.9%(+3.11)#1,861 |
| 38. | Lake Leelanau | 5.0% | 1.5%(+3.49)#38 | 1.9%(+3.11)#1,863 |
| 39. | Whitehall | 4.9% | 1.5%(+3.35)#39 | 1.9%(+2.96)#1,961 |
| 40. | Barton Hills | 4.8% | 1.5%(+3.31)#40 | 1.9%(+2.93)#1,983 |
| 41. | Birmingham | 4.7% | 1.5%(+3.18)#41 | 1.9%(+2.80)#2,071 |
| 42. | Michiana | 4.6% | 1.5%(+3.13)#42 | 1.9%(+2.74)#2,114 |
| 43. | Walled Lake | 4.6% | 1.5%(+3.06)#43 | 1.9%(+2.68)#2,158 |
| 44. | Stanwood | 4.5% | 1.5%(+3.04)#44 | 1.9%(+2.65)#2,177 |
| 45. | Wolf Lake | 4.5% | 1.5%(+2.98)#45 | 1.9%(+2.59)#2,220 |
| 46. | Pinckney | 4.4% | 1.5%(+2.94)#46 | 1.9%(+2.55)#2,256 |
| 47. | New Buffalo | 4.3% | 1.5%(+2.77)#47 | 1.9%(+2.39)#2,377 |
| 48. | Birch Run | 4.3% | 1.5%(+2.76)#48 | 1.9%(+2.37)#2,386 |
| 49. | Onaway | 4.2% | 1.5%(+2.74)#49 | 1.9%(+2.35)#2,408 |
| 50. | St Helen | 4.2% | 1.5%(+2.72)#50 | 1.9%(+2.33)#2,426 |
| 51. | Constantine | 4.1% | 1.5%(+2.64)#51 | 1.9%(+2.25)#2,497 |
| 52. | Comstock Northwest | 4.1% | 1.5%(+2.59)#52 | 1.9%(+2.21)#2,556 |
| 53. | Port Sanilac | 4.1% | 1.5%(+2.58)#53 | 1.9%(+2.19)#2,575 |
| 54. | Frankfort | 4.1% | 1.5%(+2.55)#54 | 1.9%(+2.16)#2,601 |
| 55. | Eastwood | 4.0% | 1.5%(+2.52)#55 | 1.9%(+2.13)#2,636 |
| 56. | Hesperia | 4.0% | 1.5%(+2.52)#56 | 1.9%(+2.13)#2,637 |
| 57. | Hubbard Lake | 4.0% | 1.5%(+2.47)#57 | 1.9%(+2.09)#2,683 |
| 58. | Pentwater | 3.9% | 1.5%(+2.42)#58 | 1.9%(+2.03)#2,741 |
| 59. | Thompsonville | 3.9% | 1.5%(+2.41)#59 | 1.9%(+2.02)#2,750 |
| 60. | Chassell | 3.8% | 1.5%(+2.33)#60 | 1.9%(+1.94)#2,843 |
| 61. | Shoreham | 3.8% | 1.5%(+2.30)#61 | 1.9%(+1.91)#2,875 |
| 62. | Orchard Lake Village | 3.7% | 1.5%(+2.21)#62 | 1.9%(+1.83)#2,982 |
| 63. | Milford | 3.7% | 1.5%(+2.20)#63 | 1.9%(+1.82)#2,999 |
| 64. | Rose City | 3.7% | 1.5%(+2.20)#64 | 1.9%(+1.81)#3,011 |
| 65. | Sherwood | 3.7% | 1.5%(+2.20)#65 | 1.9%(+1.81)#3,013 |
| 66. | Northview | 3.7% | 1.5%(+2.16)#66 | 1.9%(+1.77)#3,061 |
| 67. | Tawas City | 3.6% | 1.5%(+2.14)#67 | 1.9%(+1.75)#3,098 |
| 68. | Boyne City | 3.6% | 1.5%(+2.12)#68 | 1.9%(+1.74)#3,116 |
| 69. | Big Rapids | 3.6% | 1.5%(+2.10)#69 | 1.9%(+1.72)#3,145 |
| 70. | West Monroe | 3.6% | 1.5%(+2.07)#70 | 1.9%(+1.69)#3,183 |
| 71. | Traverse City | 3.5% | 1.5%(+2.00)#71 | 1.9%(+1.62)#3,278 |
| 72. | South Haven | 3.4% | 1.5%(+1.90)#72 | 1.9%(+1.52)#3,412 |
| 73. | Grosse Pointe Woods | 3.4% | 1.5%(+1.89)#73 | 1.9%(+1.50)#3,435 |
| 74. | Houghton Lake | 3.4% | 1.5%(+1.88)#74 | 1.9%(+1.50)#3,444 |
| 75. | East Jordan | 3.4% | 1.5%(+1.87)#75 | 1.9%(+1.48)#3,466 |
| 76. | Swartz Creek | 3.4% | 1.5%(+1.85)#76 | 1.9%(+1.47)#3,482 |
| 77. | Norwood | 3.3% | 1.5%(+1.83)#77 | 1.9%(+1.44)#3,520 |
| 78. | Deerfield | 3.3% | 1.5%(+1.77)#78 | 1.9%(+1.38)#3,629 |
| 79. | Gladwin | 3.2% | 1.5%(+1.72)#79 | 1.9%(+1.33)#3,735 |
| 80. | Whittemore | 3.2% | 1.5%(+1.69)#80 | 1.9%(+1.31)#3,770 |
| 81. | Keego Harbor | 3.1% | 1.5%(+1.63)#81 | 1.9%(+1.24)#3,884 |
| 82. | Omer | 3.1% | 1.5%(+1.62)#82 | 1.9%(+1.23)#3,898 |
| 83. | New Baltimore | 3.1% | 1.5%(+1.61)#83 | 1.9%(+1.22)#3,913 |
| 84. | Leslie | 3.1% | 1.5%(+1.61)#84 | 1.9%(+1.22)#3,916 |
| 85. | Bloomfield Hills | 3.1% | 1.5%(+1.59)#85 | 1.9%(+1.21)#3,933 |
| 86. | Franklin | 3.1% | 1.5%(+1.59)#86 | 1.9%(+1.20)#3,935 |
| 87. | Galien | 3.1% | 1.5%(+1.57)#87 | 1.9%(+1.19)#3,971 |
| 88. | Manistee Lake | 3.1% | 1.5%(+1.57)#88 | 1.9%(+1.19)#3,973 |
| 89. | Dewitt | 3.1% | 1.5%(+1.57)#89 | 1.9%(+1.18)#3,980 |
| 90. | Barryton | 3.0% | 1.5%(+1.53)#90 | 1.9%(+1.14)#4,073 |
| 91. | Burlington | 3.0% | 1.5%(+1.53)#91 | 1.9%(+1.14)#4,074 |
| 92. | Allendale | 3.0% | 1.5%(+1.48)#92 | 1.9%(+1.09)#4,153 |
| 93. | Lake Angelus | 3.0% | 1.5%(+1.46)#93 | 1.9%(+1.07)#4,196 |
| 94. | Alanson | 2.9% | 1.5%(+1.41)#94 | 1.9%(+1.03)#4,291 |
| 95. | Westwood | 2.9% | 1.5%(+1.40)#95 | 1.9%(+1.01)#4,310 |
| 96. | Gaastra | 2.9% | 1.5%(+1.38)#96 | 1.9%(+0.993)#4,351 |
| 97. | Mackinac Island | 2.9% | 1.5%(+1.37)#97 | 1.9%(+0.981)#4,378 |
| 98. | Ortonville | 2.9% | 1.5%(+1.36)#98 | 1.9%(+0.970)#4,400 |
| 99. | Springport | 2.8% | 1.5%(+1.32)#99 | 1.9%(+0.933)#4,488 |
| 100. | Wixom | 2.8% | 1.5%(+1.26)#100 | 1.9%(+0.871)#4,623 |
Common Questions
What are the Top 10 Cities with the Highest Percentage of Population Employed in Real Estate, Rental & Leasing in Michigan?
Top 10 Cities with the Highest Percentage of Population Employed in Real Estate, Rental & Leasing in Michigan are:
#1
22.2%
#2
12.5%
#3
11.8%
#4
10.8%
#5
10.5%
#6
10.1%
#7
9.8%
#8
9.1%
#9
8.5%
#10
8.3%
What city has the Highest Percentage of Population Employed in Real Estate, Rental & Leasing in Michigan?
Amasa has the Highest Percentage of Population Employed in Real Estate, Rental & Leasing in Michigan with 22.2%.
What is the Percentage of Population Employed in Real Estate, Rental & Leasing in the State of Michigan?
Percentage of Population Employed in Real Estate, Rental & Leasing in Michigan is 1.5%.
What is the Percentage of Population Employed in Real Estate, Rental & Leasing in the United States?
Percentage of Population Employed in Real Estate, Rental & Leasing in the United States is 1.9%.