Cities with the Highest Percentage of Population Employed in Real Estate, Rental & Leasing in Washington
RELATED REPORTS & OPTIONS
Real Estate, Rental & Leasing
Washington
Compare Cities
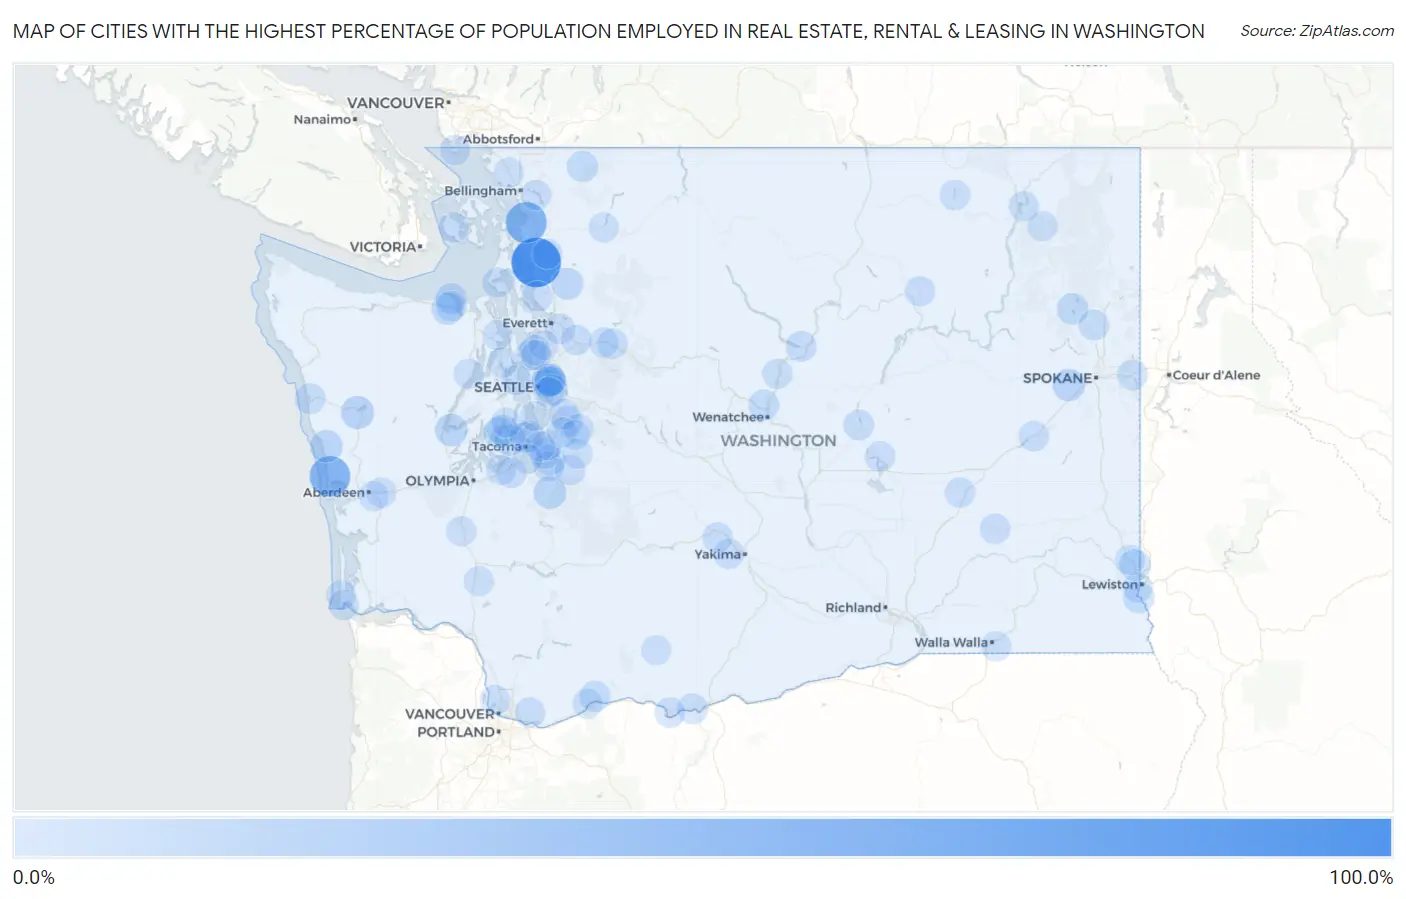
Map of Cities with the Highest Percentage of Population Employed in Real Estate, Rental & Leasing in Washington
0.0%
100.0%
Cities with the Highest Percentage of Population Employed in Real Estate, Rental & Leasing in Washington
| City | % Employed | vs State | vs National | |
| 1. | Conway | 100.0% | 2.1%(+97.9)#1 | 1.9%(+98.1)#4 |
| 2. | Edison | 56.5% | 2.1%(+54.4)#2 | 1.9%(+54.6)#15 |
| 3. | Ocean City | 54.3% | 2.1%(+52.3)#3 | 1.9%(+52.5)#18 |
| 4. | Hunts Point | 22.1% | 2.1%(+20.0)#4 | 1.9%(+20.2)#128 |
| 5. | Amanda Park | 16.7% | 2.1%(+14.6)#5 | 1.9%(+14.8)#202 |
| 6. | Kapowsin | 14.9% | 2.1%(+12.8)#6 | 1.9%(+13.0)#251 |
| 7. | Union | 14.9% | 2.1%(+12.8)#7 | 1.9%(+13.0)#252 |
| 8. | Fairchild Afb | 14.5% | 2.1%(+12.4)#8 | 1.9%(+12.6)#261 |
| 9. | Qui Nai Elt Village | 14.3% | 2.1%(+12.2)#9 | 1.9%(+12.4)#272 |
| 10. | Arlington Heights | 11.9% | 2.1%(+9.77)#10 | 1.9%(+9.97)#385 |
| 11. | River Road | 11.3% | 2.1%(+9.25)#11 | 1.9%(+9.46)#420 |
| 12. | Uniontown | 10.1% | 2.1%(+8.02)#12 | 1.9%(+8.23)#520 |
| 13. | Loon Lake | 9.8% | 2.1%(+7.71)#13 | 1.9%(+7.91)#557 |
| 14. | Medina | 9.1% | 2.1%(+6.96)#14 | 1.9%(+7.17)#647 |
| 15. | Jamestown | 8.8% | 2.1%(+6.73)#15 | 1.9%(+6.93)#672 |
| 16. | Wollochet | 8.7% | 2.1%(+6.64)#16 | 1.9%(+6.84)#686 |
| 17. | Asotin | 8.5% | 2.1%(+6.40)#17 | 1.9%(+6.61)#723 |
| 18. | Yarrow Point | 8.4% | 2.1%(+6.28)#18 | 1.9%(+6.48)#746 |
| 19. | Raft Island | 7.9% | 2.1%(+5.81)#19 | 1.9%(+6.01)#841 |
| 20. | Rosedale | 7.6% | 2.1%(+5.55)#20 | 1.9%(+5.76)#894 |
| 21. | Kitsap Lake | 7.5% | 2.1%(+5.41)#21 | 1.9%(+5.62)#930 |
| 22. | Carson | 7.4% | 2.1%(+5.28)#22 | 1.9%(+5.49)#954 |
| 23. | Glacier | 7.3% | 2.1%(+5.21)#23 | 1.9%(+5.41)#967 |
| 24. | Sunnyslope | 7.2% | 2.1%(+5.12)#24 | 1.9%(+5.33)#986 |
| 25. | Woodway | 7.2% | 2.1%(+5.09)#25 | 1.9%(+5.29)#995 |
| 26. | Queets | 6.9% | 2.1%(+4.80)#26 | 1.9%(+5.00)#1,071 |
| 27. | Beaux Arts Village | 6.5% | 2.1%(+4.42)#27 | 1.9%(+4.63)#1,181 |
| 28. | Dash Point | 6.4% | 2.1%(+4.29)#28 | 1.9%(+4.49)#1,220 |
| 29. | Erlands Point | 6.3% | 2.1%(+4.22)#29 | 1.9%(+4.42)#1,245 |
| 30. | Wishram | 6.2% | 2.1%(+4.15)#30 | 1.9%(+4.36)#1,268 |
| 31. | Roche Harbor | 6.2% | 2.1%(+4.09)#31 | 1.9%(+4.30)#1,300 |
| 32. | Deer Park | 6.1% | 2.1%(+4.01)#32 | 1.9%(+4.22)#1,331 |
| 33. | Shadow Lake | 6.0% | 2.1%(+3.94)#33 | 1.9%(+4.14)#1,363 |
| 34. | Chelan | 6.0% | 2.1%(+3.90)#34 | 1.9%(+4.11)#1,373 |
| 35. | Lakeview | 5.9% | 2.1%(+3.82)#35 | 1.9%(+4.02)#1,413 |
| 36. | Clyde Hill | 5.7% | 2.1%(+3.65)#36 | 1.9%(+3.85)#1,482 |
| 37. | Fort Lewis | 5.7% | 2.1%(+3.60)#37 | 1.9%(+3.81)#1,499 |
| 38. | May Creek | 5.6% | 2.1%(+3.54)#38 | 1.9%(+3.75)#1,524 |
| 39. | Curlew Lake | 5.6% | 2.1%(+3.46)#39 | 1.9%(+3.66)#1,564 |
| 40. | Fobes Hill | 5.4% | 2.1%(+3.25)#40 | 1.9%(+3.46)#1,668 |
| 41. | Alderton | 5.2% | 2.1%(+3.15)#41 | 1.9%(+3.35)#1,718 |
| 42. | Browns Point | 5.2% | 2.1%(+3.14)#42 | 1.9%(+3.35)#1,721 |
| 43. | Sequim | 5.2% | 2.1%(+3.14)#43 | 1.9%(+3.34)#1,725 |
| 44. | Mercer Island | 5.2% | 2.1%(+3.13)#44 | 1.9%(+3.34)#1,727 |
| 45. | Mcmillin | 5.2% | 2.1%(+3.10)#45 | 1.9%(+3.30)#1,750 |
| 46. | Liberty Lake | 5.1% | 2.1%(+3.05)#46 | 1.9%(+3.25)#1,785 |
| 47. | North Puyallup | 5.1% | 2.1%(+3.00)#47 | 1.9%(+3.21)#1,801 |
| 48. | Kayak Point | 5.0% | 2.1%(+2.87)#48 | 1.9%(+3.08)#1,879 |
| 49. | Sudden Valley | 4.9% | 2.1%(+2.78)#49 | 1.9%(+2.99)#1,929 |
| 50. | Summitview | 4.9% | 2.1%(+2.76)#50 | 1.9%(+2.97)#1,955 |
| 51. | Maple Heights Lake Desire | 4.8% | 2.1%(+2.75)#51 | 1.9%(+2.95)#1,966 |
| 52. | Pacific | 4.8% | 2.1%(+2.72)#52 | 1.9%(+2.92)#1,984 |
| 53. | Moses Lake North | 4.8% | 2.1%(+2.66)#53 | 1.9%(+2.87)#2,016 |
| 54. | Edmonds | 4.7% | 2.1%(+2.64)#54 | 1.9%(+2.85)#2,034 |
| 55. | Monroe North | 4.7% | 2.1%(+2.59)#55 | 1.9%(+2.80)#2,066 |
| 56. | Friday Harbor | 4.7% | 2.1%(+2.58)#56 | 1.9%(+2.78)#2,077 |
| 57. | Washtucna | 4.7% | 2.1%(+2.55)#57 | 1.9%(+2.76)#2,101 |
| 58. | Ilwaco | 4.6% | 2.1%(+2.47)#58 | 1.9%(+2.68)#2,155 |
| 59. | Tieton | 4.5% | 2.1%(+2.37)#59 | 1.9%(+2.57)#2,240 |
| 60. | Coupeville | 4.5% | 2.1%(+2.36)#60 | 1.9%(+2.56)#2,250 |
| 61. | Entiat | 4.4% | 2.1%(+2.31)#61 | 1.9%(+2.52)#2,281 |
| 62. | Sprague | 4.3% | 2.1%(+2.25)#62 | 1.9%(+2.46)#2,330 |
| 63. | Nespelem | 4.3% | 2.1%(+2.25)#63 | 1.9%(+2.46)#2,334 |
| 64. | Marcus | 4.3% | 2.1%(+2.16)#64 | 1.9%(+2.36)#2,396 |
| 65. | Dallesport | 4.1% | 2.1%(+2.05)#65 | 1.9%(+2.25)#2,498 |
| 66. | Bainbridge Island | 4.1% | 2.1%(+2.04)#66 | 1.9%(+2.24)#2,508 |
| 67. | Point Roberts | 4.1% | 2.1%(+2.01)#67 | 1.9%(+2.22)#2,543 |
| 68. | Lind | 4.1% | 2.1%(+2.01)#68 | 1.9%(+2.21)#2,549 |
| 69. | Fern Prairie | 4.0% | 2.1%(+1.93)#69 | 1.9%(+2.14)#2,633 |
| 70. | Wilkeson | 4.0% | 2.1%(+1.86)#70 | 1.9%(+2.07)#2,704 |
| 71. | Ravensdale | 4.0% | 2.1%(+1.86)#71 | 1.9%(+2.06)#2,714 |
| 72. | Concrete | 3.9% | 2.1%(+1.82)#72 | 1.9%(+2.03)#2,742 |
| 73. | Lake Morton Berrydale | 3.9% | 2.1%(+1.80)#73 | 1.9%(+2.00)#2,778 |
| 74. | Walla Walla East | 3.9% | 2.1%(+1.78)#74 | 1.9%(+1.99)#2,799 |
| 75. | Startup | 3.9% | 2.1%(+1.76)#75 | 1.9%(+1.96)#2,821 |
| 76. | Central Park | 3.8% | 2.1%(+1.70)#76 | 1.9%(+1.90)#2,894 |
| 77. | Ferndale | 3.7% | 2.1%(+1.63)#77 | 1.9%(+1.83)#2,978 |
| 78. | Big Lake | 3.7% | 2.1%(+1.60)#78 | 1.9%(+1.80)#3,025 |
| 79. | Poulsbo | 3.7% | 2.1%(+1.57)#79 | 1.9%(+1.77)#3,058 |
| 80. | Normandy Park | 3.6% | 2.1%(+1.50)#80 | 1.9%(+1.71)#3,159 |
| 81. | Fords Prairie | 3.6% | 2.1%(+1.46)#81 | 1.9%(+1.67)#3,210 |
| 82. | Glenwood | 3.5% | 2.1%(+1.44)#82 | 1.9%(+1.65)#3,241 |
| 83. | Felida | 3.5% | 2.1%(+1.39)#83 | 1.9%(+1.60)#3,298 |
| 84. | Stevenson | 3.5% | 2.1%(+1.38)#84 | 1.9%(+1.58)#3,320 |
| 85. | Enumclaw | 3.5% | 2.1%(+1.37)#85 | 1.9%(+1.58)#3,325 |
| 86. | Milton | 3.5% | 2.1%(+1.36)#86 | 1.9%(+1.57)#3,339 |
| 87. | Midland | 3.5% | 2.1%(+1.36)#87 | 1.9%(+1.57)#3,343 |
| 88. | Brinnon | 3.4% | 2.1%(+1.35)#88 | 1.9%(+1.56)#3,354 |
| 89. | Long Beach | 3.4% | 2.1%(+1.32)#89 | 1.9%(+1.53)#3,391 |
| 90. | Colville | 3.4% | 2.1%(+1.30)#90 | 1.9%(+1.51)#3,423 |
| 91. | Toledo | 3.4% | 2.1%(+1.30)#91 | 1.9%(+1.50)#3,427 |
| 92. | Cosmopolis | 3.4% | 2.1%(+1.30)#92 | 1.9%(+1.50)#3,432 |
| 93. | North Lynnwood | 3.4% | 2.1%(+1.26)#93 | 1.9%(+1.47)#3,474 |
| 94. | Black Diamond | 3.4% | 2.1%(+1.26)#94 | 1.9%(+1.46)#3,487 |
| 95. | Esperance | 3.3% | 2.1%(+1.24)#95 | 1.9%(+1.45)#3,507 |
| 96. | Purdy | 3.3% | 2.1%(+1.21)#96 | 1.9%(+1.42)#3,566 |
| 97. | Dupont | 3.3% | 2.1%(+1.15)#97 | 1.9%(+1.36)#3,678 |
| 98. | West Clarkston Highland | 3.2% | 2.1%(+1.15)#98 | 1.9%(+1.35)#3,694 |
| 99. | Port Ludlow | 3.2% | 2.1%(+1.13)#99 | 1.9%(+1.34)#3,713 |
| 100. | Colton | 3.1% | 2.1%(+1.05)#100 | 1.9%(+1.25)#3,860 |
Common Questions
What are the Top 10 Cities with the Highest Percentage of Population Employed in Real Estate, Rental & Leasing in Washington?
Top 10 Cities with the Highest Percentage of Population Employed in Real Estate, Rental & Leasing in Washington are:
#1
100.0%
#2
56.5%
#3
54.3%
#4
22.1%
#5
16.7%
#6
14.9%
#7
14.9%
#8
14.5%
#9
14.3%
#10
11.9%
What city has the Highest Percentage of Population Employed in Real Estate, Rental & Leasing in Washington?
Conway has the Highest Percentage of Population Employed in Real Estate, Rental & Leasing in Washington with 100.0%.
What is the Percentage of Population Employed in Real Estate, Rental & Leasing in the State of Washington?
Percentage of Population Employed in Real Estate, Rental & Leasing in Washington is 2.1%.
What is the Percentage of Population Employed in Real Estate, Rental & Leasing in the United States?
Percentage of Population Employed in Real Estate, Rental & Leasing in the United States is 1.9%.