Butte Valley, CA Map & Demographics
Butte Valley Map
Butte Valley Overview
$52,160
PER CAPITA INCOME
$145,323
AVG FAMILY INCOME
$91,528
AVG HOUSEHOLD INCOME
0.34
INEQUALITY / GINI INDEX
811
TOTAL POPULATION
250
MALE POPULATION
561
FEMALE POPULATION
44.56
MALES / 100 FEMALES
224.40
FEMALES / 100 MALES
63.1
MEDIAN AGE
2.4
AVG FAMILY SIZE
1.7
AVG HOUSEHOLD SIZE
259
LABOR FORCE [ PEOPLE ]
37.1%
PERCENT IN LABOR FORCE
Butte Valley Area Codes
Income in Butte Valley
Income Overview in Butte Valley
Per Capita Income in Butte Valley is $52,160, while median incomes of families and households are $145,323 and $91,528 respectively.
| Characteristic | Number | Measure |
| Per Capita Income | 811 | $52,160 |
| Median Family Income | 230 | $145,323 |
| Mean Family Income | 230 | $131,669 |
| Median Household Income | 479 | $91,528 |
| Mean Household Income | 479 | $99,774 |
| Income Deficit | 230 | $0 |
| Wage / Income Gap (%) | 811 | 0.00% |
| Wage / Income Gap ($) | 811 | 100.00¢ per $1 |
| Gini / Inequality Index | 811 | 0.34 |
Earnings by Sex in Butte Valley
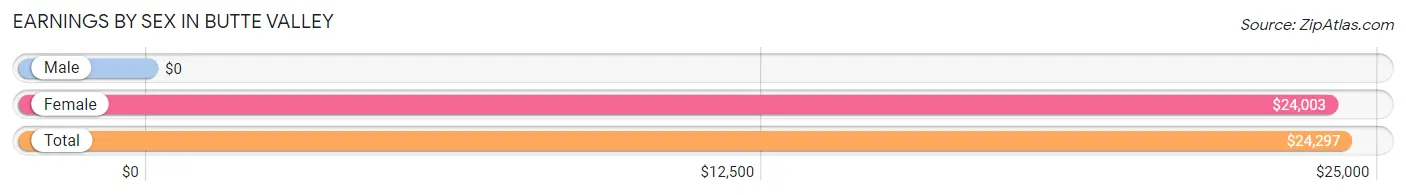
| Sex | Number | Average Earnings |
| Male | 142 (34.5%) | $0 |
| Female | 270 (65.5%) | $24,003 |
| Total | 412 (100.0%) | $24,297 |
Earnings by Sex by Income Bracket in Butte Valley
The most common earnings brackets in Butte Valley are $100,000+ for men (70 | 49.3%) and $22,500 to $24,999 for women (153 | 56.7%).
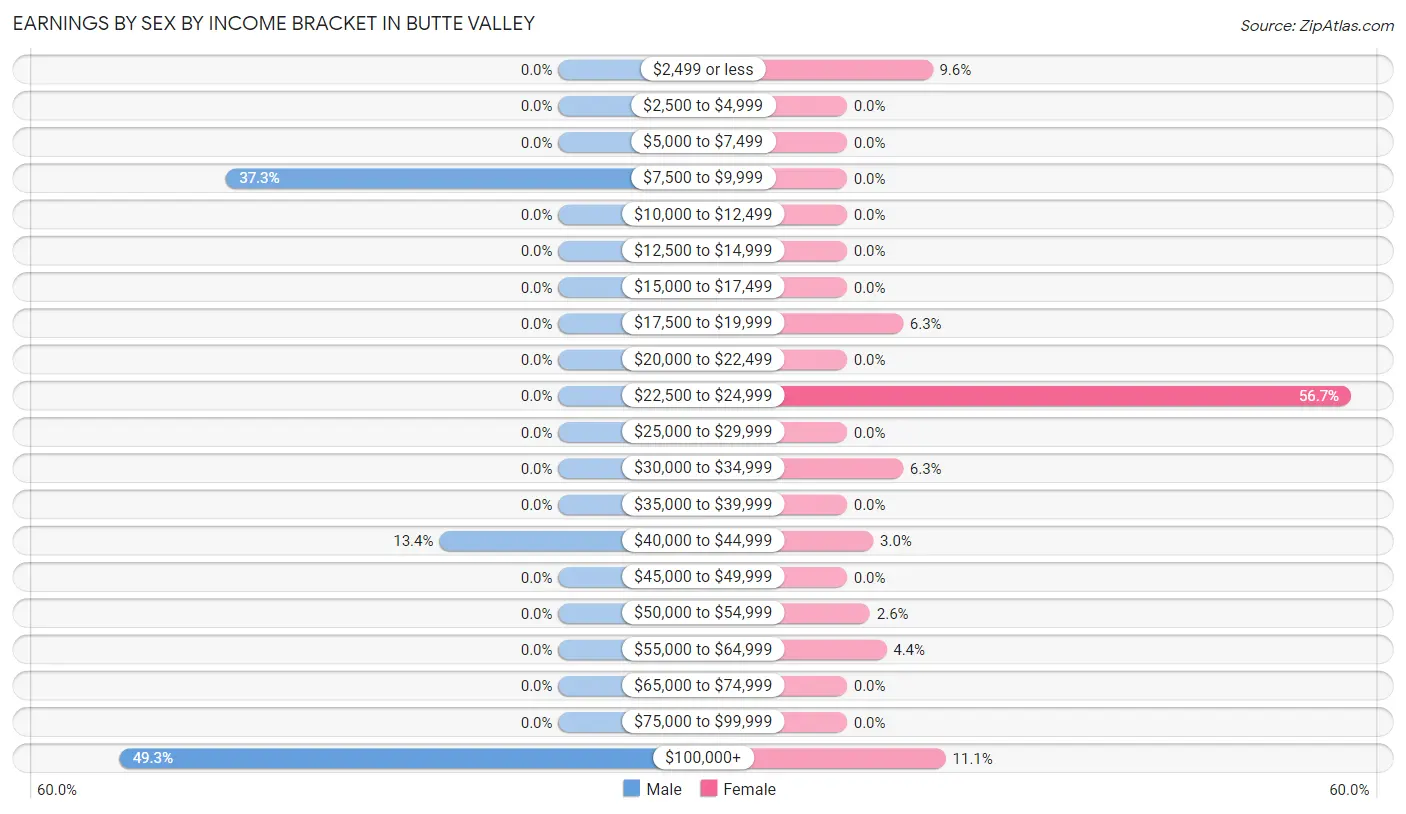
| Income | Male | Female |
| $2,499 or less | 0 (0.0%) | 26 (9.6%) |
| $2,500 to $4,999 | 0 (0.0%) | 0 (0.0%) |
| $5,000 to $7,499 | 0 (0.0%) | 0 (0.0%) |
| $7,500 to $9,999 | 53 (37.3%) | 0 (0.0%) |
| $10,000 to $12,499 | 0 (0.0%) | 0 (0.0%) |
| $12,500 to $14,999 | 0 (0.0%) | 0 (0.0%) |
| $15,000 to $17,499 | 0 (0.0%) | 0 (0.0%) |
| $17,500 to $19,999 | 0 (0.0%) | 17 (6.3%) |
| $20,000 to $22,499 | 0 (0.0%) | 0 (0.0%) |
| $22,500 to $24,999 | 0 (0.0%) | 153 (56.7%) |
| $25,000 to $29,999 | 0 (0.0%) | 0 (0.0%) |
| $30,000 to $34,999 | 0 (0.0%) | 17 (6.3%) |
| $35,000 to $39,999 | 0 (0.0%) | 0 (0.0%) |
| $40,000 to $44,999 | 19 (13.4%) | 8 (3.0%) |
| $45,000 to $49,999 | 0 (0.0%) | 0 (0.0%) |
| $50,000 to $54,999 | 0 (0.0%) | 7 (2.6%) |
| $55,000 to $64,999 | 0 (0.0%) | 12 (4.4%) |
| $65,000 to $74,999 | 0 (0.0%) | 0 (0.0%) |
| $75,000 to $99,999 | 0 (0.0%) | 0 (0.0%) |
| $100,000+ | 70 (49.3%) | 30 (11.1%) |
| Total | 142 (100.0%) | 270 (100.0%) |
Earnings by Sex by Educational Attainment in Butte Valley
| Educational Attainment | Male Income | Female Income |
| Less than High School | - | - |
| High School Diploma | - | - |
| College or Associate's Degree | - | - |
| Bachelor's Degree | - | - |
| Graduate Degree | - | - |
| Total | - | - |
Family Income in Butte Valley
Family Income Brackets in Butte Valley
According to the Butte Valley family income data, there are 107 families falling into the $100,000 to $149,999 income range, which is the most common income bracket and makes up 46.5% of all families.
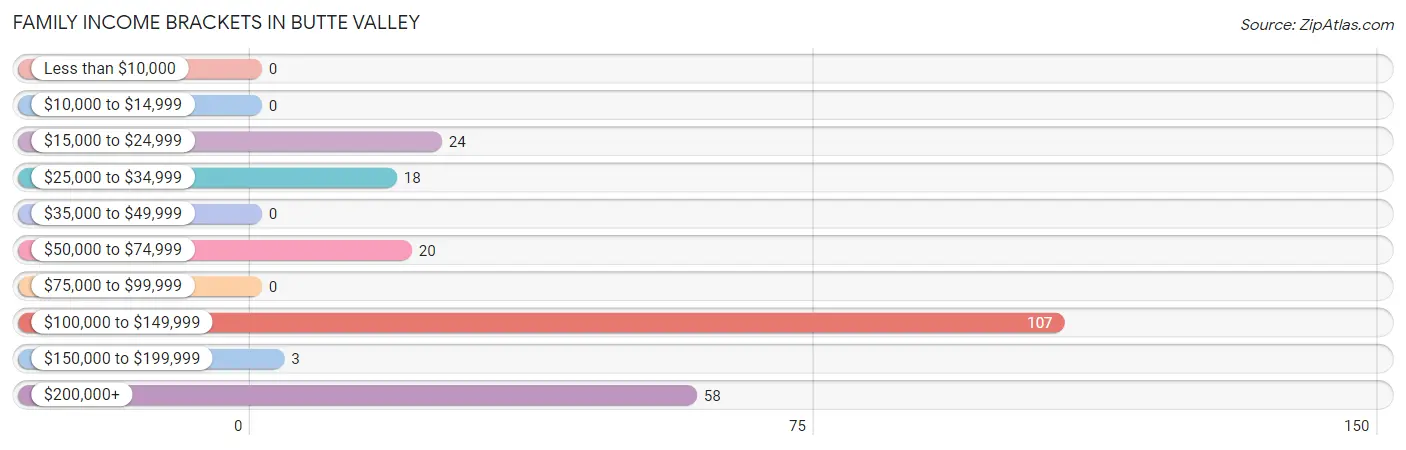
| Income Bracket | # Families | % Families |
| Less than $10,000 | 0 | 0.0% |
| $10,000 to $14,999 | 0 | 0.0% |
| $15,000 to $24,999 | 24 | 10.4% |
| $25,000 to $34,999 | 18 | 7.8% |
| $35,000 to $49,999 | 0 | 0.0% |
| $50,000 to $74,999 | 20 | 8.7% |
| $75,000 to $99,999 | 0 | 0.0% |
| $100,000 to $149,999 | 107 | 46.5% |
| $150,000 to $199,999 | 3 | 1.3% |
| $200,000+ | 58 | 25.2% |
Family Income by Famaliy Size in Butte Valley
2-person families (86 | 37.4%) account for the highest median family income in Butte Valley with $74,875 per family, while 2-person families (86 | 37.4%) have the highest median income of $37,438 per family member.
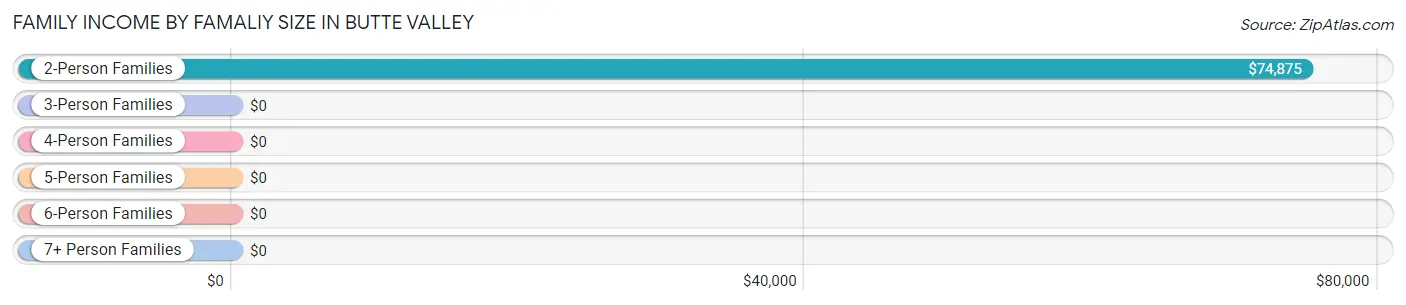
| Income Bracket | # Families | Median Income |
| 2-Person Families | 86 (37.4%) | $74,875 |
| 3-Person Families | 21 (9.1%) | $0 |
| 4-Person Families | 5 (2.2%) | $0 |
| 5-Person Families | 115 (50.0%) | $0 |
| 6-Person Families | 3 (1.3%) | $0 |
| 7+ Person Families | 0 (0.0%) | $0 |
| Total | 230 (100.0%) | $145,323 |
Family Income by Number of Earners in Butte Valley
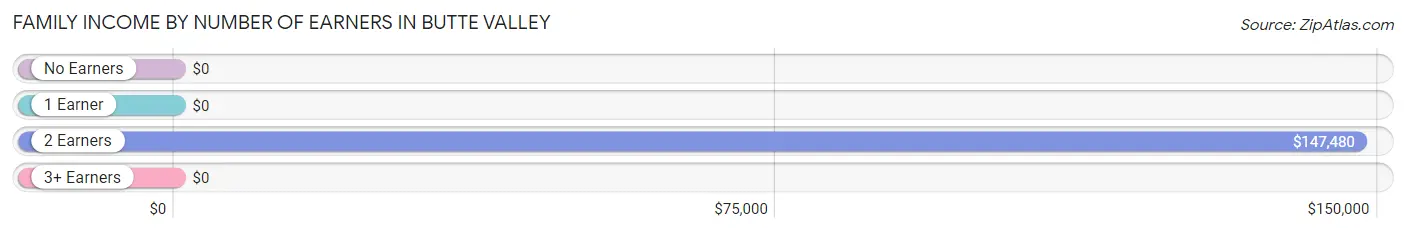
| Number of Earners | # Families | Median Income |
| No Earners | 107 (46.5%) | $0 |
| 1 Earner | 0 (0.0%) | $0 |
| 2 Earners | 123 (53.5%) | $147,480 |
| 3+ Earners | 0 (0.0%) | $0 |
| Total | 230 (100.0%) | $145,323 |
Household Income in Butte Valley
Household Income Brackets in Butte Valley
With 153 households falling in the category, the $75,000 to $99,999 income range is the most frequent in Butte Valley, accounting for 31.9% of all households.
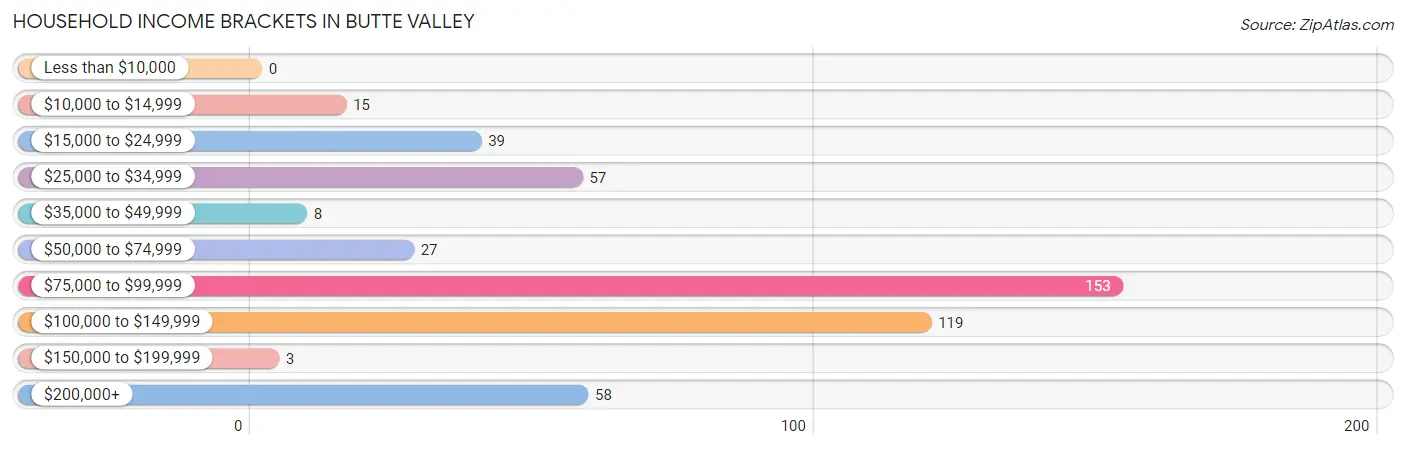
| Income Bracket | # Households | % Households |
| Less than $10,000 | 0 | 0.0% |
| $10,000 to $14,999 | 15 | 3.1% |
| $15,000 to $24,999 | 39 | 8.1% |
| $25,000 to $34,999 | 57 | 11.9% |
| $35,000 to $49,999 | 8 | 1.7% |
| $50,000 to $74,999 | 27 | 5.6% |
| $75,000 to $99,999 | 153 | 31.9% |
| $100,000 to $149,999 | 119 | 24.8% |
| $150,000 to $199,999 | 3 | 0.6% |
| $200,000+ | 58 | 12.1% |
Household Income by Householder Age in Butte Valley
The median household income in Butte Valley is $91,528, with the highest median household income of $208,797 found in the 25 to 44 years age bracket for the primary householder. A total of 61 households (12.7%) fall into this category.
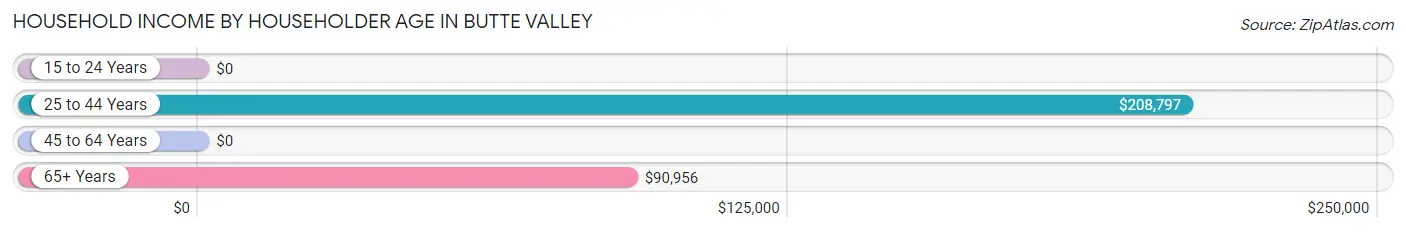
| Income Bracket | # Households | Median Income |
| 15 to 24 Years | 0 (0.0%) | $0 |
| 25 to 44 Years | 61 (12.7%) | $208,797 |
| 45 to 64 Years | 139 (29.0%) | $0 |
| 65+ Years | 279 (58.3%) | $90,956 |
| Total | 479 (100.0%) | $91,528 |
Poverty in Butte Valley
Income Below Poverty by Sex and Age in Butte Valley
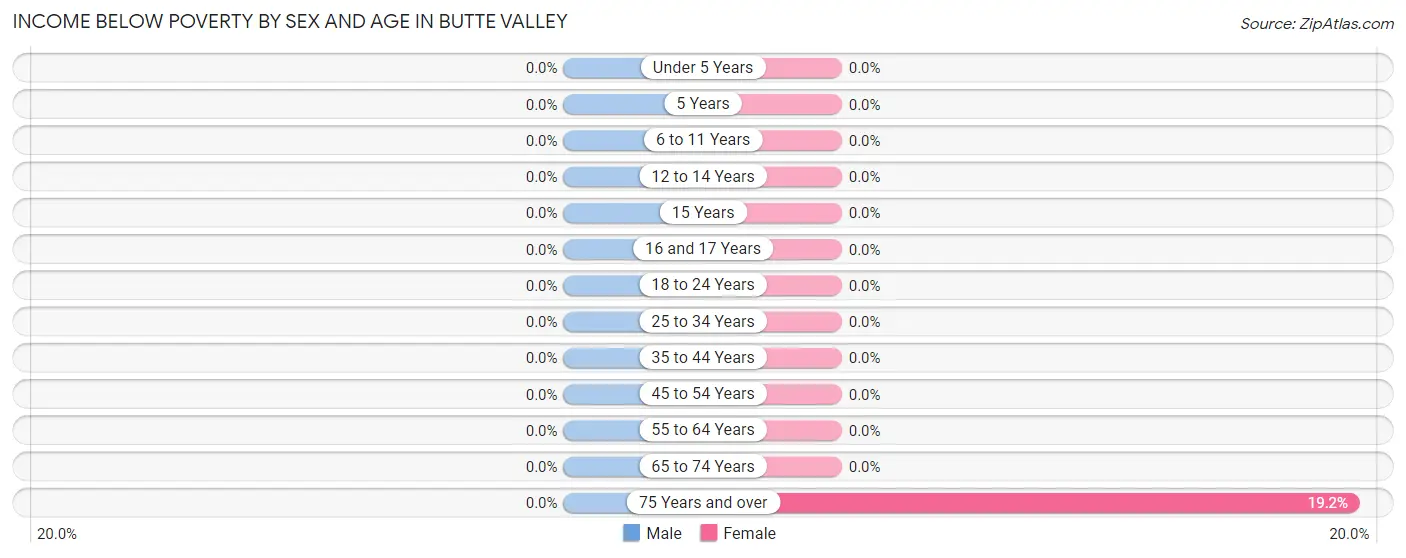
| Age Bracket | Male | Female |
| Under 5 Years | 0 (0.0%) | 0 (0.0%) |
| 5 Years | 0 (0.0%) | 0 (0.0%) |
| 6 to 11 Years | 0 (0.0%) | 0 (0.0%) |
| 12 to 14 Years | 0 (0.0%) | 0 (0.0%) |
| 15 Years | 0 (0.0%) | 0 (0.0%) |
| 16 and 17 Years | 0 (0.0%) | 0 (0.0%) |
| 18 to 24 Years | 0 (0.0%) | 0 (0.0%) |
| 25 to 34 Years | 0 (0.0%) | 0 (0.0%) |
| 35 to 44 Years | 0 (0.0%) | 0 (0.0%) |
| 45 to 54 Years | 0 (0.0%) | 0 (0.0%) |
| 55 to 64 Years | 0 (0.0%) | 0 (0.0%) |
| 65 to 74 Years | 0 (0.0%) | 0 (0.0%) |
| 75 Years and over | 0 (0.0%) | 15 (19.2%) |
| Total | 0 (0.0%) | 15 (2.7%) |
Income Above Poverty by Sex and Age in Butte Valley
According to the poverty statistics in Butte Valley, males aged under 5 years and females aged under 5 years are the age groups that are most secure financially, with 100.0% of males and 100.0% of females in these age groups living above the poverty line.
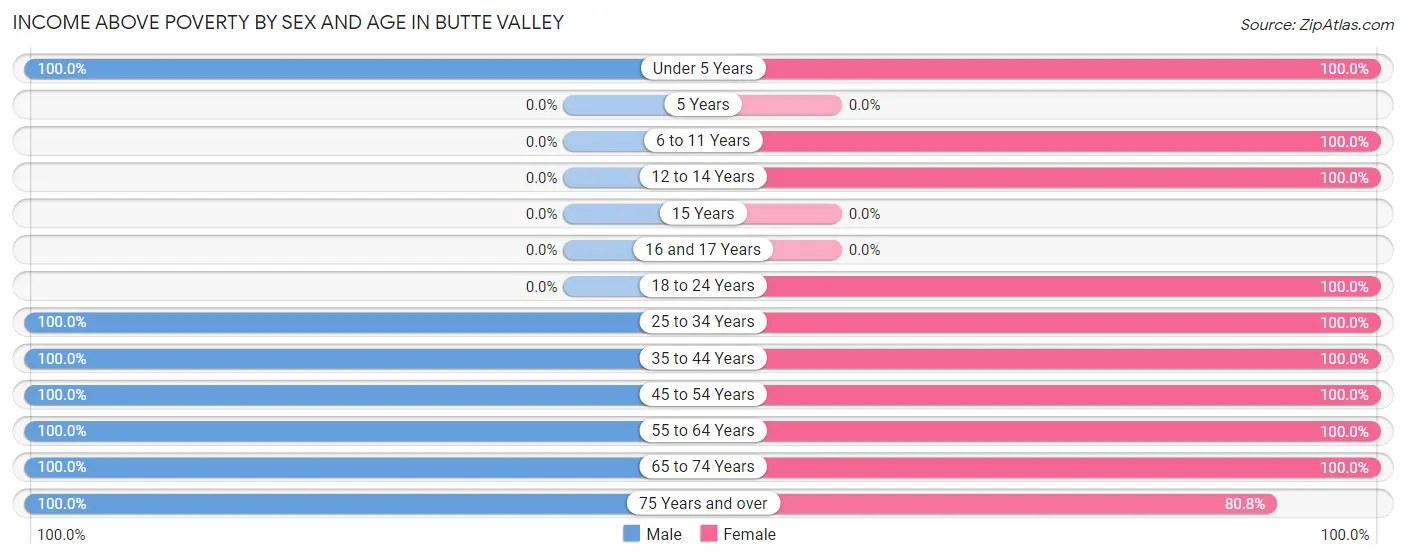
| Age Bracket | Male | Female |
| Under 5 Years | 21 (100.0%) | 21 (100.0%) |
| 5 Years | 0 (0.0%) | 0 (0.0%) |
| 6 to 11 Years | 0 (0.0%) | 44 (100.0%) |
| 12 to 14 Years | 0 (0.0%) | 26 (100.0%) |
| 15 Years | 0 (0.0%) | 0 (0.0%) |
| 16 and 17 Years | 0 (0.0%) | 0 (0.0%) |
| 18 to 24 Years | 0 (0.0%) | 4 (100.0%) |
| 25 to 34 Years | 53 (100.0%) | 25 (100.0%) |
| 35 to 44 Years | 5 (100.0%) | 8 (100.0%) |
| 45 to 54 Years | 62 (100.0%) | 17 (100.0%) |
| 55 to 64 Years | 39 (100.0%) | 122 (100.0%) |
| 65 to 74 Years | 26 (100.0%) | 216 (100.0%) |
| 75 Years and over | 43 (100.0%) | 63 (80.8%) |
| Total | 249 (100.0%) | 546 (97.3%) |
Income Below Poverty Among Married-Couple Families in Butte Valley
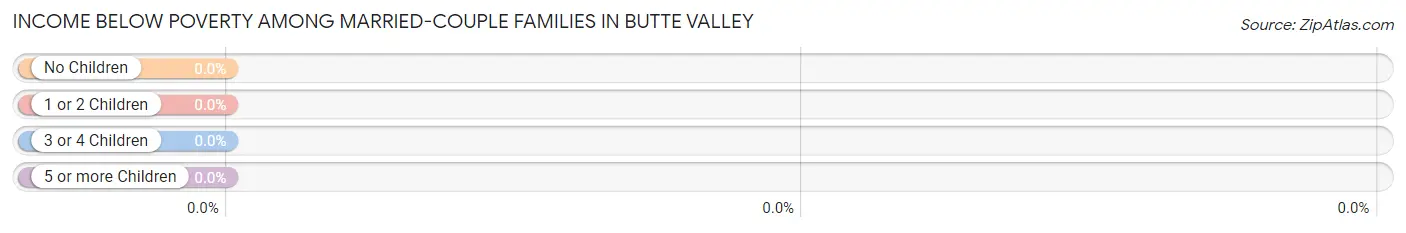
| Children | Above Poverty | Below Poverty |
| No Children | 83 (100.0%) | 0 (0.0%) |
| 1 or 2 Children | 58 (100.0%) | 0 (0.0%) |
| 3 or 4 Children | 65 (100.0%) | 0 (0.0%) |
| 5 or more Children | 0 (0.0%) | 0 (0.0%) |
| Total | 206 (100.0%) | 0 (0.0%) |
Income Below Poverty Among Single-Parent Households in Butte Valley
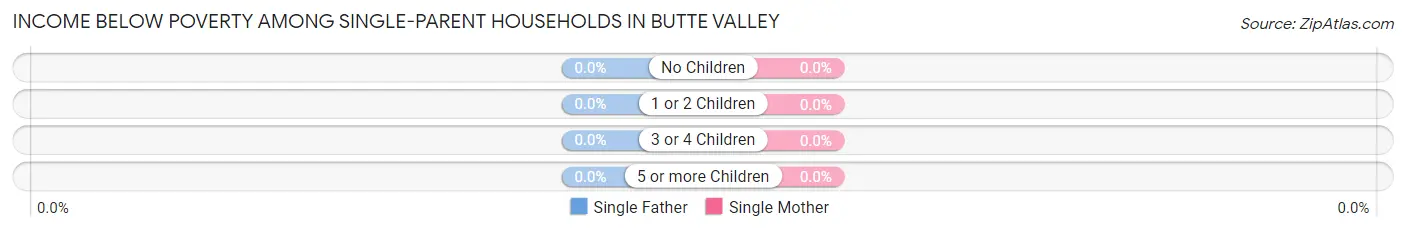
| Children | Single Father | Single Mother |
| No Children | 0 (0.0%) | 0 (0.0%) |
| 1 or 2 Children | 0 (0.0%) | 0 (0.0%) |
| 3 or 4 Children | 0 (0.0%) | 0 (0.0%) |
| 5 or more Children | 0 (0.0%) | 0 (0.0%) |
| Total | 0 (0.0%) | 0 (0.0%) |
Income Below Poverty Among Married-Couple vs Single-Parent Households in Butte Valley
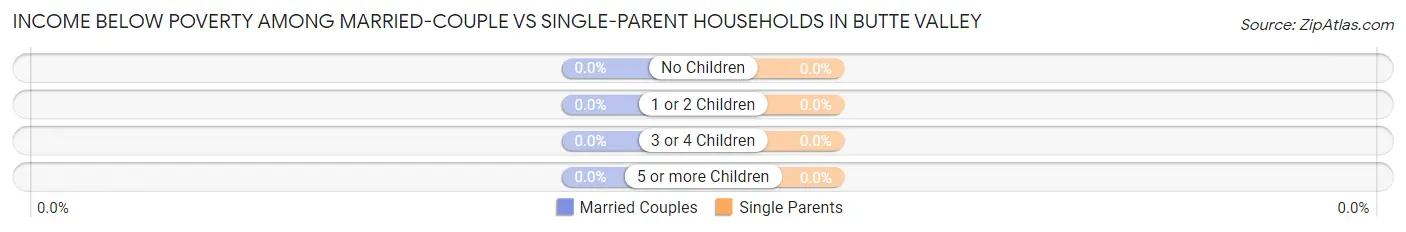
| Children | Married-Couple Families | Single-Parent Households |
| No Children | 0 (0.0%) | 0 (0.0%) |
| 1 or 2 Children | 0 (0.0%) | 0 (0.0%) |
| 3 or 4 Children | 0 (0.0%) | 0 (0.0%) |
| 5 or more Children | 0 (0.0%) | 0 (0.0%) |
| Total | 0 (0.0%) | 0 (0.0%) |
Race in Butte Valley
The most populous races in Butte Valley are White / Caucasian (642 | 79.2%), Two or more Races (169 | 20.8%), and Hispanic or Latino (12 | 1.5%).
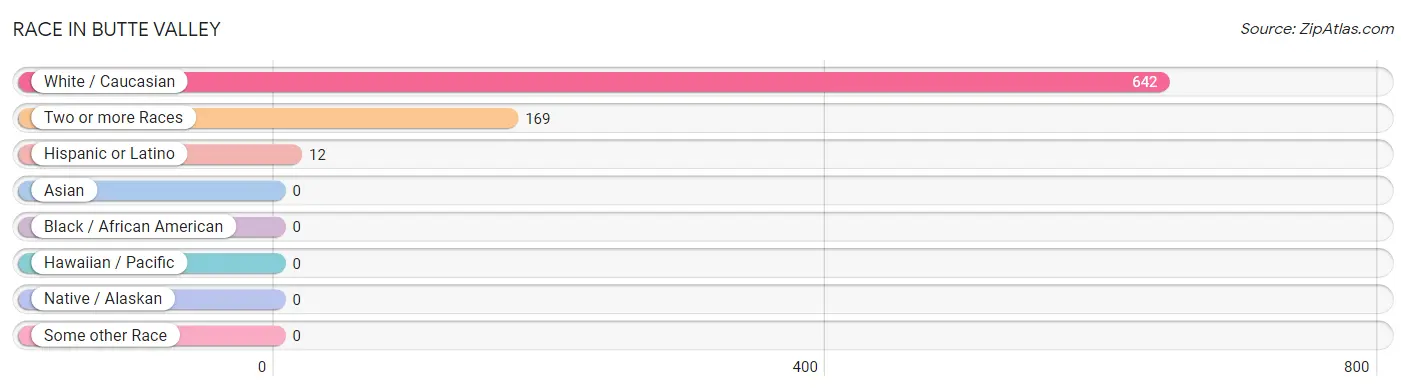
| Race | # Population | % Population |
| Asian | 0 | 0.0% |
| Black / African American | 0 | 0.0% |
| Hawaiian / Pacific | 0 | 0.0% |
| Hispanic or Latino | 12 | 1.5% |
| Native / Alaskan | 0 | 0.0% |
| White / Caucasian | 642 | 79.2% |
| Two or more Races | 169 | 20.8% |
| Some other Race | 0 | 0.0% |
| Total | 811 | 100.0% |
Ancestry in Butte Valley
The most populous ancestries reported in Butte Valley are German (220 | 27.1%), Irish (167 | 20.6%), Italian (130 | 16.0%), Dutch (110 | 13.6%), and Sioux (78 | 9.6%), together accounting for 86.9% of all Butte Valley residents.
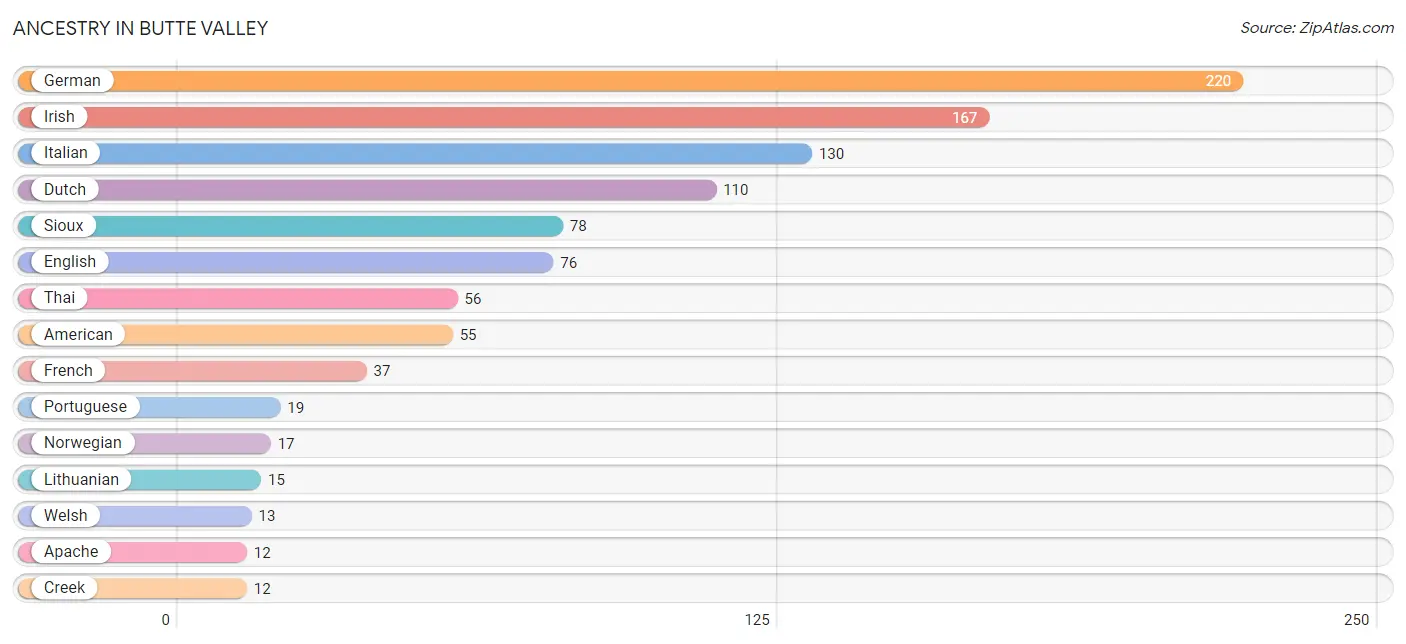
| Ancestry | # Population | % Population |
| American | 55 | 6.8% |
| Apache | 12 | 1.5% |
| British | 7 | 0.9% |
| Creek | 12 | 1.5% |
| Dutch | 110 | 13.6% |
| English | 76 | 9.4% |
| French | 37 | 4.6% |
| German | 220 | 27.1% |
| Hungarian | 3 | 0.4% |
| Irish | 167 | 20.6% |
| Italian | 130 | 16.0% |
| Lithuanian | 15 | 1.8% |
| Norwegian | 17 | 2.1% |
| Portuguese | 19 | 2.3% |
| Scandinavian | 5 | 0.6% |
| Scottish | 12 | 1.5% |
| Sioux | 78 | 9.6% |
| Spaniard | 12 | 1.5% |
| Thai | 56 | 6.9% |
| Welsh | 13 | 1.6% | View All 20 Rows |
Immigrants in Butte Valley
The most numerous immigrant groups reported in Butte Valley came from Eastern Europe (3 | 0.4%), Europe (3 | 0.4%), and Hungary (3 | 0.4%), together accounting for 1.1% of all Butte Valley residents.
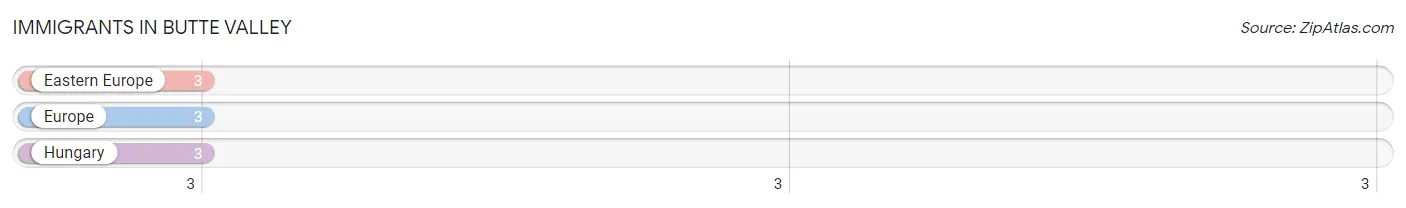
| Immigration Origin | # Population | % Population |
| Eastern Europe | 3 | 0.4% |
| Europe | 3 | 0.4% |
| Hungary | 3 | 0.4% | View All 3 Rows |
Sex and Age in Butte Valley
Sex and Age in Butte Valley
The most populous age groups in Butte Valley are 45 to 49 Years (62 | 24.8%) for men and 65 to 69 Years (196 | 34.9%) for women.
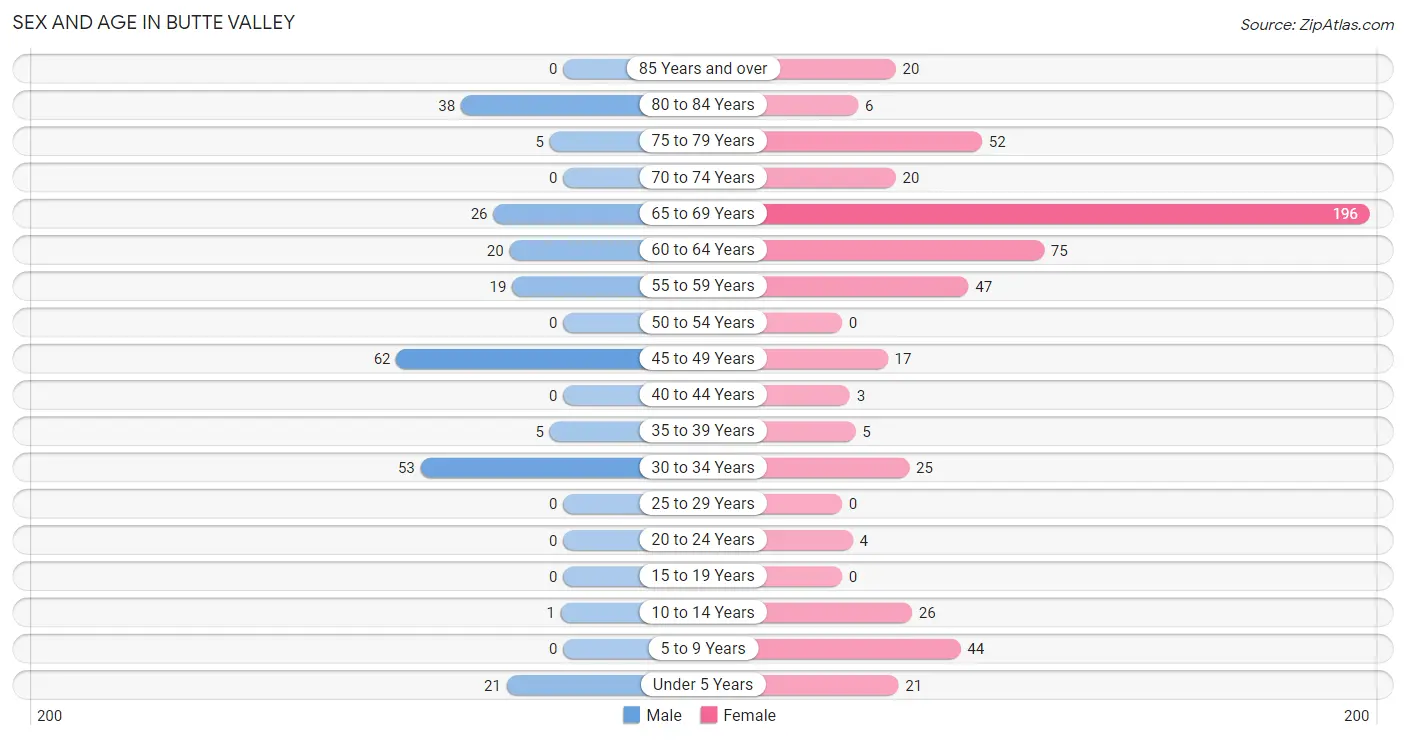
| Age Bracket | Male | Female |
| Under 5 Years | 21 (8.4%) | 21 (3.7%) |
| 5 to 9 Years | 0 (0.0%) | 44 (7.8%) |
| 10 to 14 Years | 1 (0.4%) | 26 (4.6%) |
| 15 to 19 Years | 0 (0.0%) | 0 (0.0%) |
| 20 to 24 Years | 0 (0.0%) | 4 (0.7%) |
| 25 to 29 Years | 0 (0.0%) | 0 (0.0%) |
| 30 to 34 Years | 53 (21.2%) | 25 (4.5%) |
| 35 to 39 Years | 5 (2.0%) | 5 (0.9%) |
| 40 to 44 Years | 0 (0.0%) | 3 (0.5%) |
| 45 to 49 Years | 62 (24.8%) | 17 (3.0%) |
| 50 to 54 Years | 0 (0.0%) | 0 (0.0%) |
| 55 to 59 Years | 19 (7.6%) | 47 (8.4%) |
| 60 to 64 Years | 20 (8.0%) | 75 (13.4%) |
| 65 to 69 Years | 26 (10.4%) | 196 (34.9%) |
| 70 to 74 Years | 0 (0.0%) | 20 (3.6%) |
| 75 to 79 Years | 5 (2.0%) | 52 (9.3%) |
| 80 to 84 Years | 38 (15.2%) | 6 (1.1%) |
| 85 Years and over | 0 (0.0%) | 20 (3.6%) |
| Total | 250 (100.0%) | 561 (100.0%) |
Families and Households in Butte Valley
Median Family Size in Butte Valley
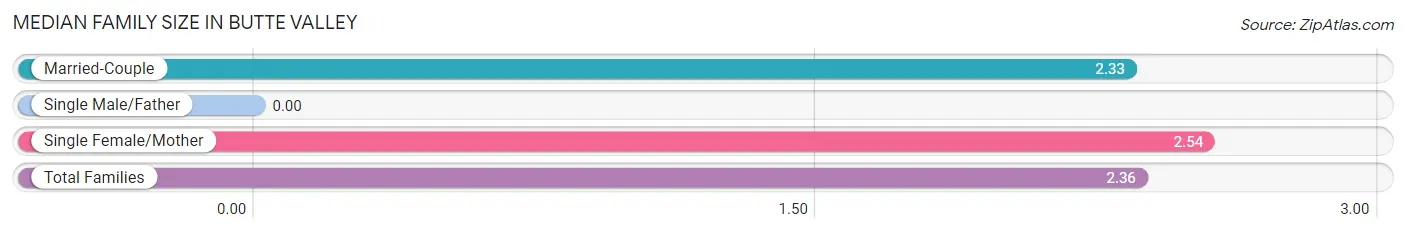
| Family Type | # Families | Family Size |
| Married-Couple | 206 (89.6%) | 2.33 |
| Single Male/Father | 0 (0.0%) | - |
| Single Female/Mother | 24 (10.4%) | 2.54 |
| Total Families | 230 (100.0%) | 2.36 |
Median Household Size in Butte Valley
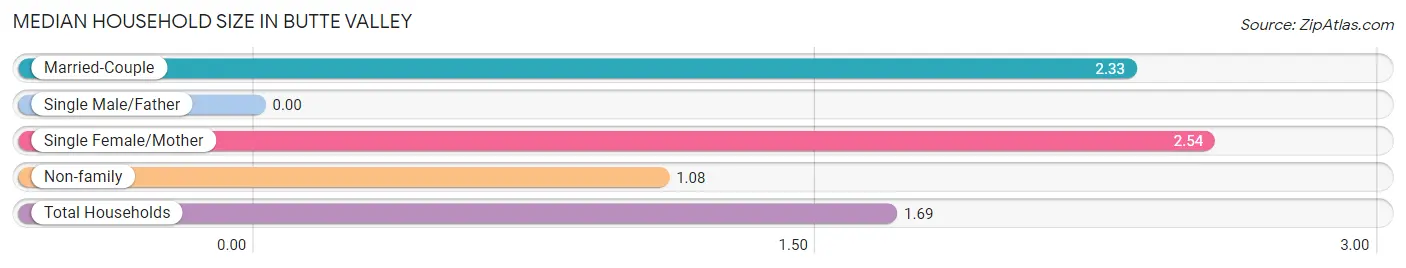
| Household Type | # Households | Household Size |
| Married-Couple | 206 (43.0%) | 2.33 |
| Single Male/Father | 0 (0.0%) | - |
| Single Female/Mother | 24 (5.0%) | 2.54 |
| Non-family | 249 (52.0%) | 1.08 |
| Total Households | 479 (100.0%) | 1.69 |
Household Size by Marriage Status in Butte Valley
Out of a total of 479 households in Butte Valley, 230 (48.0%) are family households, while 249 (52.0%) are nonfamily households. The most numerous type of family households are 5-person households, comprising 115, and the most common type of nonfamily households are 1-person households, comprising 237.
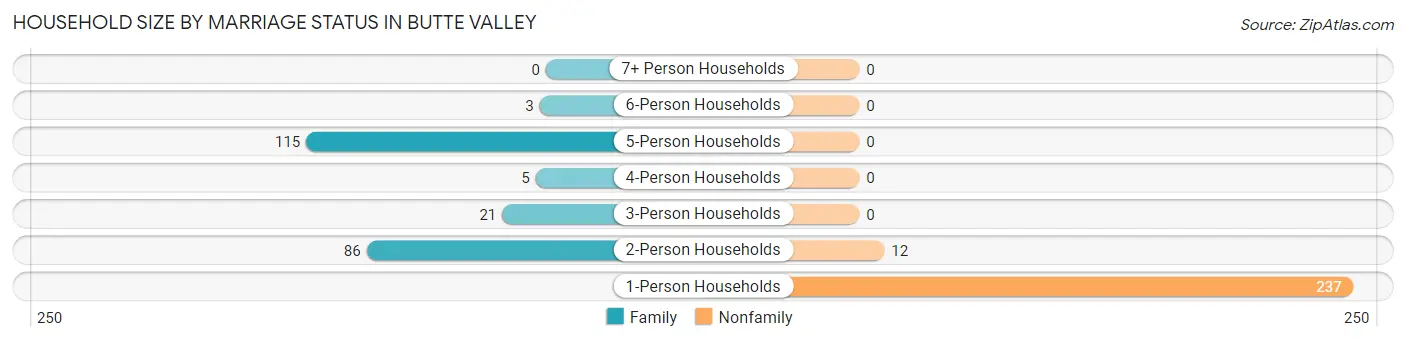
| Household Size | Family Households | Nonfamily Households |
| 1-Person Households | - | 237 (49.5%) |
| 2-Person Households | 86 (17.9%) | 12 (2.5%) |
| 3-Person Households | 21 (4.4%) | 0 (0.0%) |
| 4-Person Households | 5 (1.0%) | 0 (0.0%) |
| 5-Person Households | 115 (24.0%) | 0 (0.0%) |
| 6-Person Households | 3 (0.6%) | 0 (0.0%) |
| 7+ Person Households | 0 (0.0%) | 0 (0.0%) |
| Total | 230 (48.0%) | 249 (52.0%) |
Female Fertility in Butte Valley
Fertility by Age in Butte Valley
Average fertility rate in Butte Valley is 556.0 births per 1,000 women. Women in the age bracket of 20 to 34 years have the highest fertility rate with 862.0 births per 1,000 women. Women in the age bracket of 20 to 34 years acount for 83.3% of all women with births.
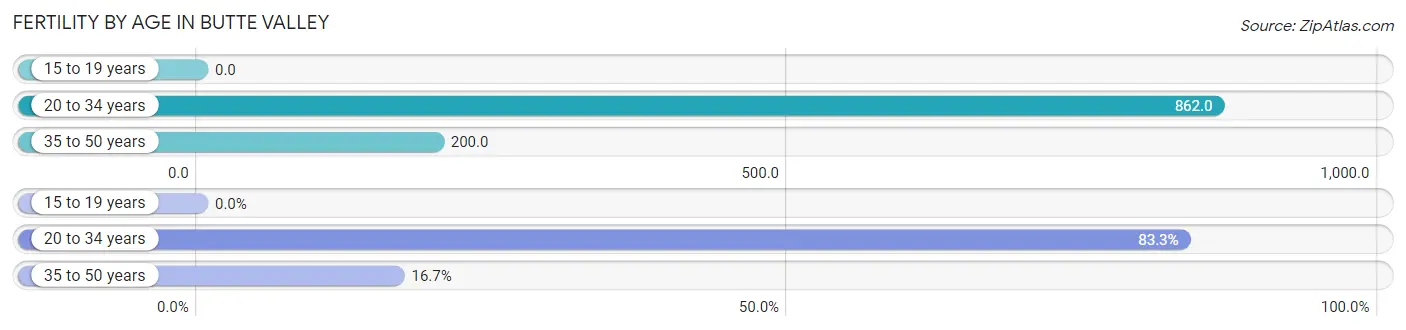
| Age Bracket | Women with Births | Births / 1,000 Women |
| 15 to 19 years | 0 (0.0%) | 0.0 |
| 20 to 34 years | 25 (83.3%) | 862.0 |
| 35 to 50 years | 5 (16.7%) | 200.0 |
| Total | 30 (100.0%) | 556.0 |
Fertility by Age by Marriage Status in Butte Valley
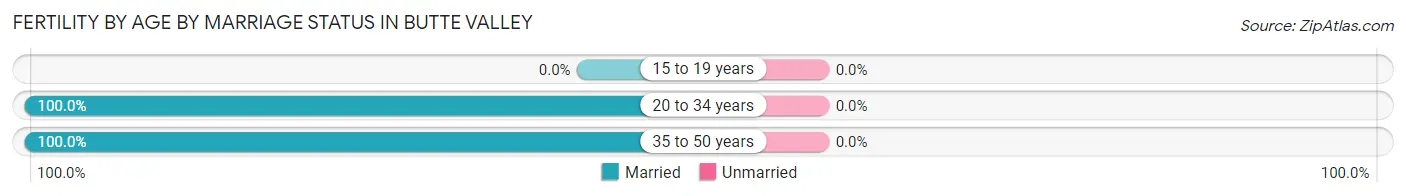
| Age Bracket | Married | Unmarried |
| 15 to 19 years | 0 (0.0%) | 0 (0.0%) |
| 20 to 34 years | 25 (100.0%) | 0 (0.0%) |
| 35 to 50 years | 5 (100.0%) | 0 (0.0%) |
| Total | 30 (100.0%) | 0 (0.0%) |
Fertility by Education in Butte Valley
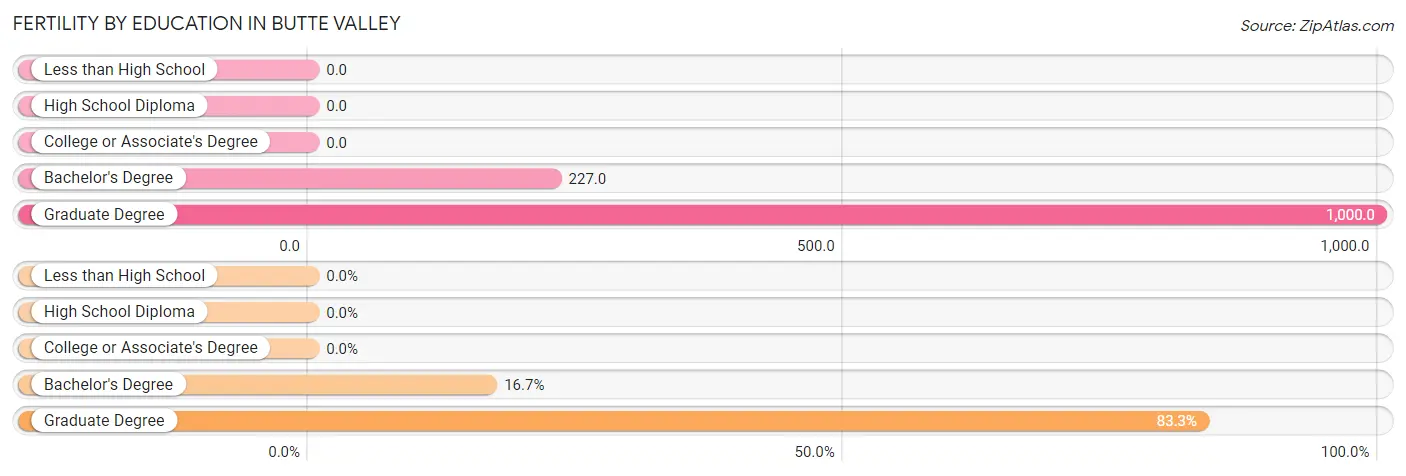
| Educational Attainment | Women with Births | Births / 1,000 Women |
| Less than High School | 0 (0.0%) | 0.0 |
| High School Diploma | 0 (0.0%) | 0.0 |
| College or Associate's Degree | 0 (0.0%) | 0.0 |
| Bachelor's Degree | 5 (16.7%) | 227.0 |
| Graduate Degree | 25 (83.3%) | 1,000.0 |
| Total | 30 (100.0%) | 556.0 |
Fertility by Education by Marriage Status in Butte Valley
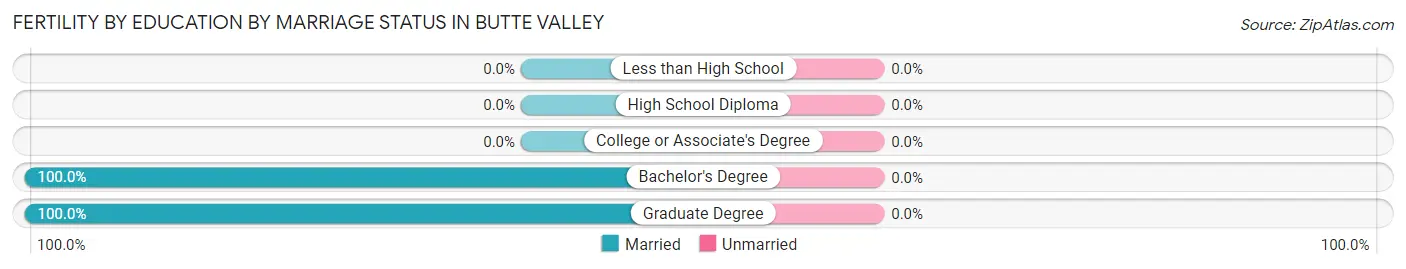
| Educational Attainment | Married | Unmarried |
| Less than High School | 0 (0.0%) | 0 (0.0%) |
| High School Diploma | 0 (0.0%) | 0 (0.0%) |
| College or Associate's Degree | 0 (0.0%) | 0 (0.0%) |
| Bachelor's Degree | 5 (100.0%) | 0 (0.0%) |
| Graduate Degree | 25 (100.0%) | 0 (0.0%) |
| Total | 30 (100.0%) | 0 (0.0%) |
Employment Characteristics in Butte Valley
Employment by Class of Employer in Butte Valley
Among the 259 employed individuals in Butte Valley, self-employed (not incorporated) (122 | 47.1%), private company employees (56 | 21.6%), and state government employees (47 | 18.1%) make up the most common classes of employment.
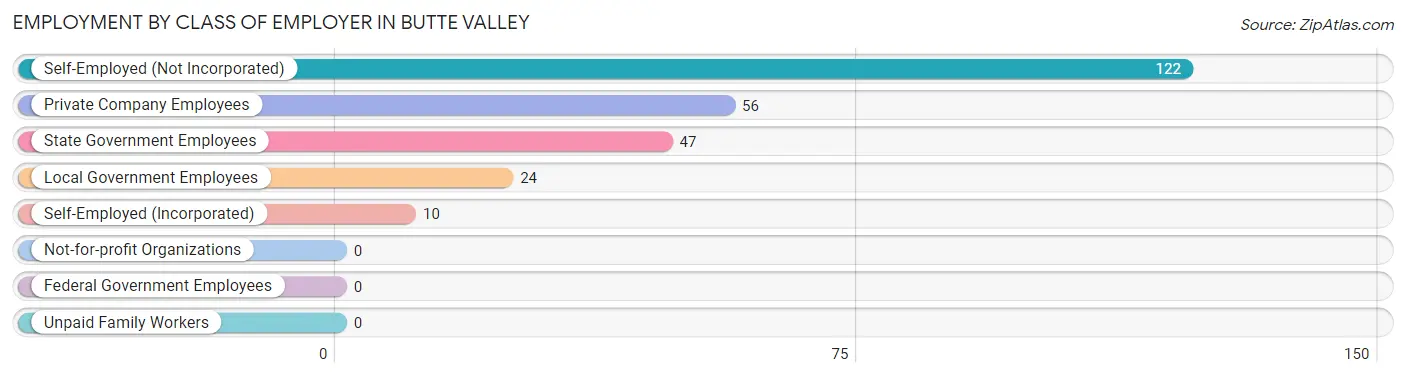
| Employer Class | # Employees | % Employees |
| Private Company Employees | 56 | 21.6% |
| Self-Employed (Incorporated) | 10 | 3.9% |
| Self-Employed (Not Incorporated) | 122 | 47.1% |
| Not-for-profit Organizations | 0 | 0.0% |
| Local Government Employees | 24 | 9.3% |
| State Government Employees | 47 | 18.1% |
| Federal Government Employees | 0 | 0.0% |
| Unpaid Family Workers | 0 | 0.0% |
| Total | 259 | 100.0% |
Employment Status by Age in Butte Valley
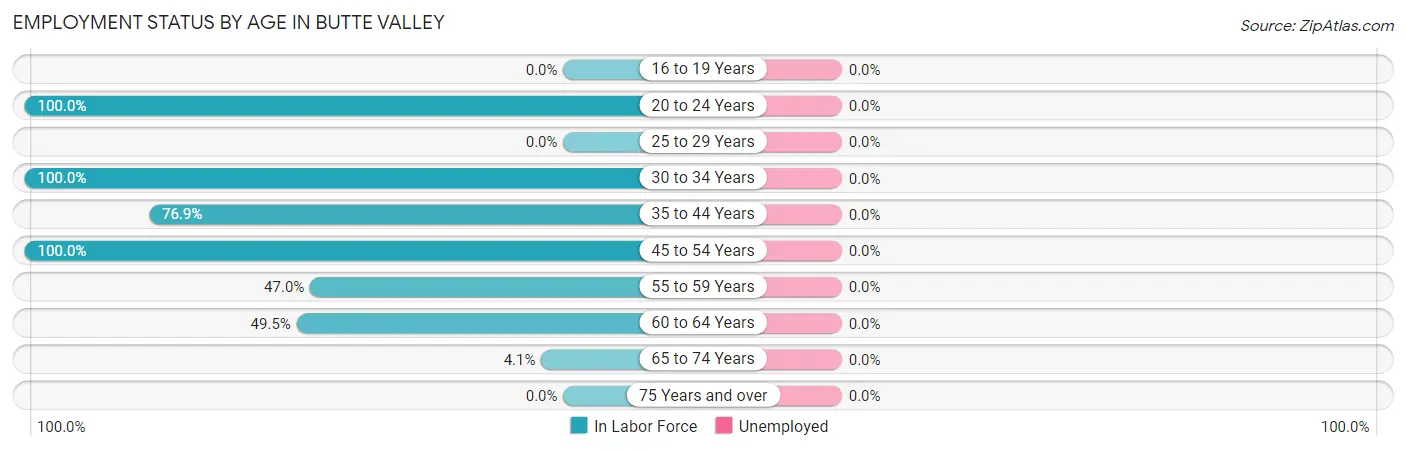
| Age Bracket | In Labor Force | Unemployed |
| 16 to 19 Years | 0 (0.0%) | 0 (0.0%) |
| 20 to 24 Years | 4 (100.0%) | 0 (0.0%) |
| 25 to 29 Years | 0 (0.0%) | 0 (0.0%) |
| 30 to 34 Years | 78 (100.0%) | 0 (0.0%) |
| 35 to 44 Years | 10 (76.9%) | 0 (0.0%) |
| 45 to 54 Years | 79 (100.0%) | 0 (0.0%) |
| 55 to 59 Years | 31 (47.0%) | 0 (0.0%) |
| 60 to 64 Years | 47 (49.5%) | 0 (0.0%) |
| 65 to 74 Years | 10 (4.1%) | 0 (0.0%) |
| 75 Years and over | 0 (0.0%) | 0 (0.0%) |
| Total | 259 (37.1%) | 0 (0.0%) |
Employment Status by Educational Attainment in Butte Valley
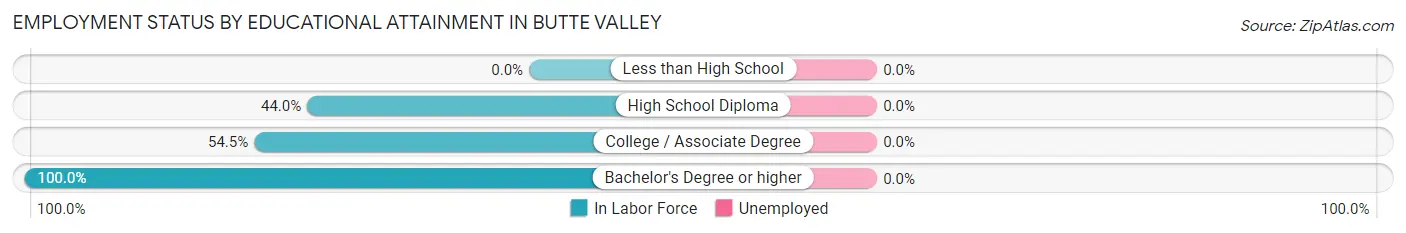
| Educational Attainment | In Labor Force | Unemployed |
| Less than High School | 0 (0.0%) | 0 (0.0%) |
| High School Diploma | 22 (44.0%) | 0 (0.0%) |
| College / Associate Degree | 48 (54.5%) | 0 (0.0%) |
| Bachelor's Degree or higher | 175 (100.0%) | 0 (0.0%) |
| Total | 245 (74.0%) | 0 (0.0%) |
Employment Occupations by Sex in Butte Valley
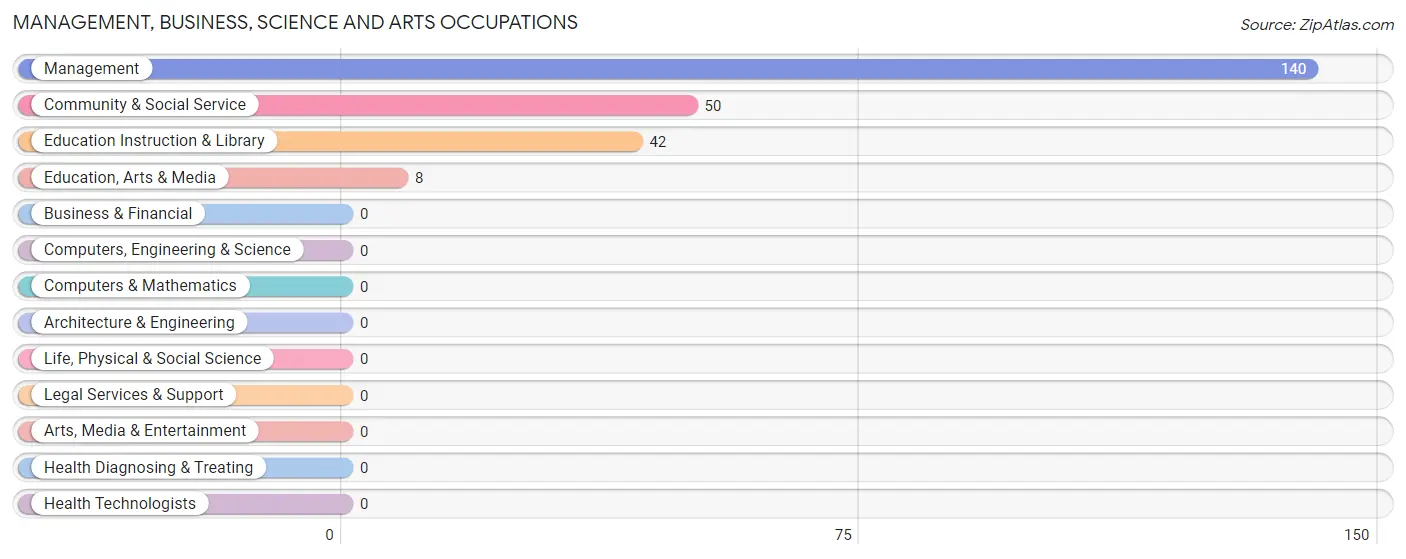
Management, Business, Science and Arts Occupations
The most common Management, Business, Science and Arts occupations in Butte Valley are Management (140 | 54.0%), Community & Social Service (50 | 19.3%), Education Instruction & Library (42 | 16.2%), and Education, Arts & Media (8 | 3.1%).
Management, Business, Science and Arts Occupations by Sex
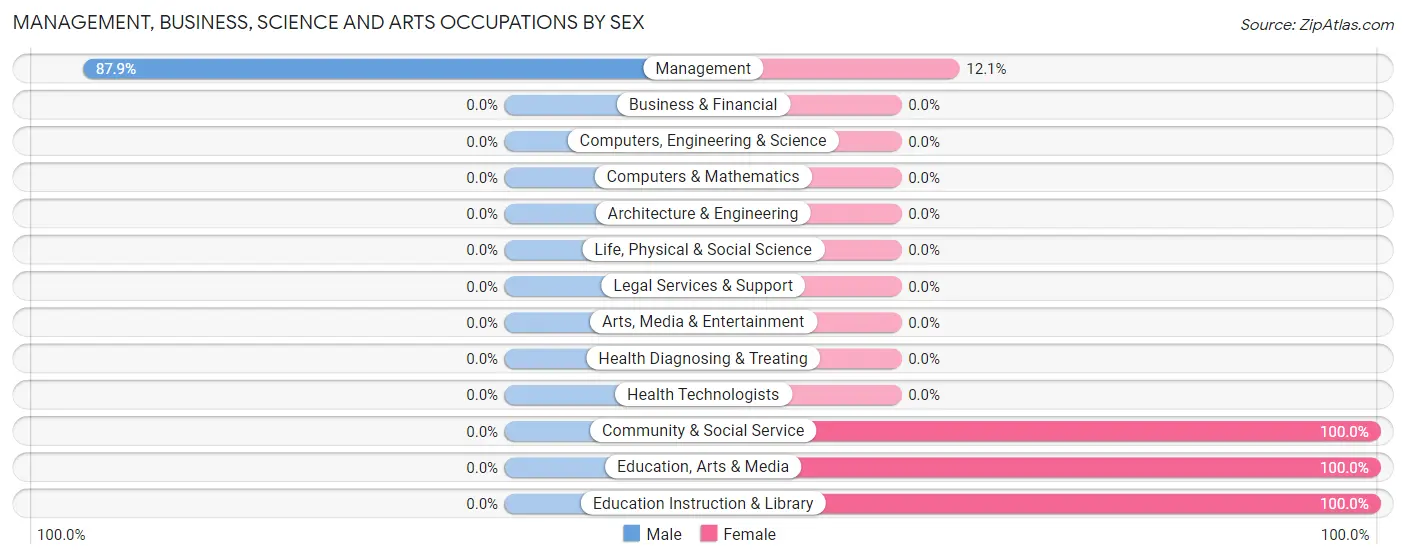
| Occupation | Male | Female |
| Management | 123 (87.9%) | 17 (12.1%) |
| Business & Financial | 0 (0.0%) | 0 (0.0%) |
| Computers, Engineering & Science | 0 (0.0%) | 0 (0.0%) |
| Computers & Mathematics | 0 (0.0%) | 0 (0.0%) |
| Architecture & Engineering | 0 (0.0%) | 0 (0.0%) |
| Life, Physical & Social Science | 0 (0.0%) | 0 (0.0%) |
| Community & Social Service | 0 (0.0%) | 50 (100.0%) |
| Education, Arts & Media | 0 (0.0%) | 8 (100.0%) |
| Legal Services & Support | 0 (0.0%) | 0 (0.0%) |
| Education Instruction & Library | 0 (0.0%) | 42 (100.0%) |
| Arts, Media & Entertainment | 0 (0.0%) | 0 (0.0%) |
| Health Diagnosing & Treating | 0 (0.0%) | 0 (0.0%) |
| Health Technologists | 0 (0.0%) | 0 (0.0%) |
| Total (Category) | 123 (64.7%) | 67 (35.3%) |
| Total (Overall) | 142 (54.8%) | 117 (45.2%) |
Services Occupations
The most common Services occupations in Butte Valley are , and Cleaning & Maintenance (26 | 10.0%).
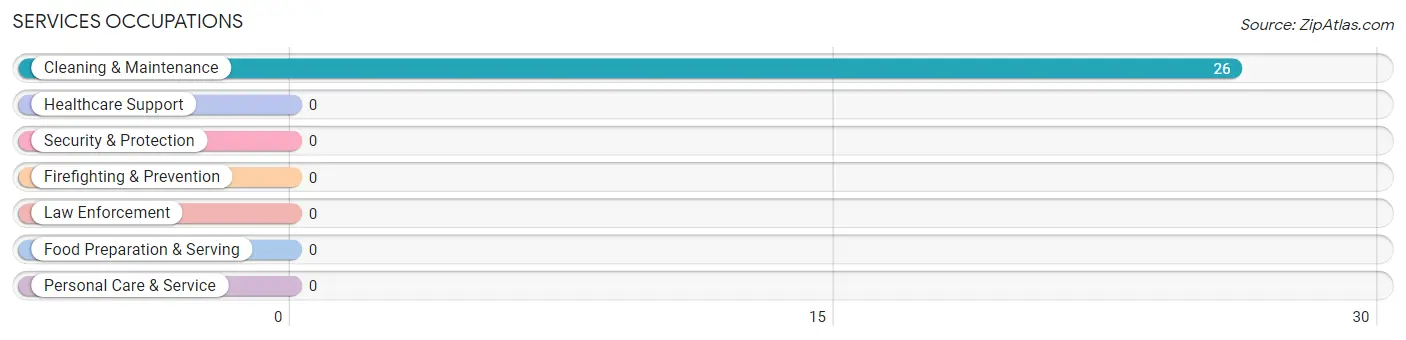
Services Occupations by Sex
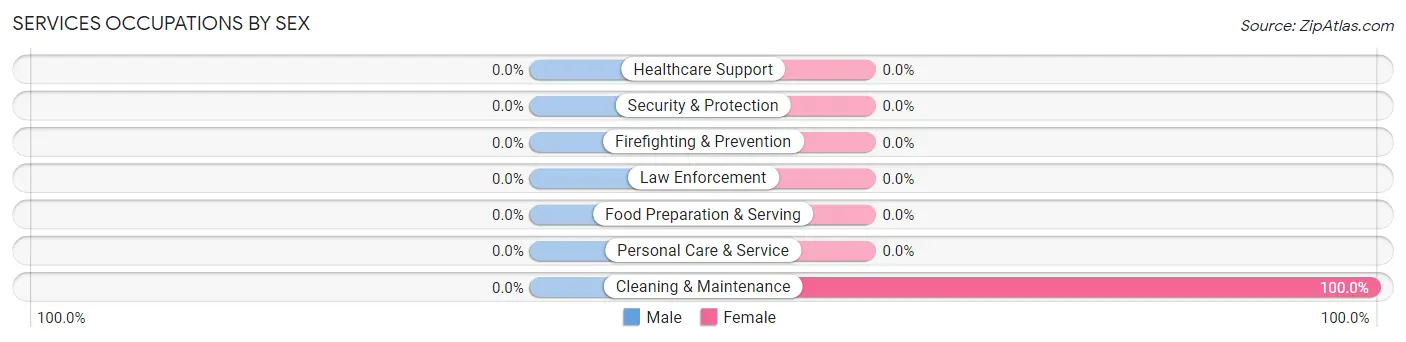
| Occupation | Male | Female |
| Healthcare Support | 0 (0.0%) | 0 (0.0%) |
| Security & Protection | 0 (0.0%) | 0 (0.0%) |
| Firefighting & Prevention | 0 (0.0%) | 0 (0.0%) |
| Law Enforcement | 0 (0.0%) | 0 (0.0%) |
| Food Preparation & Serving | 0 (0.0%) | 0 (0.0%) |
| Cleaning & Maintenance | 0 (0.0%) | 26 (100.0%) |
| Personal Care & Service | 0 (0.0%) | 0 (0.0%) |
| Total (Category) | 0 (0.0%) | 26 (100.0%) |
| Total (Overall) | 142 (54.8%) | 117 (45.2%) |
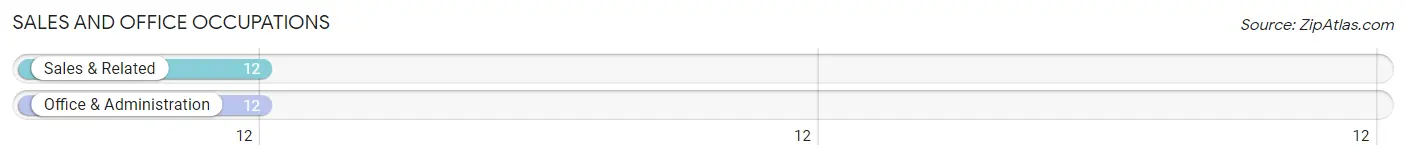
Sales and Office Occupations
The most common Sales and Office occupations in Butte Valley are Sales & Related (12 | 4.6%), and Office & Administration (12 | 4.6%).
Sales and Office Occupations by Sex
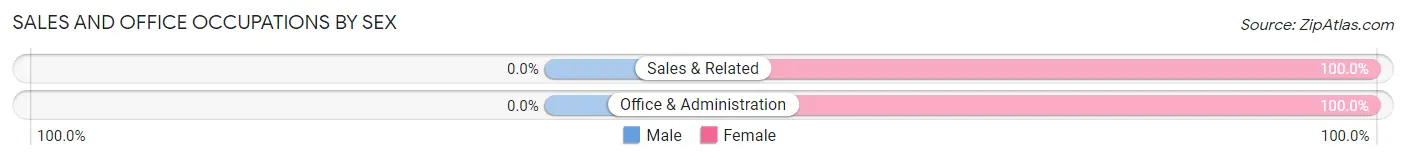
| Occupation | Male | Female |
| Sales & Related | 0 (0.0%) | 12 (100.0%) |
| Office & Administration | 0 (0.0%) | 12 (100.0%) |
| Total (Category) | 0 (0.0%) | 24 (100.0%) |
| Total (Overall) | 142 (54.8%) | 117 (45.2%) |
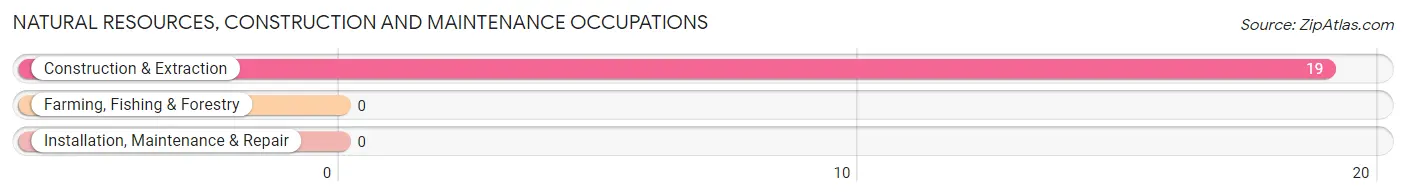
Natural Resources, Construction and Maintenance Occupations
The most common Natural Resources, Construction and Maintenance occupations in Butte Valley are , and Construction & Extraction (19 | 7.3%).
Natural Resources, Construction and Maintenance Occupations by Sex
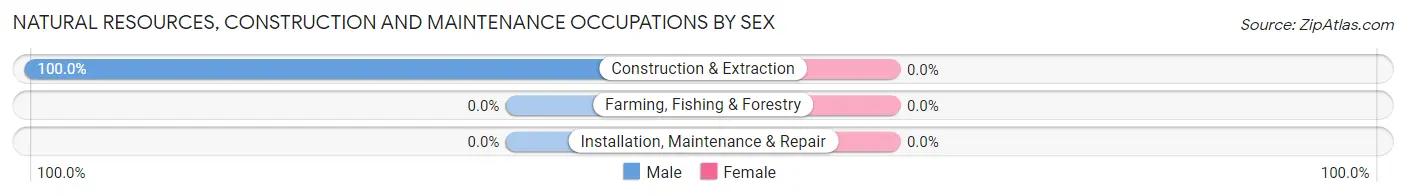
| Occupation | Male | Female |
| Farming, Fishing & Forestry | 0 (0.0%) | 0 (0.0%) |
| Construction & Extraction | 19 (100.0%) | 0 (0.0%) |
| Installation, Maintenance & Repair | 0 (0.0%) | 0 (0.0%) |
| Total (Category) | 19 (100.0%) | 0 (0.0%) |
| Total (Overall) | 142 (54.8%) | 117 (45.2%) |
Production, Transportation and Moving Occupations
Production, Transportation and Moving Occupations by Sex
| Occupation | Male | Female |
| Production | 0 (0.0%) | 0 (0.0%) |
| Transportation | 0 (0.0%) | 0 (0.0%) |
| Material Moving | 0 (0.0%) | 0 (0.0%) |
| Total (Category) | 0 (0.0%) | 0 (0.0%) |
| Total (Overall) | 142 (54.8%) | 117 (45.2%) |
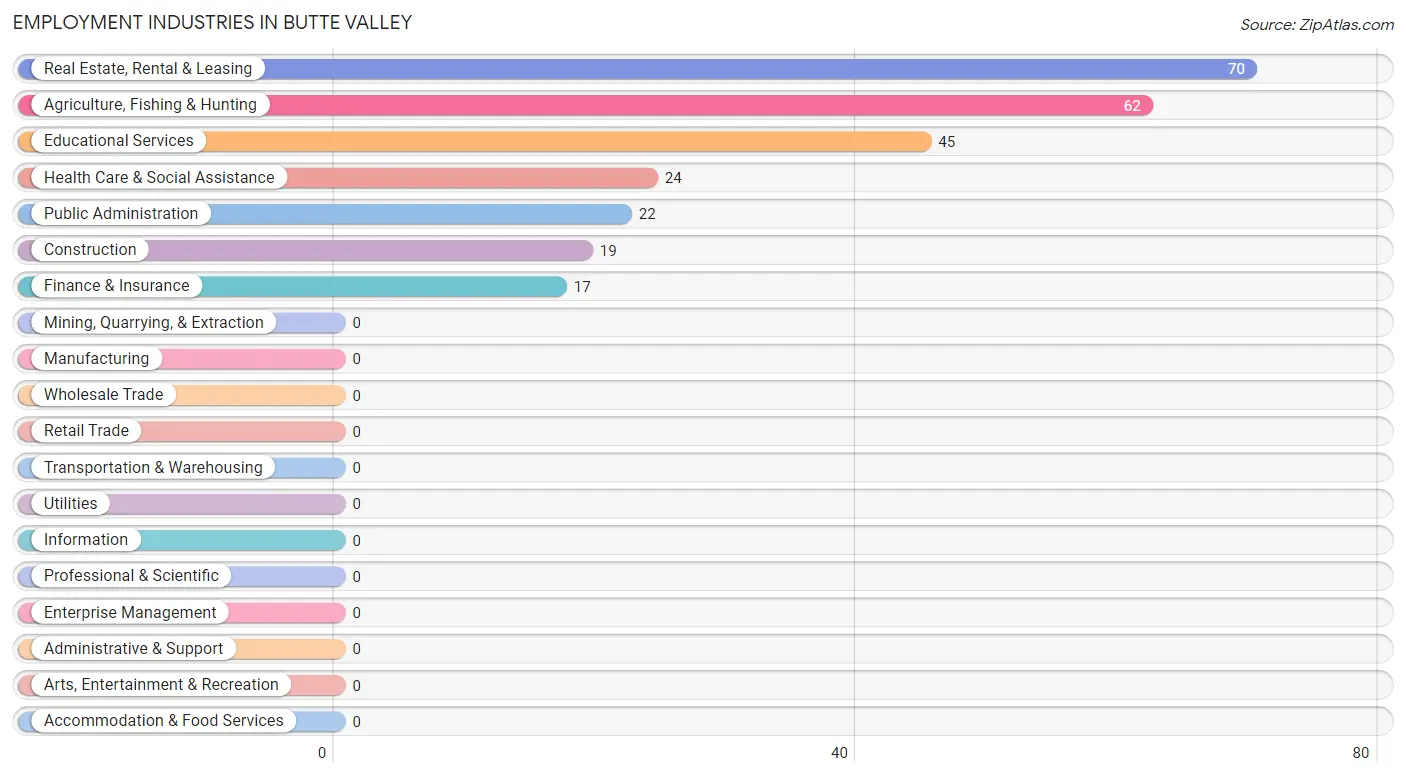
Employment Industries by Sex in Butte Valley
Employment Industries in Butte Valley
The major employment industries in Butte Valley include Real Estate, Rental & Leasing (70 | 27.0%), Agriculture, Fishing & Hunting (62 | 23.9%), Educational Services (45 | 17.4%), Health Care & Social Assistance (24 | 9.3%), and Public Administration (22 | 8.5%).
Employment Industries by Sex in Butte Valley
The Butte Valley industries that see more men than women are Agriculture, Fishing & Hunting (100.0%), Construction (100.0%), and Real Estate, Rental & Leasing (82.9%), whereas the industries that tend to have a higher number of women are Finance & Insurance (100.0%), Health Care & Social Assistance (100.0%), and Public Administration (100.0%).
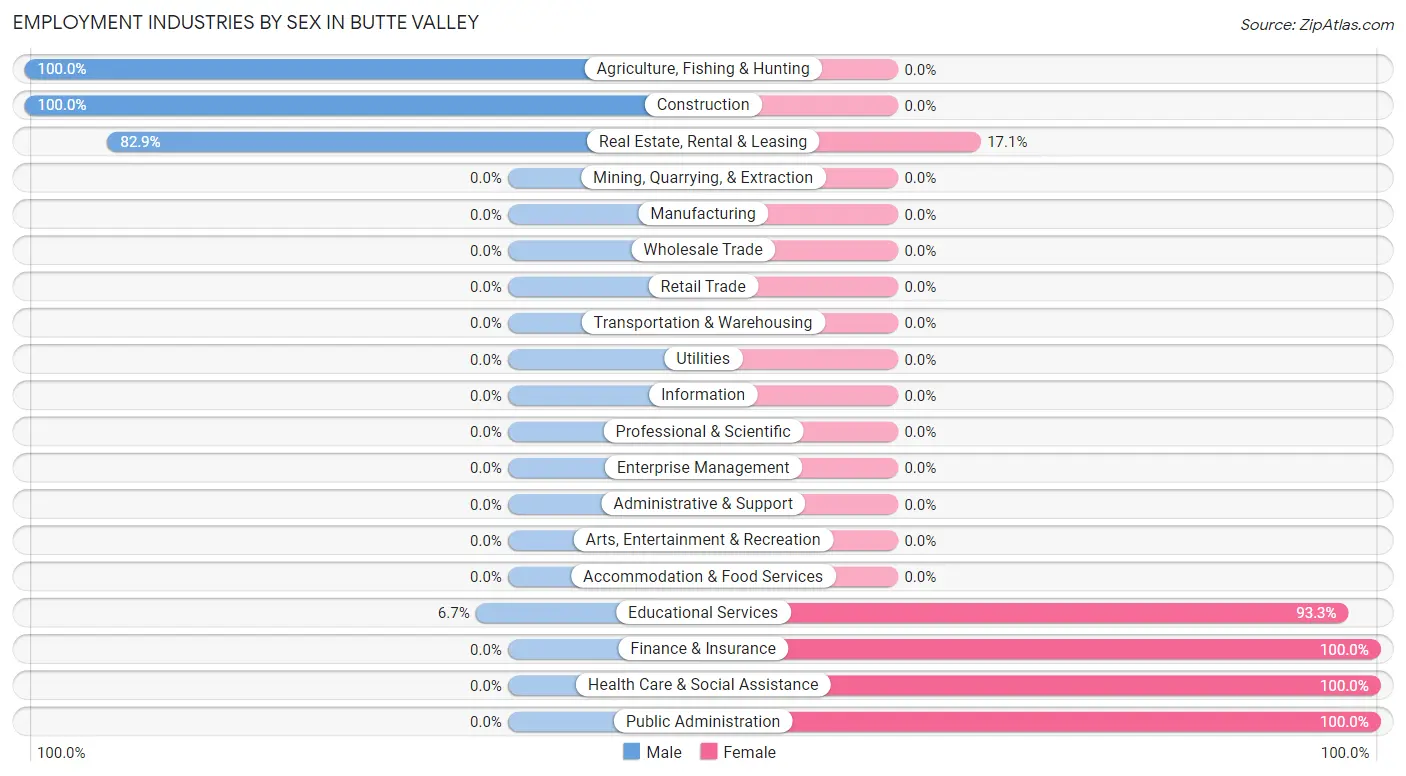
| Industry | Male | Female |
| Agriculture, Fishing & Hunting | 62 (100.0%) | 0 (0.0%) |
| Mining, Quarrying, & Extraction | 0 (0.0%) | 0 (0.0%) |
| Construction | 19 (100.0%) | 0 (0.0%) |
| Manufacturing | 0 (0.0%) | 0 (0.0%) |
| Wholesale Trade | 0 (0.0%) | 0 (0.0%) |
| Retail Trade | 0 (0.0%) | 0 (0.0%) |
| Transportation & Warehousing | 0 (0.0%) | 0 (0.0%) |
| Utilities | 0 (0.0%) | 0 (0.0%) |
| Information | 0 (0.0%) | 0 (0.0%) |
| Finance & Insurance | 0 (0.0%) | 17 (100.0%) |
| Real Estate, Rental & Leasing | 58 (82.9%) | 12 (17.1%) |
| Professional & Scientific | 0 (0.0%) | 0 (0.0%) |
| Enterprise Management | 0 (0.0%) | 0 (0.0%) |
| Administrative & Support | 0 (0.0%) | 0 (0.0%) |
| Educational Services | 3 (6.7%) | 42 (93.3%) |
| Health Care & Social Assistance | 0 (0.0%) | 24 (100.0%) |
| Arts, Entertainment & Recreation | 0 (0.0%) | 0 (0.0%) |
| Accommodation & Food Services | 0 (0.0%) | 0 (0.0%) |
| Public Administration | 0 (0.0%) | 22 (100.0%) |
| Total | 142 (54.8%) | 117 (45.2%) |
Education in Butte Valley
School Enrollment in Butte Valley
The most common levels of schooling among the 92 students in Butte Valley are elementary school (44 | 47.8%), middle school (23 | 25.0%), and college / undergraduate (21 | 22.8%).
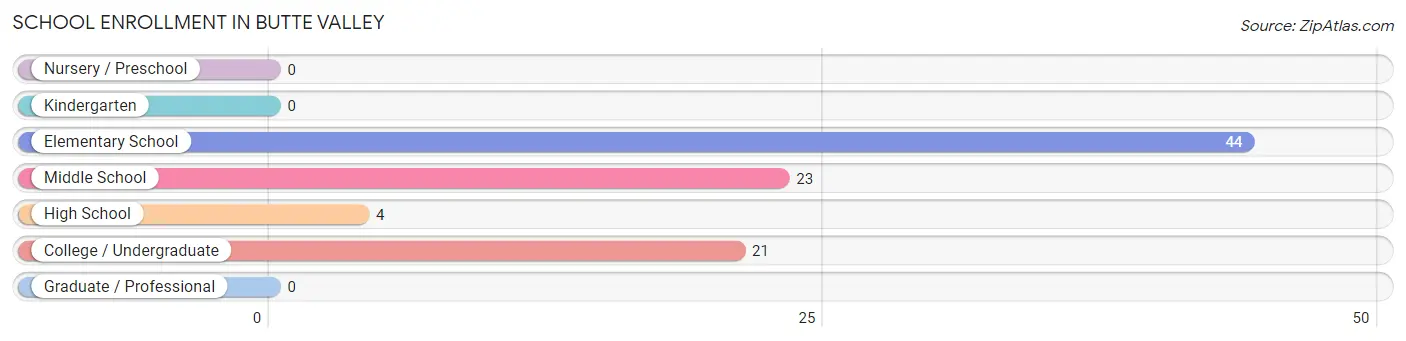
| School Level | # Students | % Students |
| Nursery / Preschool | 0 | 0.0% |
| Kindergarten | 0 | 0.0% |
| Elementary School | 44 | 47.8% |
| Middle School | 23 | 25.0% |
| High School | 4 | 4.3% |
| College / Undergraduate | 21 | 22.8% |
| Graduate / Professional | 0 | 0.0% |
| Total | 92 | 100.0% |
School Enrollment by Age by Funding Source in Butte Valley
Out of a total of 92 students who are enrolled in schools in Butte Valley, 17 (18.5%) attend a private institution, while the remaining 75 (81.5%) are enrolled in public schools. The age group of 35 years and over has the highest likelihood of being enrolled in private schools, with 17 (100.0% in the age bracket) enrolled. Conversely, the age group of 5 to 9 year old has the lowest likelihood of being enrolled in a private school, with 44 (100.0% in the age bracket) attending a public institution.
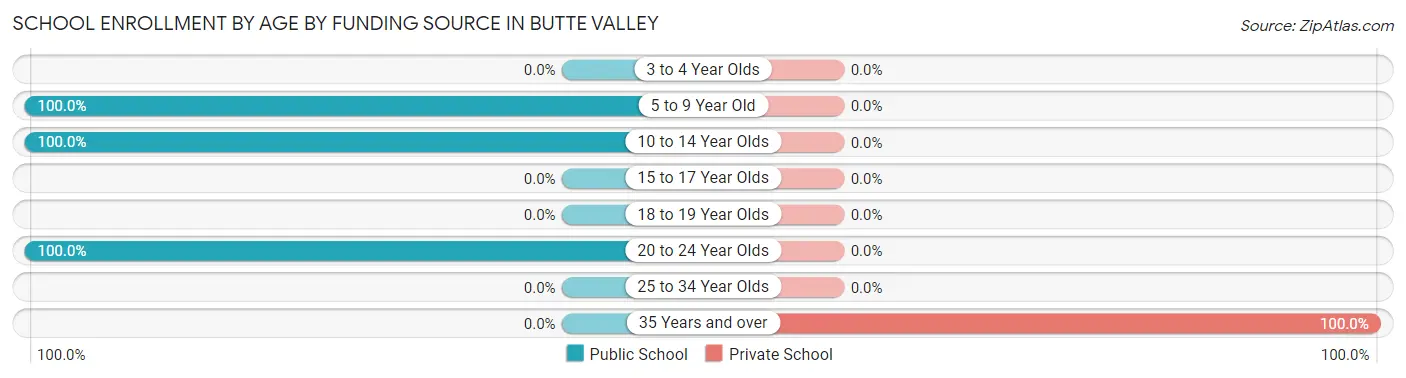
| Age Bracket | Public School | Private School |
| 3 to 4 Year Olds | 0 (0.0%) | 0 (0.0%) |
| 5 to 9 Year Old | 44 (100.0%) | 0 (0.0%) |
| 10 to 14 Year Olds | 27 (100.0%) | 0 (0.0%) |
| 15 to 17 Year Olds | 0 (0.0%) | 0 (0.0%) |
| 18 to 19 Year Olds | 0 (0.0%) | 0 (0.0%) |
| 20 to 24 Year Olds | 4 (100.0%) | 0 (0.0%) |
| 25 to 34 Year Olds | 0 (0.0%) | 0 (0.0%) |
| 35 Years and over | 0 (0.0%) | 17 (100.0%) |
| Total | 75 (81.5%) | 17 (18.5%) |
Educational Attainment by Field of Study in Butte Valley
Computers & mathematics (153 | 45.5%), liberal arts & history (82 | 24.4%), business (78 | 23.2%), arts & humanities (8 | 2.4%), and bio, nature & agricultural (5 | 1.5%) are the most common fields of study among 336 individuals in Butte Valley who have obtained a bachelor's degree or higher.
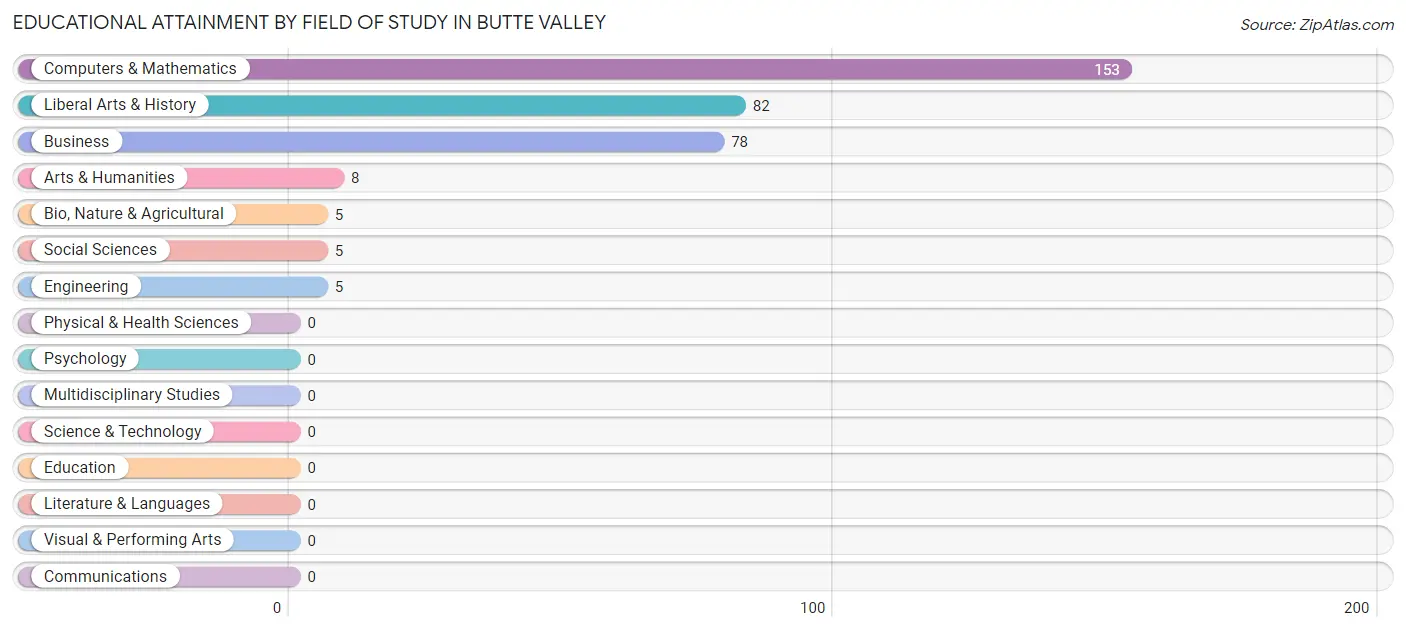
| Field of Study | # Graduates | % Graduates |
| Computers & Mathematics | 153 | 45.5% |
| Bio, Nature & Agricultural | 5 | 1.5% |
| Physical & Health Sciences | 0 | 0.0% |
| Psychology | 0 | 0.0% |
| Social Sciences | 5 | 1.5% |
| Engineering | 5 | 1.5% |
| Multidisciplinary Studies | 0 | 0.0% |
| Science & Technology | 0 | 0.0% |
| Business | 78 | 23.2% |
| Education | 0 | 0.0% |
| Literature & Languages | 0 | 0.0% |
| Liberal Arts & History | 82 | 24.4% |
| Visual & Performing Arts | 0 | 0.0% |
| Communications | 0 | 0.0% |
| Arts & Humanities | 8 | 2.4% |
| Total | 336 | 100.0% |
Transportation & Commute in Butte Valley
Vehicle Availability by Sex in Butte Valley
The most prevalent vehicle ownership categories in Butte Valley are males with 4 vehicles (72, accounting for 50.7%) and females with 4 vehicles (37, making up 61.5%).
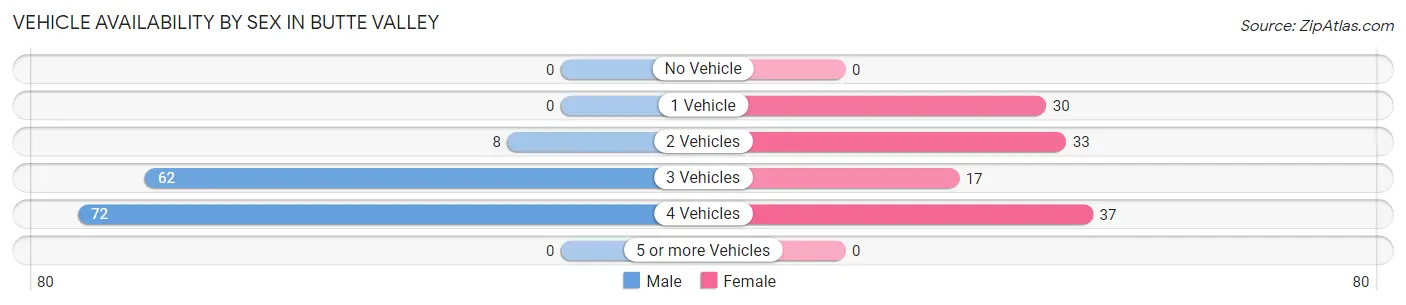
| Vehicles Available | Male | Female |
| No Vehicle | 0 (0.0%) | 0 (0.0%) |
| 1 Vehicle | 0 (0.0%) | 30 (25.6%) |
| 2 Vehicles | 8 (5.6%) | 33 (28.2%) |
| 3 Vehicles | 62 (43.7%) | 17 (14.5%) |
| 4 Vehicles | 72 (50.7%) | 37 (31.6%) |
| 5 or more Vehicles | 0 (0.0%) | 0 (0.0%) |
| Total | 142 (100.0%) | 117 (100.0%) |
Commute Time in Butte Valley
The most frequently occuring commute durations in Butte Valley are 30 to 34 minutes (90 commuters, 55.2%), 25 to 29 minutes (48 commuters, 29.4%), and 10 to 14 minutes (22 commuters, 13.5%).
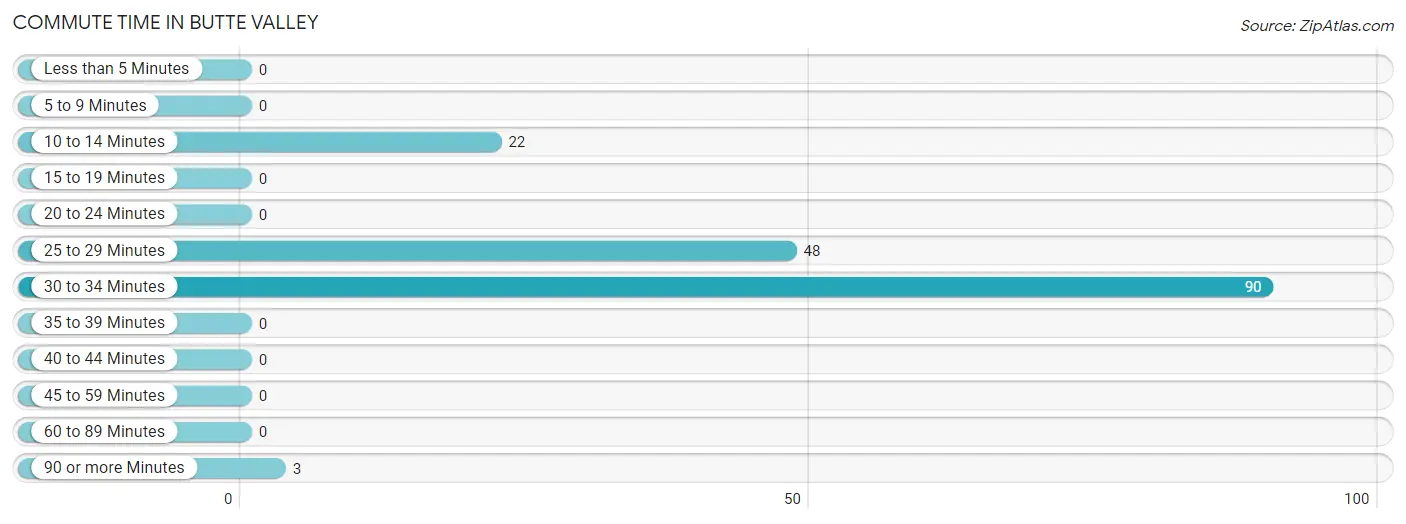
| Commute Time | # Commuters | % Commuters |
| Less than 5 Minutes | 0 | 0.0% |
| 5 to 9 Minutes | 0 | 0.0% |
| 10 to 14 Minutes | 22 | 13.5% |
| 15 to 19 Minutes | 0 | 0.0% |
| 20 to 24 Minutes | 0 | 0.0% |
| 25 to 29 Minutes | 48 | 29.4% |
| 30 to 34 Minutes | 90 | 55.2% |
| 35 to 39 Minutes | 0 | 0.0% |
| 40 to 44 Minutes | 0 | 0.0% |
| 45 to 59 Minutes | 0 | 0.0% |
| 60 to 89 Minutes | 0 | 0.0% |
| 90 or more Minutes | 3 | 1.8% |
Commute Time by Sex in Butte Valley
The most common commute times in Butte Valley are 30 to 34 minutes (53 commuters, 70.7%) for males and 30 to 34 minutes (37 commuters, 42.0%) for females.
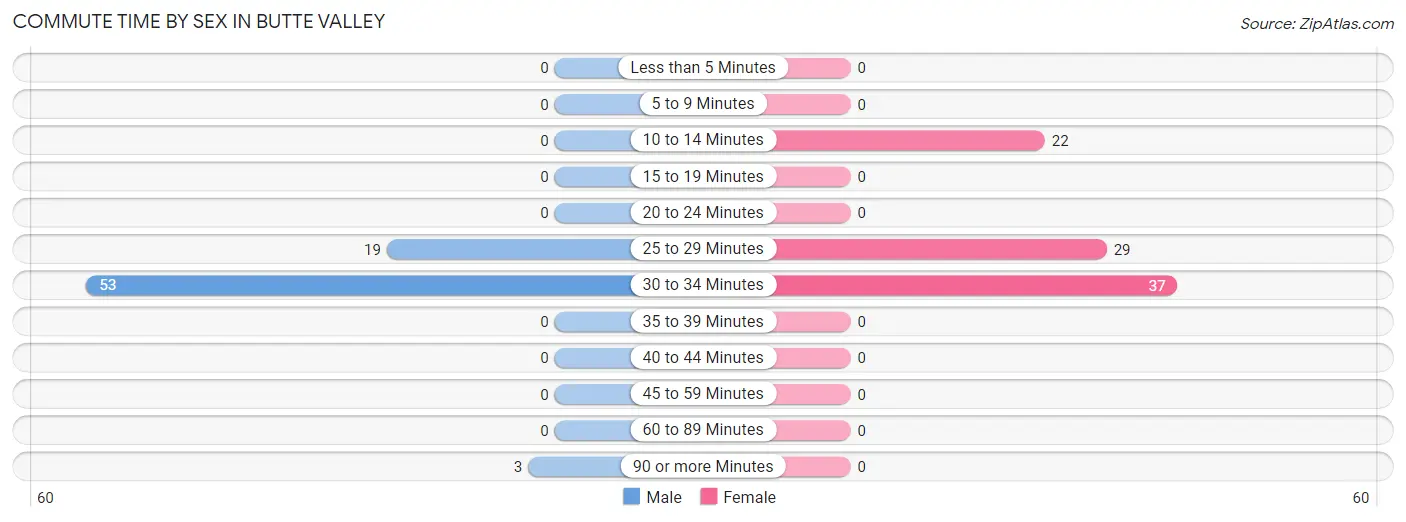
| Commute Time | Male | Female |
| Less than 5 Minutes | 0 (0.0%) | 0 (0.0%) |
| 5 to 9 Minutes | 0 (0.0%) | 0 (0.0%) |
| 10 to 14 Minutes | 0 (0.0%) | 22 (25.0%) |
| 15 to 19 Minutes | 0 (0.0%) | 0 (0.0%) |
| 20 to 24 Minutes | 0 (0.0%) | 0 (0.0%) |
| 25 to 29 Minutes | 19 (25.3%) | 29 (33.0%) |
| 30 to 34 Minutes | 53 (70.7%) | 37 (42.0%) |
| 35 to 39 Minutes | 0 (0.0%) | 0 (0.0%) |
| 40 to 44 Minutes | 0 (0.0%) | 0 (0.0%) |
| 45 to 59 Minutes | 0 (0.0%) | 0 (0.0%) |
| 60 to 89 Minutes | 0 (0.0%) | 0 (0.0%) |
| 90 or more Minutes | 3 (4.0%) | 0 (0.0%) |
Time of Departure to Work by Sex in Butte Valley
The most frequent times of departure to work in Butte Valley are 9:00 AM to 9:59 AM (53, 70.7%) for males and 8:00 AM to 8:29 AM (25, 28.4%) for females.
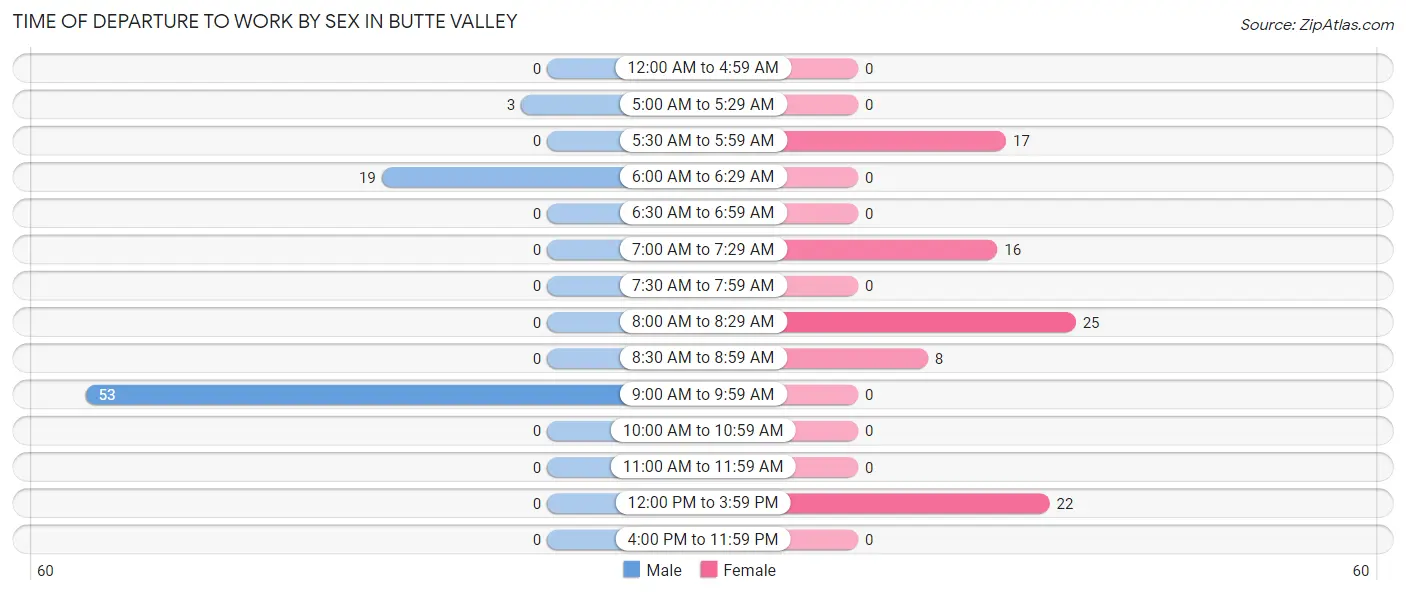
| Time of Departure | Male | Female |
| 12:00 AM to 4:59 AM | 0 (0.0%) | 0 (0.0%) |
| 5:00 AM to 5:29 AM | 3 (4.0%) | 0 (0.0%) |
| 5:30 AM to 5:59 AM | 0 (0.0%) | 17 (19.3%) |
| 6:00 AM to 6:29 AM | 19 (25.3%) | 0 (0.0%) |
| 6:30 AM to 6:59 AM | 0 (0.0%) | 0 (0.0%) |
| 7:00 AM to 7:29 AM | 0 (0.0%) | 16 (18.2%) |
| 7:30 AM to 7:59 AM | 0 (0.0%) | 0 (0.0%) |
| 8:00 AM to 8:29 AM | 0 (0.0%) | 25 (28.4%) |
| 8:30 AM to 8:59 AM | 0 (0.0%) | 8 (9.1%) |
| 9:00 AM to 9:59 AM | 53 (70.7%) | 0 (0.0%) |
| 10:00 AM to 10:59 AM | 0 (0.0%) | 0 (0.0%) |
| 11:00 AM to 11:59 AM | 0 (0.0%) | 0 (0.0%) |
| 12:00 PM to 3:59 PM | 0 (0.0%) | 22 (25.0%) |
| 4:00 PM to 11:59 PM | 0 (0.0%) | 0 (0.0%) |
| Total | 75 (100.0%) | 88 (100.0%) |
Housing Occupancy in Butte Valley
Occupancy by Ownership in Butte Valley
Of the total 479 dwellings in Butte Valley, owner-occupied units account for 461 (96.2%), while renter-occupied units make up 18 (3.8%).
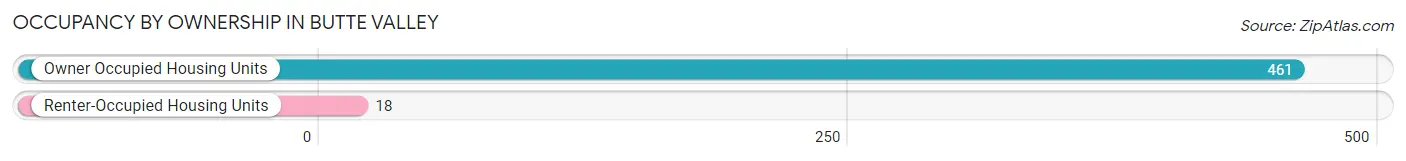
| Occupancy | # Housing Units | % Housing Units |
| Owner Occupied Housing Units | 461 | 96.2% |
| Renter-Occupied Housing Units | 18 | 3.8% |
| Total Occupied Housing Units | 479 | 100.0% |
Occupancy by Household Size in Butte Valley
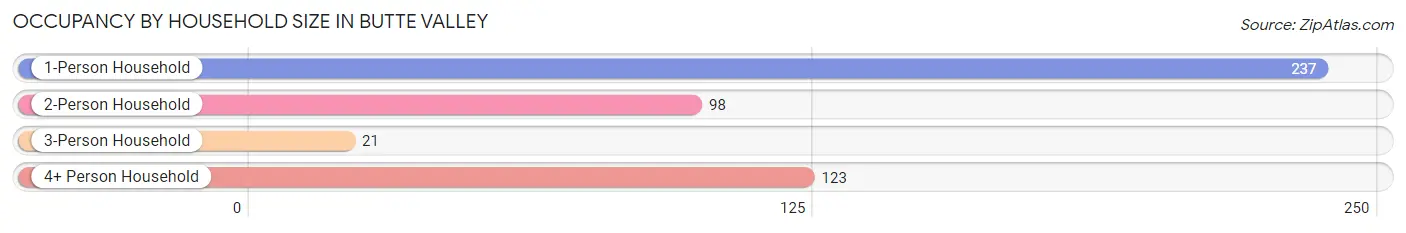
| Household Size | # Housing Units | % Housing Units |
| 1-Person Household | 237 | 49.5% |
| 2-Person Household | 98 | 20.5% |
| 3-Person Household | 21 | 4.4% |
| 4+ Person Household | 123 | 25.7% |
| Total Housing Units | 479 | 100.0% |
Occupancy by Ownership by Household Size in Butte Valley
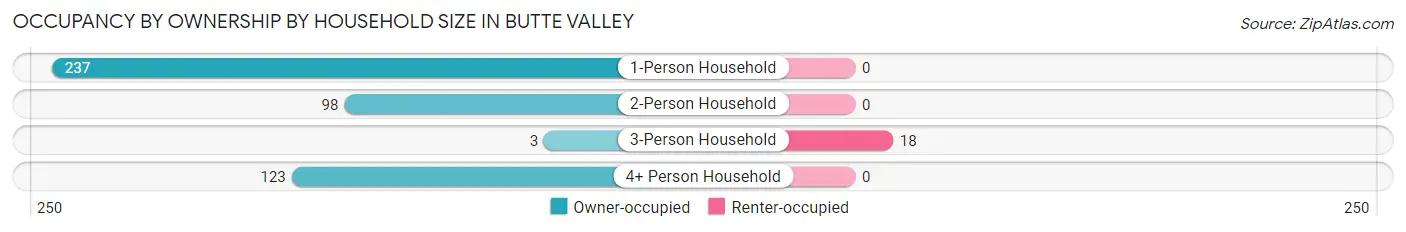
| Household Size | Owner-occupied | Renter-occupied |
| 1-Person Household | 237 (100.0%) | 0 (0.0%) |
| 2-Person Household | 98 (100.0%) | 0 (0.0%) |
| 3-Person Household | 3 (14.3%) | 18 (85.7%) |
| 4+ Person Household | 123 (100.0%) | 0 (0.0%) |
| Total Housing Units | 461 (96.2%) | 18 (3.8%) |
Occupancy by Educational Attainment in Butte Valley
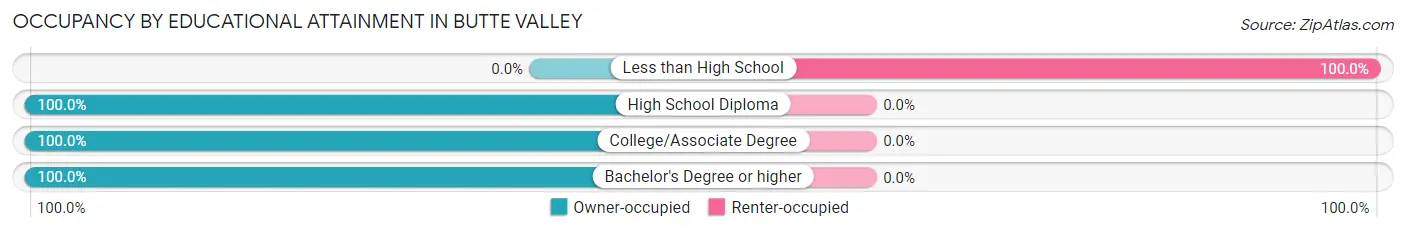
| Household Size | Owner-occupied | Renter-occupied |
| Less than High School | 0 (0.0%) | 18 (100.0%) |
| High School Diploma | 59 (100.0%) | 0 (0.0%) |
| College/Associate Degree | 116 (100.0%) | 0 (0.0%) |
| Bachelor's Degree or higher | 286 (100.0%) | 0 (0.0%) |
Occupancy by Age of Householder in Butte Valley
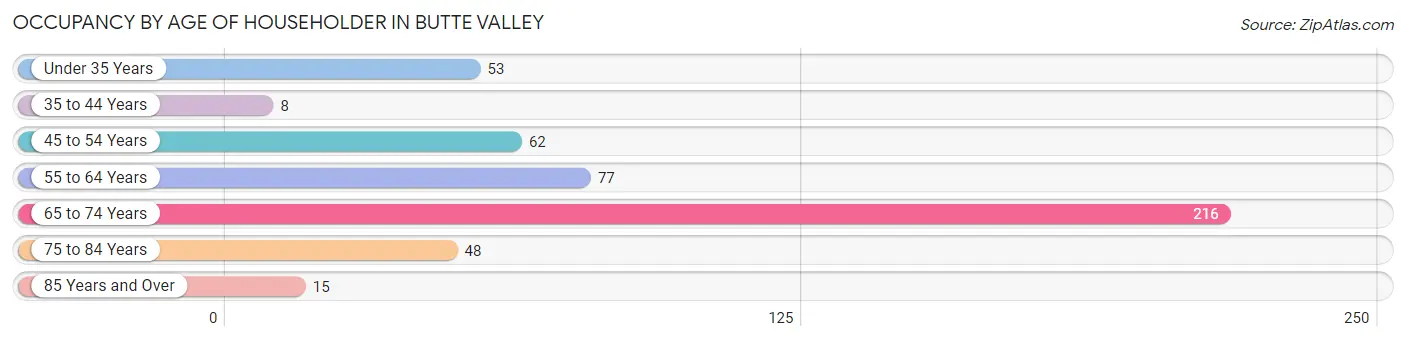
| Age Bracket | # Households | % Households |
| Under 35 Years | 53 | 11.1% |
| 35 to 44 Years | 8 | 1.7% |
| 45 to 54 Years | 62 | 12.9% |
| 55 to 64 Years | 77 | 16.1% |
| 65 to 74 Years | 216 | 45.1% |
| 75 to 84 Years | 48 | 10.0% |
| 85 Years and Over | 15 | 3.1% |
| Total | 479 | 100.0% |
Housing Finances in Butte Valley
Median Income by Occupancy in Butte Valley
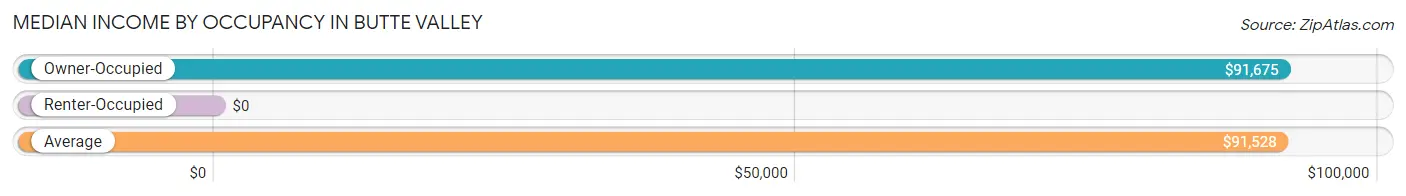
| Occupancy Type | # Households | Median Income |
| Owner-Occupied | 461 (96.2%) | $91,675 |
| Renter-Occupied | 18 (3.8%) | $0 |
| Average | 479 (100.0%) | $91,528 |
Occupancy by Householder Income Bracket in Butte Valley
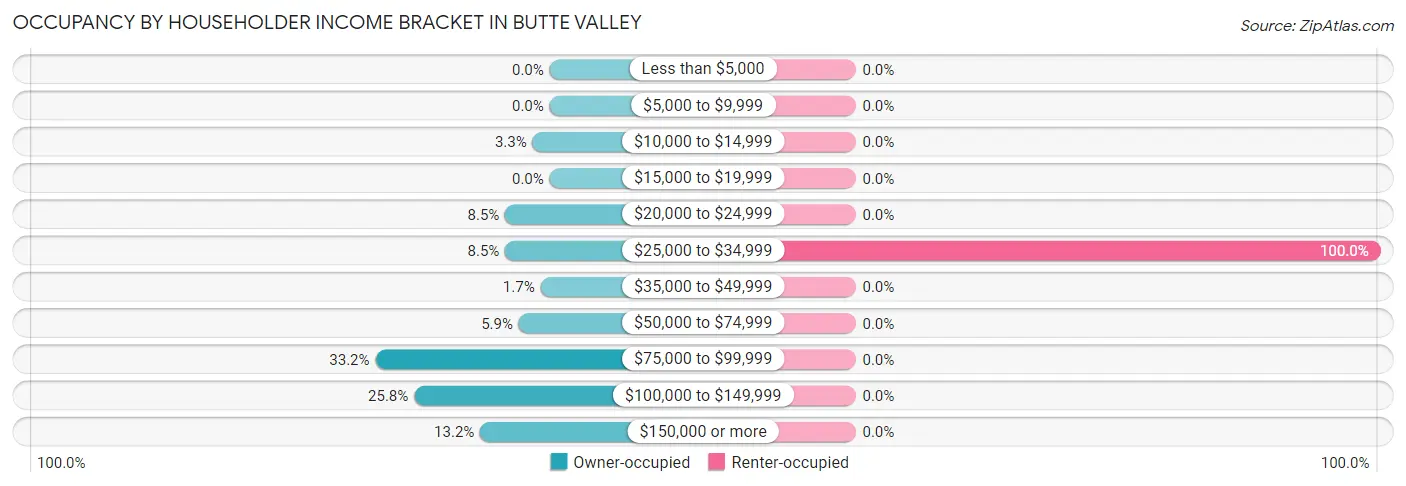
| Income Bracket | Owner-occupied | Renter-occupied |
| Less than $5,000 | 0 (0.0%) | 0 (0.0%) |
| $5,000 to $9,999 | 0 (0.0%) | 0 (0.0%) |
| $10,000 to $14,999 | 15 (3.3%) | 0 (0.0%) |
| $15,000 to $19,999 | 0 (0.0%) | 0 (0.0%) |
| $20,000 to $24,999 | 39 (8.5%) | 0 (0.0%) |
| $25,000 to $34,999 | 39 (8.5%) | 18 (100.0%) |
| $35,000 to $49,999 | 8 (1.7%) | 0 (0.0%) |
| $50,000 to $74,999 | 27 (5.9%) | 0 (0.0%) |
| $75,000 to $99,999 | 153 (33.2%) | 0 (0.0%) |
| $100,000 to $149,999 | 119 (25.8%) | 0 (0.0%) |
| $150,000 or more | 61 (13.2%) | 0 (0.0%) |
| Total | 461 (100.0%) | 18 (100.0%) |
Monthly Housing Cost Tiers in Butte Valley
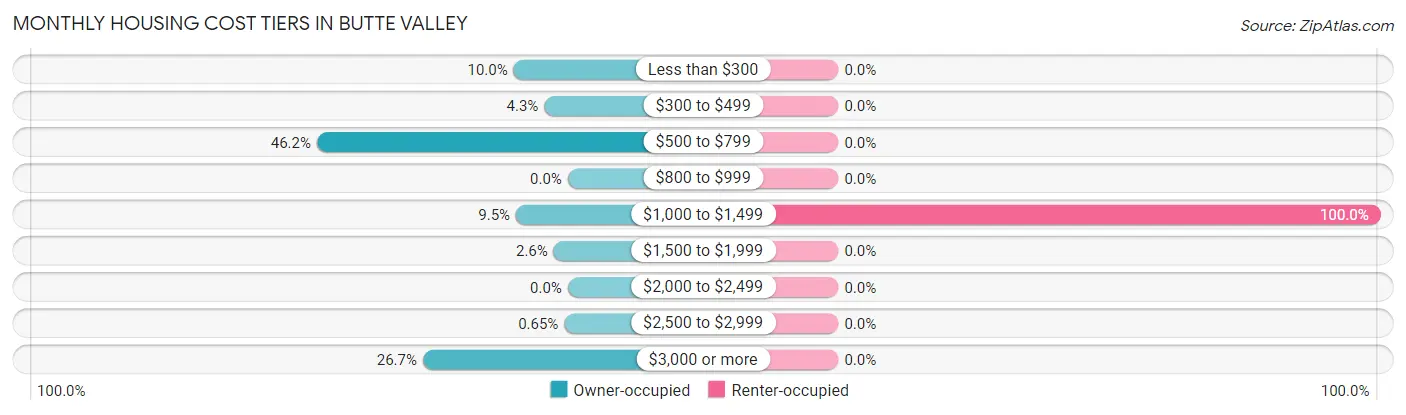
| Monthly Cost | Owner-occupied | Renter-occupied |
| Less than $300 | 46 (10.0%) | 0 (0.0%) |
| $300 to $499 | 20 (4.3%) | 0 (0.0%) |
| $500 to $799 | 213 (46.2%) | 0 (0.0%) |
| $800 to $999 | 0 (0.0%) | 0 (0.0%) |
| $1,000 to $1,499 | 44 (9.5%) | 18 (100.0%) |
| $1,500 to $1,999 | 12 (2.6%) | 0 (0.0%) |
| $2,000 to $2,499 | 0 (0.0%) | 0 (0.0%) |
| $2,500 to $2,999 | 3 (0.6%) | 0 (0.0%) |
| $3,000 or more | 123 (26.7%) | 0 (0.0%) |
| Total | 461 (100.0%) | 18 (100.0%) |
Physical Housing Characteristics in Butte Valley
Housing Structures in Butte Valley
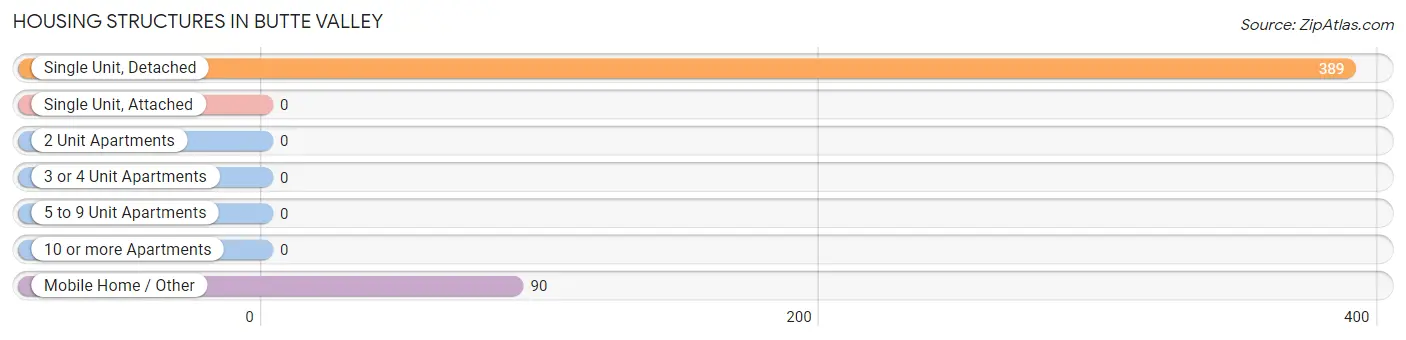
| Structure Type | # Housing Units | % Housing Units |
| Single Unit, Detached | 389 | 81.2% |
| Single Unit, Attached | 0 | 0.0% |
| 2 Unit Apartments | 0 | 0.0% |
| 3 or 4 Unit Apartments | 0 | 0.0% |
| 5 to 9 Unit Apartments | 0 | 0.0% |
| 10 or more Apartments | 0 | 0.0% |
| Mobile Home / Other | 90 | 18.8% |
| Total | 479 | 100.0% |
Housing Structures by Occupancy in Butte Valley
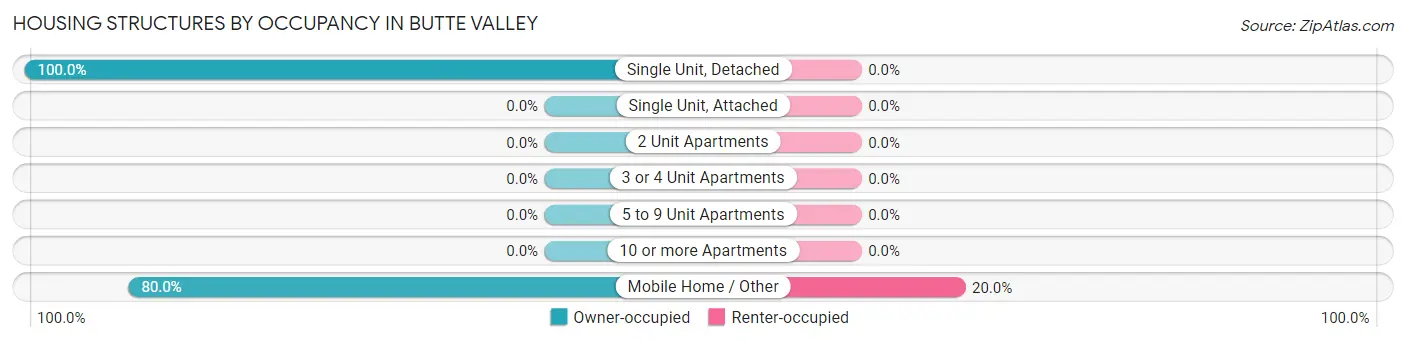
| Structure Type | Owner-occupied | Renter-occupied |
| Single Unit, Detached | 389 (100.0%) | 0 (0.0%) |
| Single Unit, Attached | 0 (0.0%) | 0 (0.0%) |
| 2 Unit Apartments | 0 (0.0%) | 0 (0.0%) |
| 3 or 4 Unit Apartments | 0 (0.0%) | 0 (0.0%) |
| 5 to 9 Unit Apartments | 0 (0.0%) | 0 (0.0%) |
| 10 or more Apartments | 0 (0.0%) | 0 (0.0%) |
| Mobile Home / Other | 72 (80.0%) | 18 (20.0%) |
| Total | 461 (96.2%) | 18 (3.8%) |
Housing Structures by Number of Rooms in Butte Valley
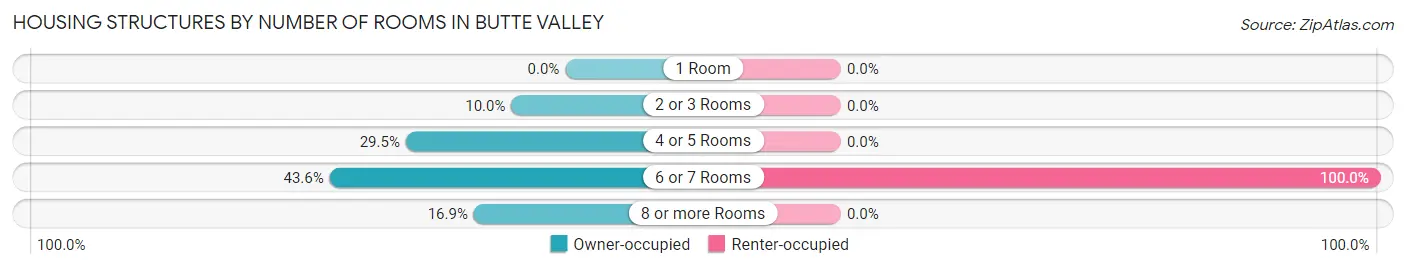
| Number of Rooms | Owner-occupied | Renter-occupied |
| 1 Room | 0 (0.0%) | 0 (0.0%) |
| 2 or 3 Rooms | 46 (10.0%) | 0 (0.0%) |
| 4 or 5 Rooms | 136 (29.5%) | 0 (0.0%) |
| 6 or 7 Rooms | 201 (43.6%) | 18 (100.0%) |
| 8 or more Rooms | 78 (16.9%) | 0 (0.0%) |
| Total | 461 (100.0%) | 18 (100.0%) |
Housing Structure by Heating Type in Butte Valley
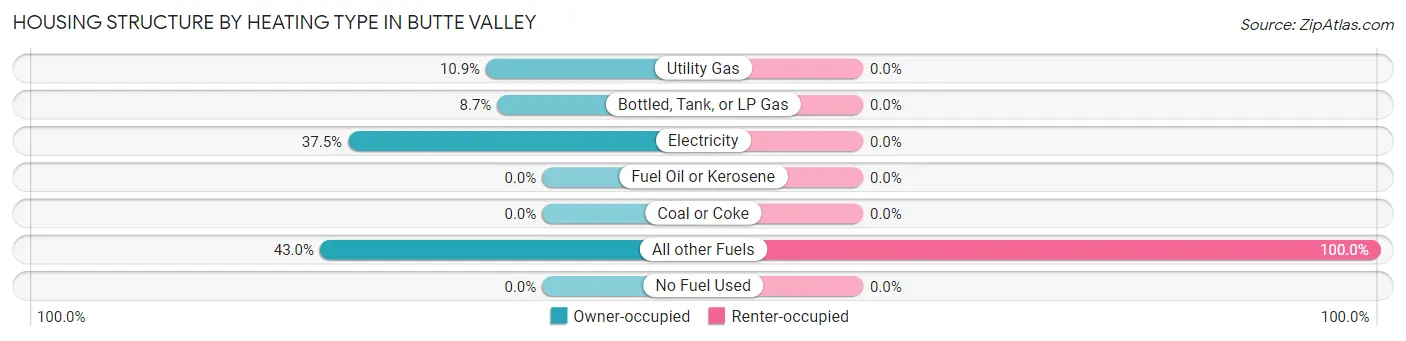
| Heating Type | Owner-occupied | Renter-occupied |
| Utility Gas | 50 (10.8%) | 0 (0.0%) |
| Bottled, Tank, or LP Gas | 40 (8.7%) | 0 (0.0%) |
| Electricity | 173 (37.5%) | 0 (0.0%) |
| Fuel Oil or Kerosene | 0 (0.0%) | 0 (0.0%) |
| Coal or Coke | 0 (0.0%) | 0 (0.0%) |
| All other Fuels | 198 (42.9%) | 18 (100.0%) |
| No Fuel Used | 0 (0.0%) | 0 (0.0%) |
| Total | 461 (100.0%) | 18 (100.0%) |
Household Vehicle Usage in Butte Valley
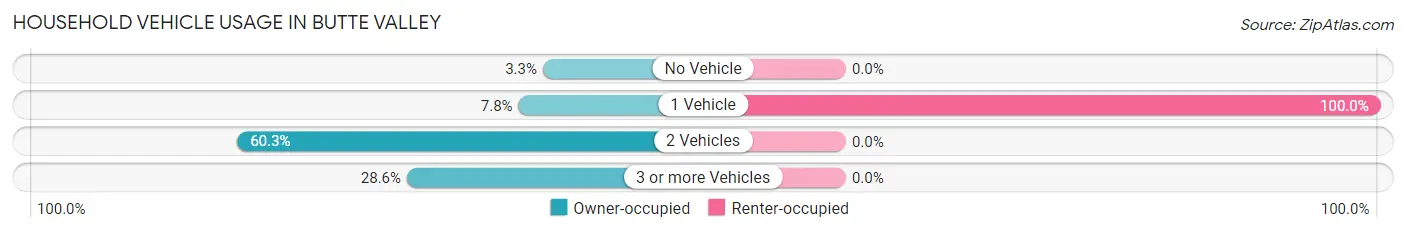
| Vehicles per Household | Owner-occupied | Renter-occupied |
| No Vehicle | 15 (3.3%) | 0 (0.0%) |
| 1 Vehicle | 36 (7.8%) | 18 (100.0%) |
| 2 Vehicles | 278 (60.3%) | 0 (0.0%) |
| 3 or more Vehicles | 132 (28.6%) | 0 (0.0%) |
| Total | 461 (100.0%) | 18 (100.0%) |
Real Estate & Mortgages in Butte Valley
Real Estate and Mortgage Overview in Butte Valley
| Characteristic | Without Mortgage | With Mortgage |
| Housing Units | 298 | 163 |
| Median Property Value | $447,700 | $712,200 |
| Median Household Income | $90,752 | $61 |
| Monthly Housing Costs | $630 | $123 |
| Real Estate Taxes | $2,455 | $0 |
Property Value by Mortgage Status in Butte Valley
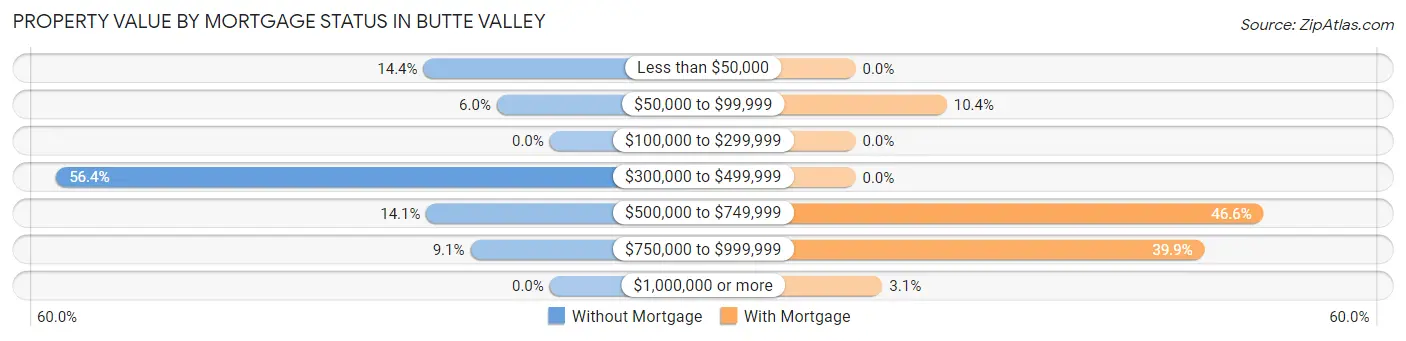
| Property Value | Without Mortgage | With Mortgage |
| Less than $50,000 | 43 (14.4%) | 0 (0.0%) |
| $50,000 to $99,999 | 18 (6.0%) | 17 (10.4%) |
| $100,000 to $299,999 | 0 (0.0%) | 0 (0.0%) |
| $300,000 to $499,999 | 168 (56.4%) | 0 (0.0%) |
| $500,000 to $749,999 | 42 (14.1%) | 76 (46.6%) |
| $750,000 to $999,999 | 27 (9.1%) | 65 (39.9%) |
| $1,000,000 or more | 0 (0.0%) | 5 (3.1%) |
| Total | 298 (100.0%) | 163 (100.0%) |
Household Income by Mortgage Status in Butte Valley
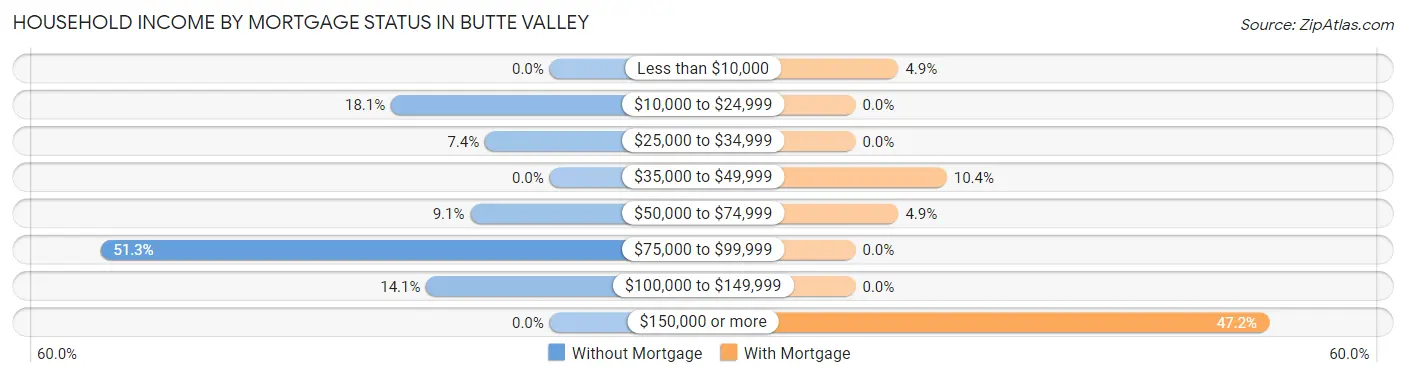
| Household Income | Without Mortgage | With Mortgage |
| Less than $10,000 | 0 (0.0%) | 8 (4.9%) |
| $10,000 to $24,999 | 54 (18.1%) | 0 (0.0%) |
| $25,000 to $34,999 | 22 (7.4%) | 0 (0.0%) |
| $35,000 to $49,999 | 0 (0.0%) | 17 (10.4%) |
| $50,000 to $74,999 | 27 (9.1%) | 8 (4.9%) |
| $75,000 to $99,999 | 153 (51.3%) | 0 (0.0%) |
| $100,000 to $149,999 | 42 (14.1%) | 0 (0.0%) |
| $150,000 or more | 0 (0.0%) | 77 (47.2%) |
| Total | 298 (100.0%) | 163 (100.0%) |
Property Value to Household Income Ratio in Butte Valley
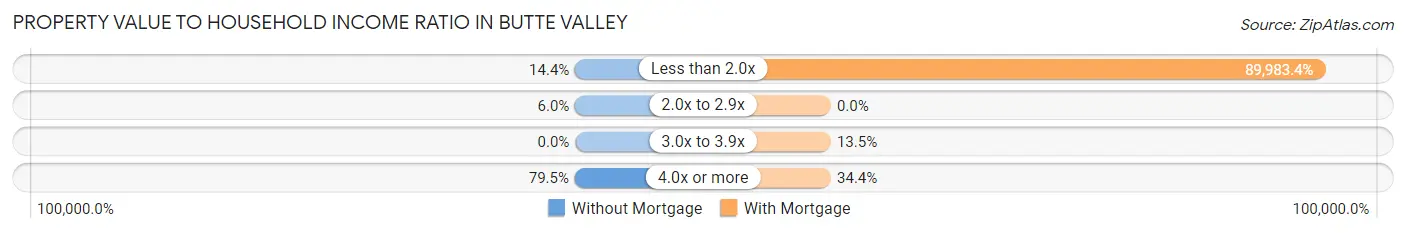
| Value-to-Income Ratio | Without Mortgage | With Mortgage |
| Less than 2.0x | 43 (14.4%) | 146,673 (89,983.4%) |
| 2.0x to 2.9x | 18 (6.0%) | 0 (0.0%) |
| 3.0x to 3.9x | 0 (0.0%) | 22 (13.5%) |
| 4.0x or more | 237 (79.5%) | 56 (34.4%) |
| Total | 298 (100.0%) | 163 (100.0%) |
Real Estate Taxes by Mortgage Status in Butte Valley
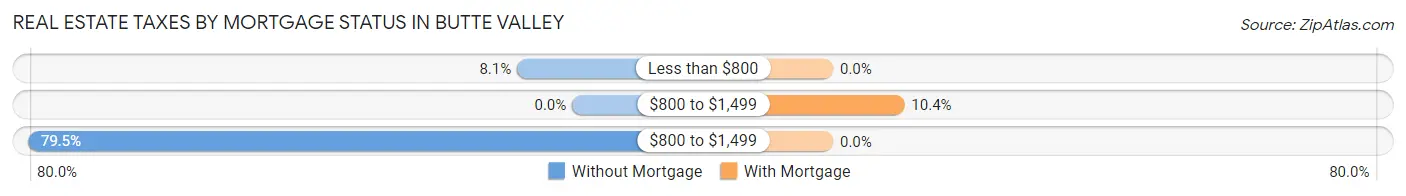
| Property Taxes | Without Mortgage | With Mortgage |
| Less than $800 | 24 (8.1%) | 0 (0.0%) |
| $800 to $1,499 | 0 (0.0%) | 17 (10.4%) |
| $800 to $1,499 | 237 (79.5%) | 0 (0.0%) |
| Total | 298 (100.0%) | 163 (100.0%) |
Health & Disability in Butte Valley
Health Insurance Coverage by Age in Butte Valley
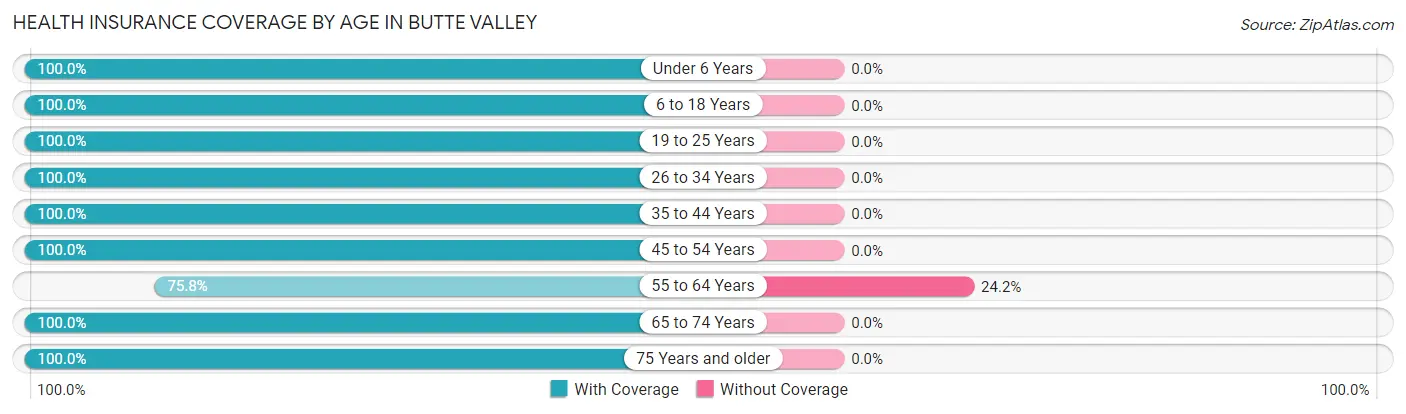
| Age Bracket | With Coverage | Without Coverage |
| Under 6 Years | 42 (100.0%) | 0 (0.0%) |
| 6 to 18 Years | 70 (100.0%) | 0 (0.0%) |
| 19 to 25 Years | 4 (100.0%) | 0 (0.0%) |
| 26 to 34 Years | 78 (100.0%) | 0 (0.0%) |
| 35 to 44 Years | 13 (100.0%) | 0 (0.0%) |
| 45 to 54 Years | 79 (100.0%) | 0 (0.0%) |
| 55 to 64 Years | 122 (75.8%) | 39 (24.2%) |
| 65 to 74 Years | 242 (100.0%) | 0 (0.0%) |
| 75 Years and older | 121 (100.0%) | 0 (0.0%) |
| Total | 771 (95.2%) | 39 (4.8%) |
Health Insurance Coverage by Citizenship Status in Butte Valley
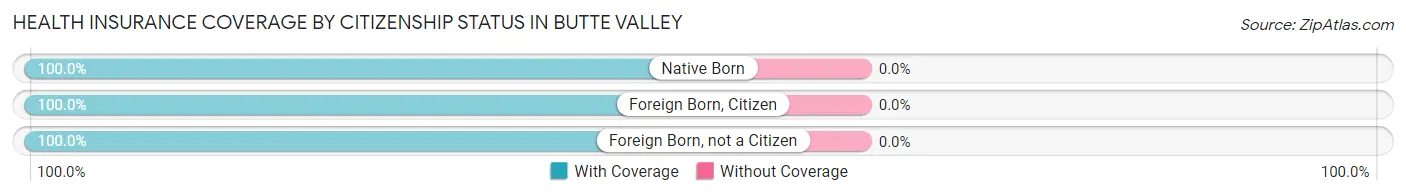
| Citizenship Status | With Coverage | Without Coverage |
| Native Born | 42 (100.0%) | 0 (0.0%) |
| Foreign Born, Citizen | 70 (100.0%) | 0 (0.0%) |
| Foreign Born, not a Citizen | 4 (100.0%) | 0 (0.0%) |
Health Insurance Coverage by Household Income in Butte Valley
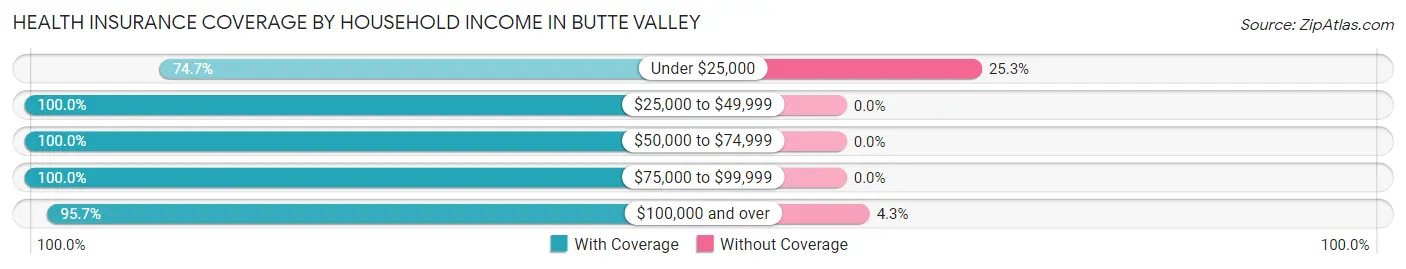
| Household Income | With Coverage | Without Coverage |
| Under $25,000 | 59 (74.7%) | 20 (25.3%) |
| $25,000 to $49,999 | 97 (100.0%) | 0 (0.0%) |
| $50,000 to $74,999 | 39 (100.0%) | 0 (0.0%) |
| $75,000 to $99,999 | 153 (100.0%) | 0 (0.0%) |
| $100,000 and over | 423 (95.7%) | 19 (4.3%) |
Public vs Private Health Insurance Coverage by Age in Butte Valley
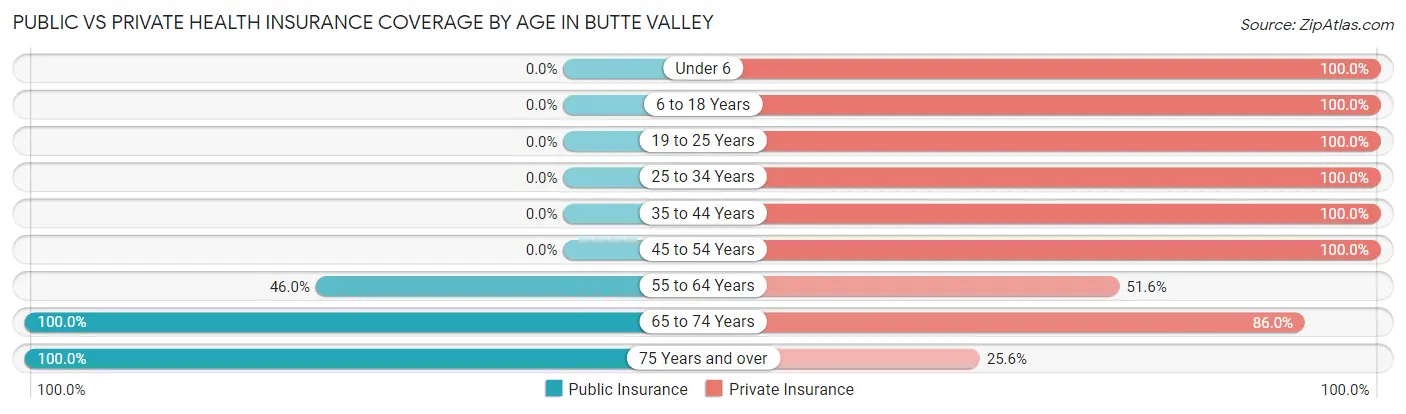
| Age Bracket | Public Insurance | Private Insurance |
| Under 6 | 0 (0.0%) | 42 (100.0%) |
| 6 to 18 Years | 0 (0.0%) | 70 (100.0%) |
| 19 to 25 Years | 0 (0.0%) | 4 (100.0%) |
| 25 to 34 Years | 0 (0.0%) | 78 (100.0%) |
| 35 to 44 Years | 0 (0.0%) | 13 (100.0%) |
| 45 to 54 Years | 0 (0.0%) | 79 (100.0%) |
| 55 to 64 Years | 74 (46.0%) | 83 (51.5%) |
| 65 to 74 Years | 242 (100.0%) | 208 (86.0%) |
| 75 Years and over | 121 (100.0%) | 31 (25.6%) |
| Total | 437 (53.9%) | 608 (75.1%) |
Disability Status by Sex by Age in Butte Valley
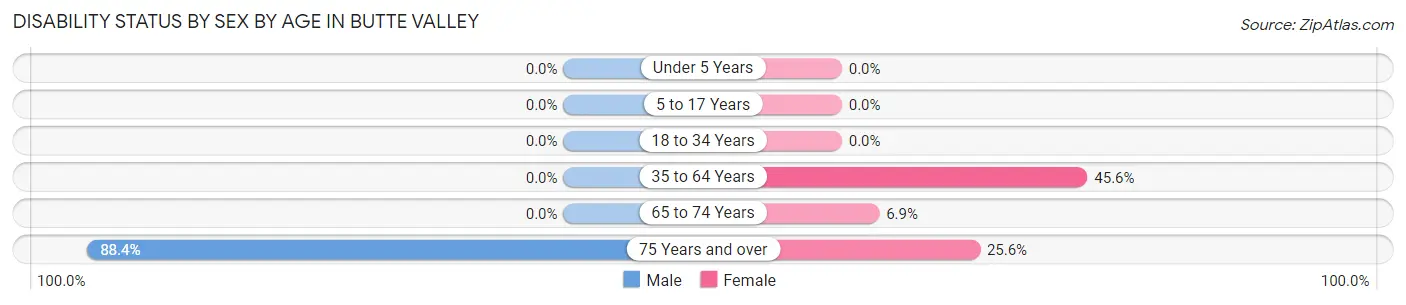
| Age Bracket | Male | Female |
| Under 5 Years | 0 (0.0%) | 0 (0.0%) |
| 5 to 17 Years | 0 (0.0%) | 0 (0.0%) |
| 18 to 34 Years | 0 (0.0%) | 0 (0.0%) |
| 35 to 64 Years | 0 (0.0%) | 67 (45.6%) |
| 65 to 74 Years | 0 (0.0%) | 15 (6.9%) |
| 75 Years and over | 38 (88.4%) | 20 (25.6%) |
Disability Class by Sex by Age in Butte Valley
Disability Class: Hearing Difficulty
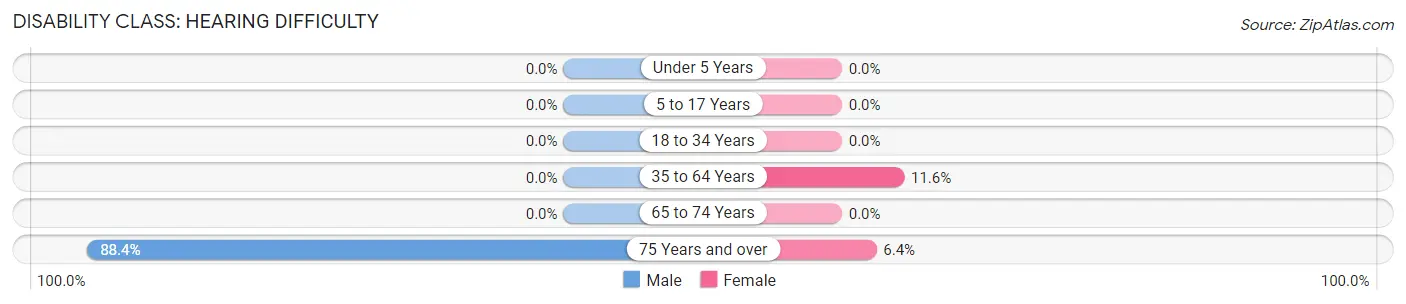
| Age Bracket | Male | Female |
| Under 5 Years | 0 (0.0%) | 0 (0.0%) |
| 5 to 17 Years | 0 (0.0%) | 0 (0.0%) |
| 18 to 34 Years | 0 (0.0%) | 0 (0.0%) |
| 35 to 64 Years | 0 (0.0%) | 17 (11.6%) |
| 65 to 74 Years | 0 (0.0%) | 0 (0.0%) |
| 75 Years and over | 38 (88.4%) | 5 (6.4%) |
Disability Class: Vision Difficulty
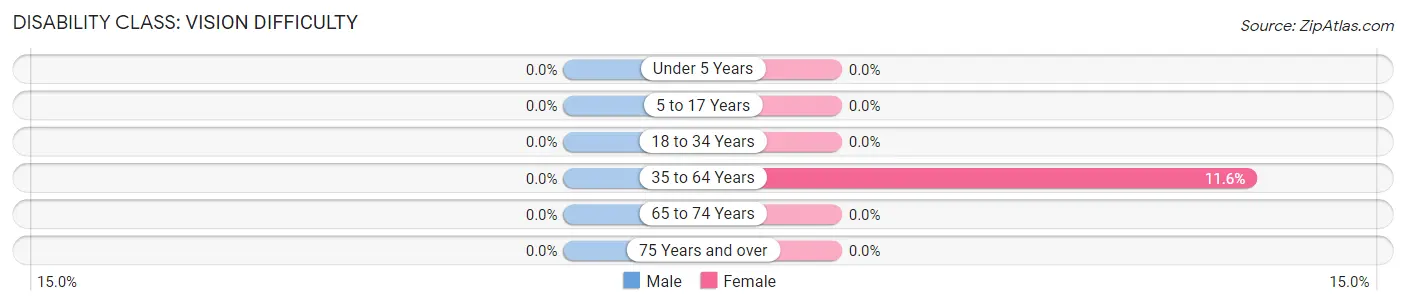
| Age Bracket | Male | Female |
| Under 5 Years | 0 (0.0%) | 0 (0.0%) |
| 5 to 17 Years | 0 (0.0%) | 0 (0.0%) |
| 18 to 34 Years | 0 (0.0%) | 0 (0.0%) |
| 35 to 64 Years | 0 (0.0%) | 17 (11.6%) |
| 65 to 74 Years | 0 (0.0%) | 0 (0.0%) |
| 75 Years and over | 0 (0.0%) | 0 (0.0%) |
Disability Class: Cognitive Difficulty
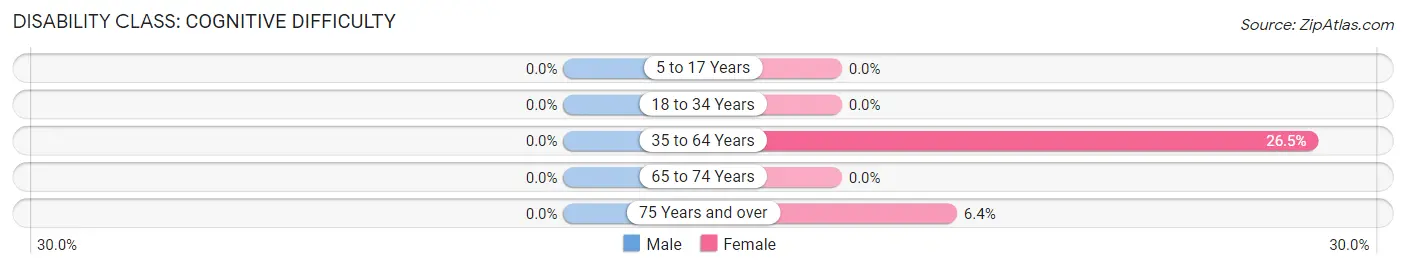
| Age Bracket | Male | Female |
| 5 to 17 Years | 0 (0.0%) | 0 (0.0%) |
| 18 to 34 Years | 0 (0.0%) | 0 (0.0%) |
| 35 to 64 Years | 0 (0.0%) | 39 (26.5%) |
| 65 to 74 Years | 0 (0.0%) | 0 (0.0%) |
| 75 Years and over | 0 (0.0%) | 5 (6.4%) |
Disability Class: Ambulatory Difficulty
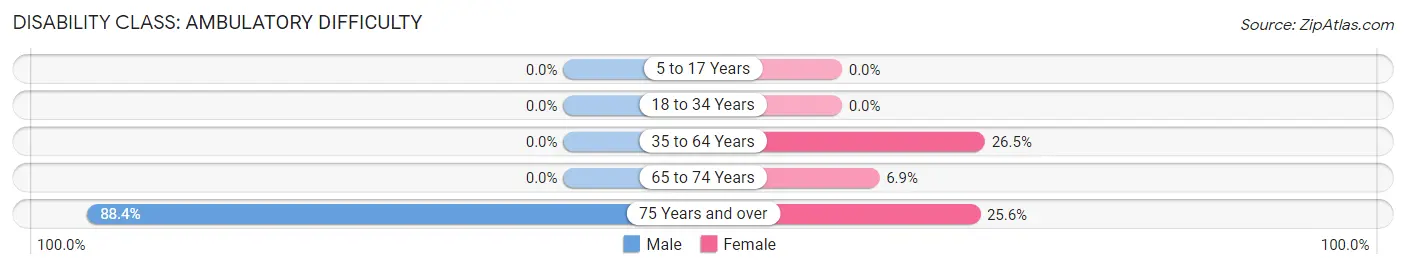
| Age Bracket | Male | Female |
| 5 to 17 Years | 0 (0.0%) | 0 (0.0%) |
| 18 to 34 Years | 0 (0.0%) | 0 (0.0%) |
| 35 to 64 Years | 0 (0.0%) | 39 (26.5%) |
| 65 to 74 Years | 0 (0.0%) | 15 (6.9%) |
| 75 Years and over | 38 (88.4%) | 20 (25.6%) |
Disability Class: Self-Care Difficulty
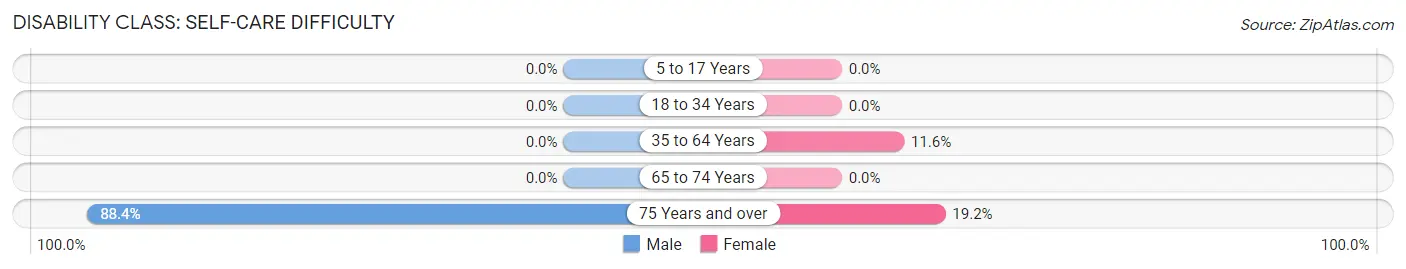
| Age Bracket | Male | Female |
| 5 to 17 Years | 0 (0.0%) | 0 (0.0%) |
| 18 to 34 Years | 0 (0.0%) | 0 (0.0%) |
| 35 to 64 Years | 0 (0.0%) | 17 (11.6%) |
| 65 to 74 Years | 0 (0.0%) | 0 (0.0%) |
| 75 Years and over | 38 (88.4%) | 15 (19.2%) |
Technology Access in Butte Valley
Computing Device Access in Butte Valley
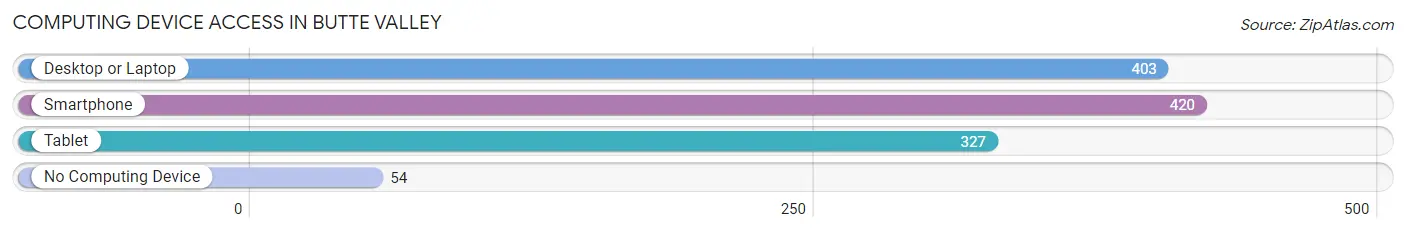
| Device Type | # Households | % Households |
| Desktop or Laptop | 403 | 84.1% |
| Smartphone | 420 | 87.7% |
| Tablet | 327 | 68.3% |
| No Computing Device | 54 | 11.3% |
| Total | 479 | 100.0% |
Internet Access in Butte Valley
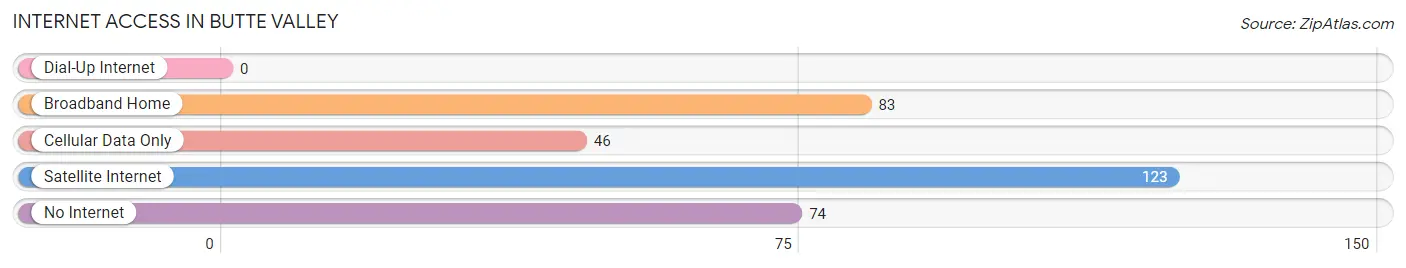
| Internet Type | # Households | % Households |
| Dial-Up Internet | 0 | 0.0% |
| Broadband Home | 83 | 17.3% |
| Cellular Data Only | 46 | 9.6% |
| Satellite Internet | 123 | 25.7% |
| No Internet | 74 | 15.4% |
| Total | 479 | 100.0% |
Butte Valley Summary
Butte Valley is a small unincorporated community located in the northern part of California’s Shasta County. It is situated in the foothills of the Cascade Range, approximately 20 miles east of Redding. The valley is home to a diverse population of approximately 1,500 people, and is known for its rural lifestyle and agricultural production.
History
The Butte Valley area has been inhabited for thousands of years by Native American tribes, including the Wintu, Yana, and Atsugewi. The first European settlers arrived in the area in the mid-1800s, and the valley was officially established in 1856. The area was initially used for cattle ranching and farming, and the first post office was established in 1872.
In the early 1900s, the Butte Valley area experienced a period of rapid growth and development. The construction of the Central Pacific Railroad in the late 1800s brought new settlers to the area, and the town of Butte Valley was officially incorporated in 1909. The town quickly became a hub for the surrounding agricultural communities, and the population grew to over 1,000 by the 1920s.
Geography
Butte Valley is located in the northern part of California’s Shasta County, approximately 20 miles east of Redding. The valley is situated in the foothills of the Cascade Range, and is surrounded by rolling hills and mountains. The valley is home to several small lakes, including Butte Lake, which is the largest lake in the area. The valley is also home to several creeks and streams, including Butte Creek, which flows through the center of the valley.
Economy
Butte Valley’s economy is largely based on agriculture and tourism. The valley is home to several small farms and ranches, which produce a variety of crops, including hay, alfalfa, and grains. The area is also known for its cattle ranching, and the local beef industry is a major contributor to the local economy.
In addition to agriculture, Butte Valley is also home to several small businesses, including restaurants, shops, and lodging. The area is also a popular destination for outdoor recreation, and the nearby lakes and mountains provide ample opportunities for fishing, camping, and hiking.
Demographics
As of the 2010 census, the population of Butte Valley was 1,521. The population is largely white (90.2%), with small percentages of Hispanic (4.2%), African American (2.2%), and Native American (1.2%) residents. The median household income in Butte Valley is $45,000, and the median age is 44. The area is largely rural, with only a small percentage of the population living in urban areas.
Common Questions
What is Per Capita Income in Butte Valley?
Per Capita income in Butte Valley is $52,160.
What is the Median Family Income in Butte Valley?
Median Family Income in Butte Valley is $145,323.
What is the Median Household income in Butte Valley?
Median Household Income in Butte Valley is $91,528.
What is Inequality or Gini Index in Butte Valley?
Inequality or Gini Index in Butte Valley is 0.34.
What is the Total Population of Butte Valley?
Total Population of Butte Valley is 811.
What is the Total Male Population of Butte Valley?
Total Male Population of Butte Valley is 250.
What is the Total Female Population of Butte Valley?
Total Female Population of Butte Valley is 561.
What is the Ratio of Males per 100 Females in Butte Valley?
There are 44.56 Males per 100 Females in Butte Valley.
What is the Ratio of Females per 100 Males in Butte Valley?
There are 224.40 Females per 100 Males in Butte Valley.
What is the Median Population Age in Butte Valley?
Median Population Age in Butte Valley is 63.1 Years.
What is the Average Family Size in Butte Valley
Average Family Size in Butte Valley is 2.4 People.
What is the Average Household Size in Butte Valley
Average Household Size in Butte Valley is 1.7 People.
How Large is the Labor Force in Butte Valley?
There are 259 People in the Labor Forcein in Butte Valley.
What is the Percentage of People in the Labor Force in Butte Valley?
37.1% of People are in the Labor Force in Butte Valley.