Cities with the Highest Percentage of Population Employed in Real Estate, Rental & Leasing in Montana
RELATED REPORTS & OPTIONS
Real Estate, Rental & Leasing
Montana
Compare Cities
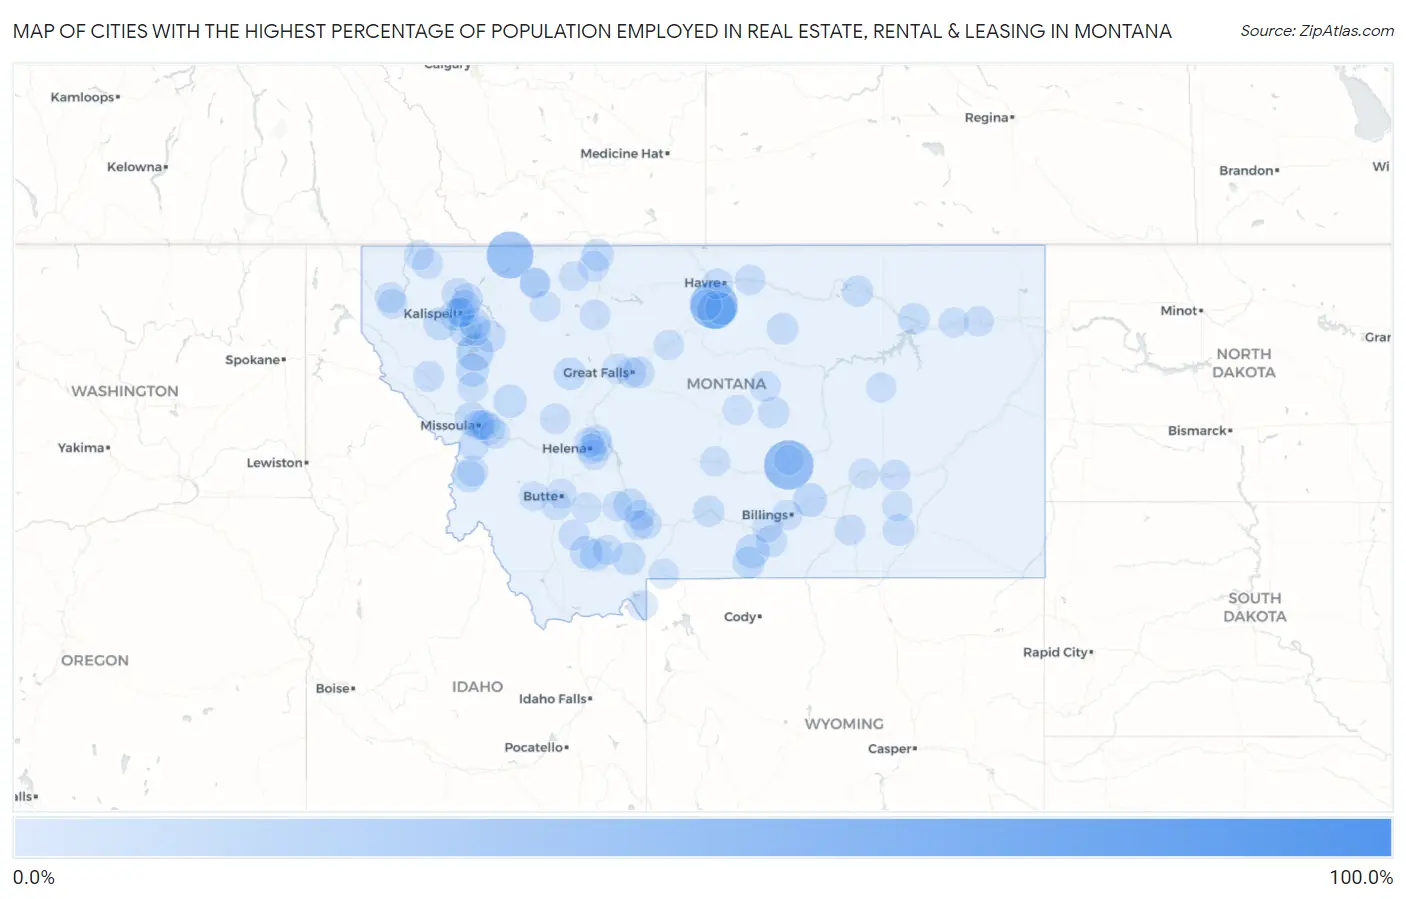
Map of Cities with the Highest Percentage of Population Employed in Real Estate, Rental & Leasing in Montana
0.0%
100.0%
Cities with the Highest Percentage of Population Employed in Real Estate, Rental & Leasing in Montana
| City | % Employed | vs State | vs National | |
| 1. | Sleeping Buffalo | 100.0% | 1.8%(+98.2)#1 | 1.9%(+98.1)#9 |
| 2. | Klein | 42.9% | 1.8%(+41.0)#2 | 1.9%(+41.0)#32 |
| 3. | Boneau | 39.2% | 1.8%(+37.4)#3 | 1.9%(+37.3)#41 |
| 4. | Babb | 36.9% | 1.8%(+35.1)#4 | 1.9%(+35.0)#50 |
| 5. | Fox | 29.2% | 1.8%(+27.3)#5 | 1.9%(+27.3)#69 |
| 6. | St Pierre | 18.8% | 1.8%(+16.9)#6 | 1.9%(+16.9)#165 |
| 7. | Finley Point | 16.3% | 1.8%(+14.5)#7 | 1.9%(+14.4)#210 |
| 8. | Tracy | 14.6% | 1.8%(+12.7)#8 | 1.9%(+12.7)#260 |
| 9. | Roberts | 9.6% | 1.8%(+7.77)#9 | 1.9%(+7.71)#578 |
| 10. | Worden | 8.9% | 1.8%(+7.03)#10 | 1.9%(+6.97)#667 |
| 11. | Wye | 8.1% | 1.8%(+6.28)#11 | 1.9%(+6.23)#803 |
| 12. | Seeley Lake | 8.1% | 1.8%(+6.23)#12 | 1.9%(+6.17)#813 |
| 13. | Ronan | 8.0% | 1.8%(+6.12)#13 | 1.9%(+6.06)#836 |
| 14. | Big Sky | 7.6% | 1.8%(+5.75)#14 | 1.9%(+5.69)#905 |
| 15. | Pine Creek | 7.5% | 1.8%(+5.67)#15 | 1.9%(+5.61)#932 |
| 16. | Gallatin River Ranch | 7.3% | 1.8%(+5.44)#16 | 1.9%(+5.38)#976 |
| 17. | Marion | 7.2% | 1.8%(+5.35)#17 | 1.9%(+5.29)#999 |
| 18. | Alder | 7.0% | 1.8%(+5.18)#18 | 1.9%(+5.13)#1,040 |
| 19. | Lakeside | 6.7% | 1.8%(+4.85)#19 | 1.9%(+4.80)#1,116 |
| 20. | Virginia City | 6.6% | 1.8%(+4.72)#20 | 1.9%(+4.67)#1,169 |
| 21. | Augusta | 6.2% | 1.8%(+4.34)#21 | 1.9%(+4.28)#1,309 |
| 22. | Sunburst | 5.9% | 1.8%(+4.05)#22 | 1.9%(+3.99)#1,422 |
| 23. | Red Lodge | 5.6% | 1.8%(+3.75)#23 | 1.9%(+3.69)#1,552 |
| 24. | Parker School | 5.6% | 1.8%(+3.72)#24 | 1.9%(+3.66)#1,565 |
| 25. | Helmville | 5.6% | 1.8%(+3.72)#25 | 1.9%(+3.66)#1,567 |
| 26. | Hamilton | 5.4% | 1.8%(+3.57)#26 | 1.9%(+3.51)#1,633 |
| 27. | Swan Lake | 5.2% | 1.8%(+3.37)#27 | 1.9%(+3.32)#1,740 |
| 28. | Turah | 5.0% | 1.8%(+3.15)#28 | 1.9%(+3.09)#1,874 |
| 29. | Edgar | 4.9% | 1.8%(+3.04)#29 | 1.9%(+2.99)#1,942 |
| 30. | Batavia | 4.8% | 1.8%(+2.96)#30 | 1.9%(+2.90)#1,998 |
| 31. | Woods Bay | 4.8% | 1.8%(+2.94)#31 | 1.9%(+2.88)#2,005 |
| 32. | Nashua | 4.6% | 1.8%(+2.80)#32 | 1.9%(+2.74)#2,117 |
| 33. | Evergreen | 4.5% | 1.8%(+2.65)#33 | 1.9%(+2.59)#2,221 |
| 34. | Lame Deer | 4.4% | 1.8%(+2.57)#34 | 1.9%(+2.52)#2,282 |
| 35. | Grass Range | 4.3% | 1.8%(+2.51)#35 | 1.9%(+2.46)#2,335 |
| 36. | Malmstrom Afb | 4.3% | 1.8%(+2.46)#36 | 1.9%(+2.40)#2,367 |
| 37. | Hays | 4.2% | 1.8%(+2.40)#37 | 1.9%(+2.35)#2,411 |
| 38. | Whitefish | 4.1% | 1.8%(+2.31)#38 | 1.9%(+2.25)#2,504 |
| 39. | Bigfork | 4.0% | 1.8%(+2.16)#39 | 1.9%(+2.10)#2,665 |
| 40. | Big Timber | 3.9% | 1.8%(+2.05)#40 | 1.9%(+1.99)#2,792 |
| 41. | Saco | 3.7% | 1.8%(+1.92)#41 | 1.9%(+1.86)#2,951 |
| 42. | Corvallis | 3.7% | 1.8%(+1.87)#42 | 1.9%(+1.81)#3,007 |
| 43. | Columbia Falls | 3.6% | 1.8%(+1.79)#43 | 1.9%(+1.73)#3,131 |
| 44. | Helena Valley Southeast | 3.5% | 1.8%(+1.71)#44 | 1.9%(+1.65)#3,233 |
| 45. | Roy | 3.4% | 1.8%(+1.61)#45 | 1.9%(+1.56)#3,362 |
| 46. | Libby | 3.4% | 1.8%(+1.54)#46 | 1.9%(+1.48)#3,473 |
| 47. | Plains | 3.4% | 1.8%(+1.52)#47 | 1.9%(+1.46)#3,489 |
| 48. | Fortine | 3.2% | 1.8%(+1.41)#48 | 1.9%(+1.36)#3,688 |
| 49. | Kevin | 3.1% | 1.8%(+1.29)#49 | 1.9%(+1.23)#3,901 |
| 50. | Beaver Creek | 3.1% | 1.8%(+1.22)#50 | 1.9%(+1.16)#4,017 |
| 51. | Rocky Boy West | 3.0% | 1.8%(+1.20)#51 | 1.9%(+1.14)#4,070 |
| 52. | Twin Bridges | 3.0% | 1.8%(+1.15)#52 | 1.9%(+1.09)#4,151 |
| 53. | Florence | 2.9% | 1.8%(+1.05)#53 | 1.9%(+0.993)#4,349 |
| 54. | Helena Flats | 2.8% | 1.8%(+1.01)#54 | 1.9%(+0.947)#4,448 |
| 55. | Helena Valley Northeast | 2.7% | 1.8%(+0.907)#55 | 1.9%(+0.849)#4,683 |
| 56. | Conrad | 2.7% | 1.8%(+0.834)#56 | 1.9%(+0.776)#4,867 |
| 57. | Heart Butte | 2.6% | 1.8%(+0.798)#57 | 1.9%(+0.740)#4,967 |
| 58. | South Browning | 2.6% | 1.8%(+0.771)#58 | 1.9%(+0.713)#5,049 |
| 59. | Twin Creeks | 2.6% | 1.8%(+0.752)#59 | 1.9%(+0.694)#5,098 |
| 60. | Crow Agency | 2.6% | 1.8%(+0.730)#60 | 1.9%(+0.672)#5,168 |
| 61. | Forsyth | 2.5% | 1.8%(+0.679)#61 | 1.9%(+0.621)#5,300 |
| 62. | Bozeman | 2.5% | 1.8%(+0.624)#62 | 1.9%(+0.566)#5,455 |
| 63. | Billings | 2.4% | 1.8%(+0.531)#63 | 1.9%(+0.473)#5,774 |
| 64. | Lincoln | 2.3% | 1.8%(+0.487)#64 | 1.9%(+0.429)#5,903 |
| 65. | Great Falls | 2.3% | 1.8%(+0.483)#65 | 1.9%(+0.425)#5,912 |
| 66. | Chinook | 2.1% | 1.8%(+0.269)#66 | 1.9%(+0.211)#6,661 |
| 67. | Park City | 2.0% | 1.8%(+0.182)#67 | 1.9%(+0.124)#6,978 |
| 68. | Fort Benton | 2.0% | 1.8%(+0.163)#68 | 1.9%(+0.105)#7,067 |
| 69. | Belgrade | 2.0% | 1.8%(+0.123)#69 | 1.9%(+0.065)#7,237 |
| 70. | Walkerville | 1.9% | 1.8%(+0.108)#70 | 1.9%(+0.050)#7,285 |
| 71. | Hysham | 1.9% | 1.8%(+0.108)#71 | 1.9%(+0.050)#7,286 |
| 72. | Lewistown | 1.9% | 1.8%(+0.092)#72 | 1.9%(+0.034)#7,348 |
| 73. | Poplar | 1.9% | 1.8%(+0.044)#73 | 1.9%(-0.014)#7,537 |
| 74. | Gardiner | 1.8% | 1.8%(+0.008)#74 | 1.9%(-0.050)#7,666 |
| 75. | Pioneer Junction | 1.8% | 1.8%(+0.005)#75 | 1.9%(-0.053)#7,680 |
| 76. | Colstrip | 1.8% | 1.8%(-0.036)#76 | 1.9%(-0.094)#7,843 |
| 77. | Roundup | 1.8% | 1.8%(-0.064)#77 | 1.9%(-0.122)#7,960 |
| 78. | Missoula | 1.7% | 1.8%(-0.087)#78 | 1.9%(-0.145)#8,061 |
| 79. | Vaughn | 1.7% | 1.8%(-0.135)#79 | 1.9%(-0.193)#8,291 |
| 80. | Harlowton | 1.7% | 1.8%(-0.158)#80 | 1.9%(-0.216)#8,411 |
| 81. | Montana City | 1.7% | 1.8%(-0.164)#81 | 1.9%(-0.222)#8,436 |
| 82. | Jordan | 1.6% | 1.8%(-0.203)#82 | 1.9%(-0.261)#8,628 |
| 83. | West Yellowstone | 1.6% | 1.8%(-0.223)#83 | 1.9%(-0.281)#8,723 |
| 84. | Kalispell | 1.6% | 1.8%(-0.226)#84 | 1.9%(-0.284)#8,736 |
| 85. | Three Forks | 1.6% | 1.8%(-0.227)#85 | 1.9%(-0.285)#8,737 |
| 86. | Clinton | 1.6% | 1.8%(-0.242)#86 | 1.9%(-0.300)#8,811 |
| 87. | Butte Silver Bow Balance | 1.5% | 1.8%(-0.285)#87 | 1.9%(-0.343)#9,035 |
| 88. | St Ignatius | 1.5% | 1.8%(-0.300)#88 | 1.9%(-0.358)#9,118 |
| 89. | Ennis | 1.5% | 1.8%(-0.330)#89 | 1.9%(-0.388)#9,281 |
| 90. | Wolf Point | 1.5% | 1.8%(-0.332)#90 | 1.9%(-0.390)#9,289 |
| 91. | Helena Valley West Central | 1.4% | 1.8%(-0.388)#91 | 1.9%(-0.446)#9,587 |
| 92. | Whitehall | 1.4% | 1.8%(-0.412)#92 | 1.9%(-0.470)#9,698 |
| 93. | Bonner West Riverside | 1.4% | 1.8%(-0.451)#93 | 1.9%(-0.509)#9,894 |
| 94. | Anaconda Deer Lodge County | 1.4% | 1.8%(-0.479)#94 | 1.9%(-0.537)#10,031 |
| 95. | Browning | 1.3% | 1.8%(-0.500)#95 | 1.9%(-0.558)#10,143 |
| 96. | Four Corners | 1.3% | 1.8%(-0.510)#96 | 1.9%(-0.568)#10,194 |
| 97. | East Missoula | 1.3% | 1.8%(-0.535)#97 | 1.9%(-0.593)#10,316 |
| 98. | Eureka | 1.3% | 1.8%(-0.544)#98 | 1.9%(-0.602)#10,372 |
| 99. | Cut Bank | 1.2% | 1.8%(-0.589)#99 | 1.9%(-0.647)#10,620 |
| 100. | Helena | 1.2% | 1.8%(-0.592)#100 | 1.9%(-0.650)#10,638 |
Common Questions
What are the Top 10 Cities with the Highest Percentage of Population Employed in Real Estate, Rental & Leasing in Montana?
Top 10 Cities with the Highest Percentage of Population Employed in Real Estate, Rental & Leasing in Montana are:
#1
42.9%
#2
39.2%
#3
36.9%
#4
18.8%
#5
16.3%
#6
9.6%
#7
8.9%
#8
8.1%
#9
8.1%
#10
8.0%
What city has the Highest Percentage of Population Employed in Real Estate, Rental & Leasing in Montana?
Klein has the Highest Percentage of Population Employed in Real Estate, Rental & Leasing in Montana with 42.9%.
What is the Percentage of Population Employed in Real Estate, Rental & Leasing in the State of Montana?
Percentage of Population Employed in Real Estate, Rental & Leasing in Montana is 1.8%.
What is the Percentage of Population Employed in Real Estate, Rental & Leasing in the United States?
Percentage of Population Employed in Real Estate, Rental & Leasing in the United States is 1.9%.