Cities with the Highest Percentage of Population Employed in Real Estate, Rental & Leasing in Kentucky
RELATED REPORTS & OPTIONS
Real Estate, Rental & Leasing
Kentucky
Compare Cities
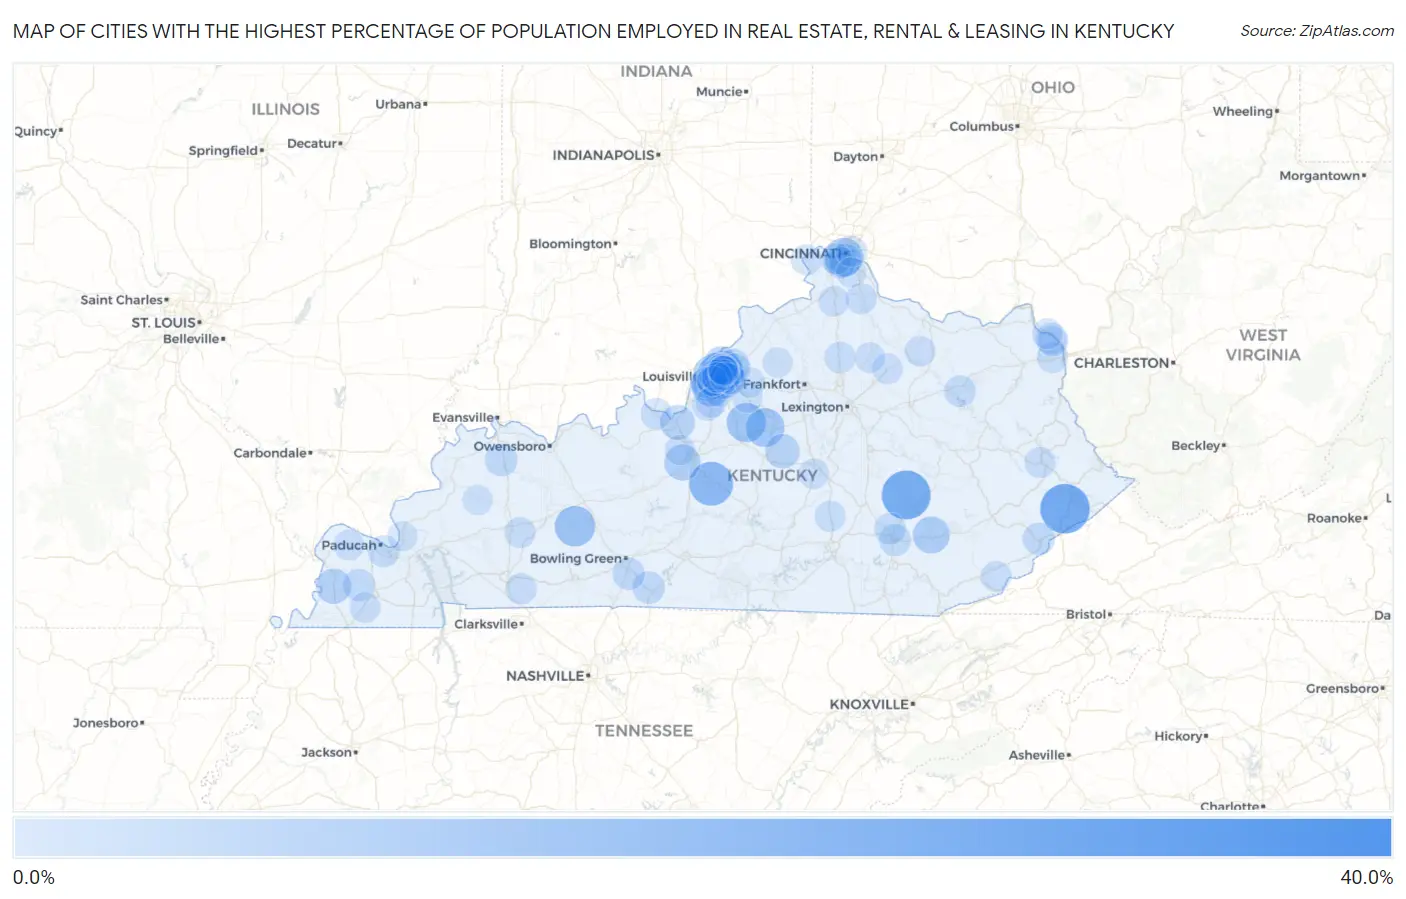
Map of Cities with the Highest Percentage of Population Employed in Real Estate, Rental & Leasing in Kentucky
0.0%
40.0%
Cities with the Highest Percentage of Population Employed in Real Estate, Rental & Leasing in Kentucky
| City | % Employed | vs State | vs National | |
| 1. | Curdsville | 38.1% | 1.4%(+36.7)#1 | 1.9%(+36.2)#45 |
| 2. | Virgie | 26.6% | 1.4%(+25.2)#2 | 1.9%(+24.7)#90 |
| 3. | Mckee | 25.6% | 1.4%(+24.3)#3 | 1.9%(+23.7)#103 |
| 4. | Buffalo | 19.5% | 1.4%(+18.1)#4 | 1.9%(+17.6)#155 |
| 5. | Rochester | 15.2% | 1.4%(+13.9)#5 | 1.9%(+13.3)#239 |
| 6. | Fairfield | 13.6% | 1.4%(+12.3)#6 | 1.9%(+11.7)#293 |
| 7. | Chaplin | 13.3% | 1.4%(+11.9)#7 | 1.9%(+11.4)#302 |
| 8. | Ten Broeck | 12.9% | 1.4%(+11.5)#8 | 1.9%(+11.0)#321 |
| 9. | Park Hills | 12.8% | 1.4%(+11.5)#9 | 1.9%(+10.9)#328 |
| 10. | Mockingbird Valley | 12.1% | 1.4%(+10.7)#10 | 1.9%(+10.2)#373 |
| 11. | Glenview Manor | 11.9% | 1.4%(+10.5)#11 | 1.9%(+9.99)#383 |
| 12. | Poplar Hills | 11.7% | 1.4%(+10.4)#12 | 1.9%(+9.85)#394 |
| 13. | Manchester | 10.8% | 1.4%(+9.47)#13 | 1.9%(+8.94)#460 |
| 14. | Creekside | 10.3% | 1.4%(+8.97)#14 | 1.9%(+8.44)#498 |
| 15. | Meadowbrook Farm | 10.0% | 1.4%(+8.64)#15 | 1.9%(+8.11)#536 |
| 16. | Lincolnshire | 10.0% | 1.4%(+8.64)#16 | 1.9%(+8.11)#537 |
| 17. | Cecilia | 9.9% | 1.4%(+8.51)#17 | 1.9%(+7.98)#552 |
| 18. | Arlington | 8.7% | 1.4%(+7.34)#18 | 1.9%(+6.80)#692 |
| 19. | Kingsley | 8.4% | 1.4%(+7.04)#19 | 1.9%(+6.51)#742 |
| 20. | Muldraugh | 8.2% | 1.4%(+6.81)#20 | 1.9%(+6.28)#788 |
| 21. | Hills And Dales | 7.9% | 1.4%(+6.58)#21 | 1.9%(+6.04)#837 |
| 22. | Mackville | 7.8% | 1.4%(+6.47)#22 | 1.9%(+5.93)#856 |
| 23. | Prospect | 7.6% | 1.4%(+6.28)#23 | 1.9%(+5.75)#895 |
| 24. | Audubon Park | 7.5% | 1.4%(+6.18)#24 | 1.9%(+5.64)#924 |
| 25. | Sorgho | 7.2% | 1.4%(+5.88)#25 | 1.9%(+5.35)#981 |
| 26. | Beechwood Village | 6.6% | 1.4%(+5.25)#26 | 1.9%(+4.72)#1,151 |
| 27. | Brownsboro Village | 6.5% | 1.4%(+5.19)#27 | 1.9%(+4.66)#1,175 |
| 28. | Bellewood | 6.5% | 1.4%(+5.14)#28 | 1.9%(+4.61)#1,189 |
| 29. | Rolling Fields | 6.4% | 1.4%(+5.05)#29 | 1.9%(+4.52)#1,212 |
| 30. | Indian Hills | 6.4% | 1.4%(+5.02)#30 | 1.9%(+4.49)#1,226 |
| 31. | Crossgate | 5.9% | 1.4%(+4.58)#31 | 1.9%(+4.05)#1,405 |
| 32. | Scottsville | 5.6% | 1.4%(+4.22)#32 | 1.9%(+3.69)#1,554 |
| 33. | Robards | 5.4% | 1.4%(+4.09)#33 | 1.9%(+3.56)#1,614 |
| 34. | Whitesburg | 5.4% | 1.4%(+4.02)#34 | 1.9%(+3.48)#1,652 |
| 35. | Forest Hills | 5.4% | 1.4%(+4.00)#35 | 1.9%(+3.47)#1,663 |
| 36. | Spring Valley | 5.3% | 1.4%(+3.96)#36 | 1.9%(+3.42)#1,680 |
| 37. | Kenton Vale | 5.3% | 1.4%(+3.90)#37 | 1.9%(+3.37)#1,709 |
| 38. | Plano | 5.2% | 1.4%(+3.87)#38 | 1.9%(+3.33)#1,730 |
| 39. | Fancy Farm | 5.1% | 1.4%(+3.77)#39 | 1.9%(+3.24)#1,789 |
| 40. | Woodland Hills | 4.9% | 1.4%(+3.58)#40 | 1.9%(+3.05)#1,895 |
| 41. | London | 4.9% | 1.4%(+3.57)#41 | 1.9%(+3.04)#1,903 |
| 42. | Crestwood | 4.7% | 1.4%(+3.38)#42 | 1.9%(+2.85)#2,033 |
| 43. | Farley | 4.7% | 1.4%(+3.30)#43 | 1.9%(+2.77)#2,089 |
| 44. | Richlawn | 4.5% | 1.4%(+3.19)#44 | 1.9%(+2.65)#2,175 |
| 45. | Russell | 4.5% | 1.4%(+3.13)#45 | 1.9%(+2.59)#2,217 |
| 46. | Lakeview Heights | 4.4% | 1.4%(+3.05)#46 | 1.9%(+2.52)#2,277 |
| 47. | Glenview Hills | 4.4% | 1.4%(+3.04)#47 | 1.9%(+2.50)#2,297 |
| 48. | East Bernstadt | 4.4% | 1.4%(+3.00)#48 | 1.9%(+2.47)#2,313 |
| 49. | Thornhill | 4.3% | 1.4%(+2.90)#49 | 1.9%(+2.36)#2,397 |
| 50. | Glenview | 4.2% | 1.4%(+2.82)#50 | 1.9%(+2.29)#2,461 |
| 51. | Lakeside Park | 4.2% | 1.4%(+2.80)#51 | 1.9%(+2.27)#2,481 |
| 52. | Sadieville | 4.0% | 1.4%(+2.66)#52 | 1.9%(+2.13)#2,639 |
| 53. | Barbourmeade | 3.9% | 1.4%(+2.58)#53 | 1.9%(+2.05)#2,727 |
| 54. | Brooks | 3.9% | 1.4%(+2.54)#54 | 1.9%(+2.00)#2,771 |
| 55. | Prestonsburg | 3.9% | 1.4%(+2.53)#55 | 1.9%(+2.00)#2,779 |
| 56. | White Plains | 3.9% | 1.4%(+2.50)#56 | 1.9%(+1.97)#2,817 |
| 57. | Brandenburg | 3.8% | 1.4%(+2.48)#57 | 1.9%(+1.94)#2,840 |
| 58. | Villa Hills | 3.8% | 1.4%(+2.44)#58 | 1.9%(+1.91)#2,878 |
| 59. | Windy Hills | 3.8% | 1.4%(+2.44)#59 | 1.9%(+1.91)#2,885 |
| 60. | Dayton | 3.8% | 1.4%(+2.42)#60 | 1.9%(+1.88)#2,914 |
| 61. | Murray Hill | 3.8% | 1.4%(+2.40)#61 | 1.9%(+1.87)#2,936 |
| 62. | Pembroke | 3.7% | 1.4%(+2.37)#62 | 1.9%(+1.84)#2,966 |
| 63. | Butler | 3.6% | 1.4%(+2.25)#63 | 1.9%(+1.72)#3,140 |
| 64. | Eubank | 3.6% | 1.4%(+2.21)#64 | 1.9%(+1.68)#3,192 |
| 65. | Cannonsburg | 3.5% | 1.4%(+2.15)#65 | 1.9%(+1.62)#3,281 |
| 66. | Seneca Gardens | 3.5% | 1.4%(+2.12)#66 | 1.9%(+1.59)#3,305 |
| 67. | Petersburg | 3.4% | 1.4%(+2.06)#67 | 1.9%(+1.53)#3,394 |
| 68. | Goose Creek | 3.4% | 1.4%(+2.03)#68 | 1.9%(+1.50)#3,439 |
| 69. | Pewee Valley | 3.4% | 1.4%(+2.03)#69 | 1.9%(+1.49)#3,451 |
| 70. | Parkway Village | 3.4% | 1.4%(+1.99)#70 | 1.9%(+1.46)#3,494 |
| 71. | Bellefonte | 3.3% | 1.4%(+1.99)#71 | 1.9%(+1.45)#3,500 |
| 72. | Millersburg | 3.3% | 1.4%(+1.96)#72 | 1.9%(+1.43)#3,538 |
| 73. | Norbourne Estates | 3.3% | 1.4%(+1.96)#73 | 1.9%(+1.43)#3,556 |
| 74. | Evarts | 3.3% | 1.4%(+1.92)#74 | 1.9%(+1.39)#3,615 |
| 75. | Wingo | 3.2% | 1.4%(+1.89)#75 | 1.9%(+1.36)#3,684 |
| 76. | Graymoor Devondale | 3.2% | 1.4%(+1.86)#76 | 1.9%(+1.33)#3,732 |
| 77. | Crittenden | 3.1% | 1.4%(+1.79)#77 | 1.9%(+1.26)#3,852 |
| 78. | Worthington | 3.1% | 1.4%(+1.78)#78 | 1.9%(+1.25)#3,870 |
| 79. | Lyndon | 3.1% | 1.4%(+1.74)#79 | 1.9%(+1.21)#3,926 |
| 80. | Kevil | 3.1% | 1.4%(+1.72)#80 | 1.9%(+1.19)#3,960 |
| 81. | Junction City | 3.0% | 1.4%(+1.69)#81 | 1.9%(+1.16)#4,032 |
| 82. | Hollow Creek | 3.0% | 1.4%(+1.67)#82 | 1.9%(+1.14)#4,072 |
| 83. | Cynthiana | 3.0% | 1.4%(+1.64)#83 | 1.9%(+1.10)#4,131 |
| 84. | Ewing | 3.0% | 1.4%(+1.61)#84 | 1.9%(+1.08)#4,174 |
| 85. | Hunters Hollow | 2.9% | 1.4%(+1.58)#85 | 1.9%(+1.05)#4,240 |
| 86. | Druid Hills | 2.9% | 1.4%(+1.53)#86 | 1.9%(+0.998)#4,342 |
| 87. | Rineyville | 2.9% | 1.4%(+1.52)#87 | 1.9%(+0.987)#4,364 |
| 88. | Middletown | 2.8% | 1.4%(+1.42)#88 | 1.9%(+0.886)#4,581 |
| 89. | Brownsboro Farm | 2.8% | 1.4%(+1.41)#89 | 1.9%(+0.876)#4,606 |
| 90. | Providence | 2.8% | 1.4%(+1.40)#90 | 1.9%(+0.870)#4,625 |
| 91. | Pleasureville | 2.7% | 1.4%(+1.39)#91 | 1.9%(+0.853)#4,674 |
| 92. | St Matthews | 2.7% | 1.4%(+1.38)#92 | 1.9%(+0.845)#4,692 |
| 93. | Strathmoor Manor | 2.7% | 1.4%(+1.33)#93 | 1.9%(+0.801)#4,805 |
| 94. | Elk Creek | 2.7% | 1.4%(+1.31)#94 | 1.9%(+0.780)#4,854 |
| 95. | Langdon Place | 2.7% | 1.4%(+1.31)#95 | 1.9%(+0.778)#4,862 |
| 96. | Simpsonville | 2.7% | 1.4%(+1.29)#96 | 1.9%(+0.762)#4,918 |
| 97. | Ryland Heights | 2.6% | 1.4%(+1.27)#97 | 1.9%(+0.740)#4,963 |
| 98. | Wildwood | 2.6% | 1.4%(+1.27)#98 | 1.9%(+0.740)#4,973 |
| 99. | Smithland | 2.6% | 1.4%(+1.25)#99 | 1.9%(+0.717)#5,040 |
| 100. | Manor Creek | 2.5% | 1.4%(+1.19)#100 | 1.9%(+0.656)#5,212 |
Common Questions
What are the Top 10 Cities with the Highest Percentage of Population Employed in Real Estate, Rental & Leasing in Kentucky?
Top 10 Cities with the Highest Percentage of Population Employed in Real Estate, Rental & Leasing in Kentucky are:
#1
26.6%
#2
25.6%
#3
19.5%
#4
15.2%
#5
13.6%
#6
13.3%
#7
12.9%
#8
12.8%
#9
12.1%
#10
11.9%
What city has the Highest Percentage of Population Employed in Real Estate, Rental & Leasing in Kentucky?
Virgie has the Highest Percentage of Population Employed in Real Estate, Rental & Leasing in Kentucky with 26.6%.
What is the Percentage of Population Employed in Real Estate, Rental & Leasing in the State of Kentucky?
Percentage of Population Employed in Real Estate, Rental & Leasing in Kentucky is 1.4%.
What is the Percentage of Population Employed in Real Estate, Rental & Leasing in the United States?
Percentage of Population Employed in Real Estate, Rental & Leasing in the United States is 1.9%.