Cities with the Highest Percentage of Population Employed in Real Estate, Rental & Leasing in Oregon
RELATED REPORTS & OPTIONS
Real Estate, Rental & Leasing
Oregon
Compare Cities
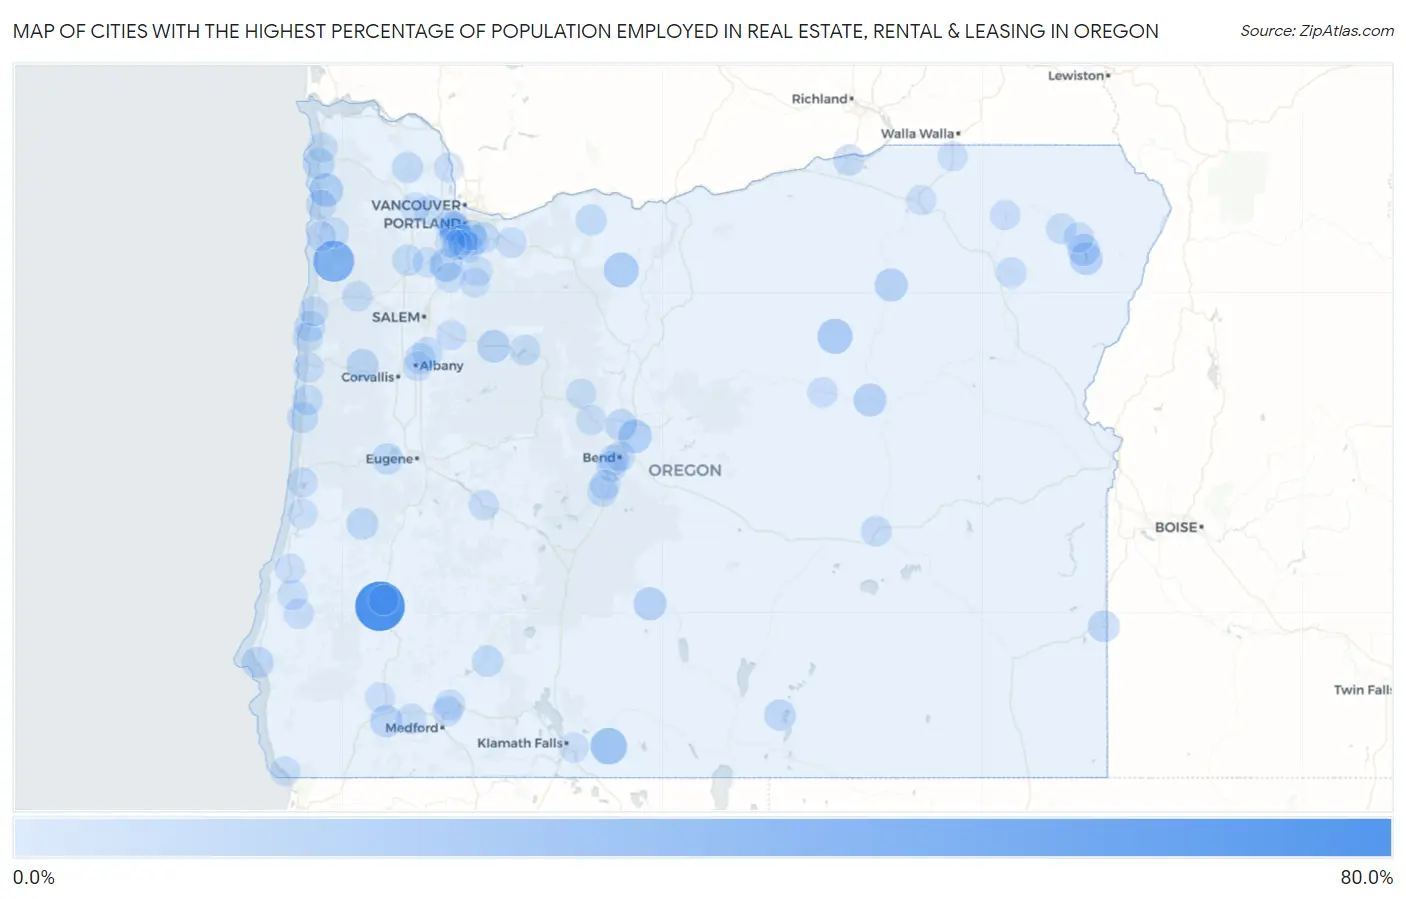
Map of Cities with the Highest Percentage of Population Employed in Real Estate, Rental & Leasing in Oregon
0.0%
80.0%
Cities with the Highest Percentage of Population Employed in Real Estate, Rental & Leasing in Oregon
| City | % Employed | vs State | vs National | |
| 1. | Dillard | 67.3% | 2.0%(+65.4)#1 | 1.9%(+65.4)#12 |
| 2. | Beaver | 38.5% | 2.0%(+36.5)#2 | 1.9%(+36.6)#43 |
| 3. | Bonanza | 23.1% | 2.0%(+21.1)#3 | 1.9%(+21.2)#118 |
| 4. | Orient | 18.4% | 2.0%(+16.4)#4 | 1.9%(+16.5)#175 |
| 5. | Monument | 18.0% | 2.0%(+16.1)#5 | 1.9%(+16.1)#181 |
| 6. | Wamic | 17.9% | 2.0%(+15.9)#6 | 1.9%(+16.0)#189 |
| 7. | River Point | 16.4% | 2.0%(+14.5)#7 | 1.9%(+14.5)#208 |
| 8. | Dunthorpe | 15.2% | 2.0%(+13.2)#8 | 1.9%(+13.3)#242 |
| 9. | Dilley | 14.1% | 2.0%(+12.1)#9 | 1.9%(+12.2)#275 |
| 10. | Nehalem | 14.1% | 2.0%(+12.1)#10 | 1.9%(+12.2)#276 |
| 11. | Pronghorn | 13.8% | 2.0%(+11.8)#11 | 1.9%(+11.9)#287 |
| 12. | Butteville | 13.1% | 2.0%(+11.1)#12 | 1.9%(+11.2)#309 |
| 13. | Ukiah | 12.0% | 2.0%(+9.98)#13 | 1.9%(+10.1)#377 |
| 14. | Silver Lake | 11.9% | 2.0%(+9.97)#14 | 1.9%(+10.0)#381 |
| 15. | Mount Vernon | 11.7% | 2.0%(+9.69)#15 | 1.9%(+9.77)#399 |
| 16. | Wallowa Lake | 10.8% | 2.0%(+8.87)#16 | 1.9%(+8.95)#459 |
| 17. | Gates | 10.8% | 2.0%(+8.82)#17 | 1.9%(+8.90)#466 |
| 18. | Ochoco West | 10.1% | 2.0%(+8.13)#18 | 1.9%(+8.21)#525 |
| 19. | New Hope | 9.2% | 2.0%(+7.27)#19 | 1.9%(+7.35)#616 |
| 20. | Joseph | 9.2% | 2.0%(+7.23)#20 | 1.9%(+7.31)#620 |
| 21. | Summit | 9.1% | 2.0%(+7.12)#21 | 1.9%(+7.20)#641 |
| 22. | Eagle Crest | 8.0% | 2.0%(+6.07)#22 | 1.9%(+6.15)#818 |
| 23. | Port Orford | 8.0% | 2.0%(+6.03)#23 | 1.9%(+6.11)#824 |
| 24. | Jordan Valley | 7.8% | 2.0%(+5.82)#24 | 1.9%(+5.90)#861 |
| 25. | Elkton | 7.7% | 2.0%(+5.72)#25 | 1.9%(+5.80)#882 |
| 26. | Cannon Beach | 7.7% | 2.0%(+5.69)#26 | 1.9%(+5.77)#890 |
| 27. | Plush | 7.3% | 2.0%(+5.34)#27 | 1.9%(+5.43)#966 |
| 28. | Prospect | 6.7% | 2.0%(+4.69)#28 | 1.9%(+4.77)#1,119 |
| 29. | Raleigh Hills | 6.7% | 2.0%(+4.68)#29 | 1.9%(+4.76)#1,134 |
| 30. | Veneta | 6.6% | 2.0%(+4.60)#30 | 1.9%(+4.69)#1,161 |
| 31. | Vernonia | 6.4% | 2.0%(+4.41)#31 | 1.9%(+4.49)#1,223 |
| 32. | Umatilla | 6.2% | 2.0%(+4.25)#32 | 1.9%(+4.33)#1,287 |
| 33. | Millersburg | 6.1% | 2.0%(+4.16)#33 | 1.9%(+4.24)#1,322 |
| 34. | Neotsu | 6.1% | 2.0%(+4.10)#34 | 1.9%(+4.18)#1,343 |
| 35. | Metzger | 5.9% | 2.0%(+3.88)#35 | 1.9%(+3.96)#1,437 |
| 36. | Yachats | 5.8% | 2.0%(+3.78)#36 | 1.9%(+3.86)#1,476 |
| 37. | Three Rivers | 5.7% | 2.0%(+3.71)#37 | 1.9%(+3.79)#1,505 |
| 38. | Carlton | 5.6% | 2.0%(+3.60)#38 | 1.9%(+3.68)#1,557 |
| 39. | Mount Hood | 5.5% | 2.0%(+3.53)#39 | 1.9%(+3.61)#1,591 |
| 40. | Lincoln Beach | 5.5% | 2.0%(+3.52)#40 | 1.9%(+3.60)#1,597 |
| 41. | Happy Valley | 5.2% | 2.0%(+3.18)#41 | 1.9%(+3.26)#1,777 |
| 42. | Tetherow | 5.1% | 2.0%(+3.12)#42 | 1.9%(+3.20)#1,803 |
| 43. | Eagle Point | 5.1% | 2.0%(+3.10)#43 | 1.9%(+3.18)#1,824 |
| 44. | Mapleton | 5.0% | 2.0%(+3.06)#44 | 1.9%(+3.14)#1,840 |
| 45. | Detroit | 5.0% | 2.0%(+3.03)#45 | 1.9%(+3.11)#1,866 |
| 46. | Seventh Mountain | 4.9% | 2.0%(+2.90)#46 | 1.9%(+2.99)#1,935 |
| 47. | Jefferson | 4.8% | 2.0%(+2.82)#47 | 1.9%(+2.90)#1,995 |
| 48. | Lostine | 4.7% | 2.0%(+2.76)#48 | 1.9%(+2.84)#2,041 |
| 49. | Waldport | 4.7% | 2.0%(+2.70)#49 | 1.9%(+2.78)#2,076 |
| 50. | Enterprise | 4.6% | 2.0%(+2.65)#50 | 1.9%(+2.73)#2,118 |
| 51. | Foots Creek | 4.6% | 2.0%(+2.64)#51 | 1.9%(+2.72)#2,132 |
| 52. | Burns | 4.4% | 2.0%(+2.47)#52 | 1.9%(+2.55)#2,251 |
| 53. | Cedar Hills | 4.2% | 2.0%(+2.27)#53 | 1.9%(+2.36)#2,404 |
| 54. | Rockaway Beach | 4.2% | 2.0%(+2.22)#54 | 1.9%(+2.30)#2,452 |
| 55. | Oatfield | 4.1% | 2.0%(+2.17)#55 | 1.9%(+2.25)#2,500 |
| 56. | West Slope | 4.1% | 2.0%(+2.13)#56 | 1.9%(+2.21)#2,553 |
| 57. | Union | 4.1% | 2.0%(+2.13)#57 | 1.9%(+2.21)#2,557 |
| 58. | Tillamook | 4.0% | 2.0%(+2.07)#58 | 1.9%(+2.15)#2,617 |
| 59. | Newport | 4.0% | 2.0%(+2.05)#59 | 1.9%(+2.13)#2,640 |
| 60. | Dunes City | 4.0% | 2.0%(+2.01)#60 | 1.9%(+2.09)#2,682 |
| 61. | Westfir | 3.9% | 2.0%(+1.96)#61 | 1.9%(+2.05)#2,730 |
| 62. | White City | 3.9% | 2.0%(+1.89)#62 | 1.9%(+1.97)#2,812 |
| 63. | Dayville | 3.8% | 2.0%(+1.87)#63 | 1.9%(+1.95)#2,827 |
| 64. | Sandy | 3.8% | 2.0%(+1.81)#64 | 1.9%(+1.89)#2,907 |
| 65. | Santa Clara | 3.7% | 2.0%(+1.77)#65 | 1.9%(+1.85)#2,957 |
| 66. | Sublimity | 3.7% | 2.0%(+1.76)#66 | 1.9%(+1.84)#2,962 |
| 67. | Grand Ronde | 3.7% | 2.0%(+1.72)#67 | 1.9%(+1.80)#3,030 |
| 68. | Myrtle Point | 3.6% | 2.0%(+1.61)#68 | 1.9%(+1.70)#3,173 |
| 69. | Sunriver | 3.5% | 2.0%(+1.56)#69 | 1.9%(+1.64)#3,247 |
| 70. | Stafford | 3.5% | 2.0%(+1.56)#70 | 1.9%(+1.64)#3,248 |
| 71. | West Linn | 3.5% | 2.0%(+1.49)#71 | 1.9%(+1.58)#3,330 |
| 72. | Green | 3.5% | 2.0%(+1.48)#72 | 1.9%(+1.56)#3,346 |
| 73. | Lake Oswego | 3.4% | 2.0%(+1.38)#73 | 1.9%(+1.46)#3,490 |
| 74. | Milwaukie | 3.3% | 2.0%(+1.35)#74 | 1.9%(+1.44)#3,536 |
| 75. | Bend | 3.3% | 2.0%(+1.35)#75 | 1.9%(+1.43)#3,539 |
| 76. | Rivergrove | 3.3% | 2.0%(+1.35)#76 | 1.9%(+1.43)#3,550 |
| 77. | Depoe Bay | 3.3% | 2.0%(+1.33)#77 | 1.9%(+1.42)#3,572 |
| 78. | Coquille | 3.2% | 2.0%(+1.20)#78 | 1.9%(+1.28)#3,812 |
| 79. | Elgin | 3.1% | 2.0%(+1.18)#79 | 1.9%(+1.26)#3,851 |
| 80. | Altamont | 3.0% | 2.0%(+1.01)#80 | 1.9%(+1.09)#4,154 |
| 81. | Seaside | 3.0% | 2.0%(+0.988)#81 | 1.9%(+1.07)#4,199 |
| 82. | Mulino | 2.9% | 2.0%(+0.968)#82 | 1.9%(+1.05)#4,230 |
| 83. | Netarts | 2.9% | 2.0%(+0.919)#83 | 1.9%(+1.00)#4,337 |
| 84. | Merlin | 2.9% | 2.0%(+0.916)#84 | 1.9%(+0.998)#4,343 |
| 85. | St Helens | 2.9% | 2.0%(+0.886)#85 | 1.9%(+0.968)#4,402 |
| 86. | Harbor | 2.8% | 2.0%(+0.855)#86 | 1.9%(+0.937)#4,476 |
| 87. | King City | 2.8% | 2.0%(+0.828)#87 | 1.9%(+0.910)#4,544 |
| 88. | Bunker Hill | 2.8% | 2.0%(+0.801)#88 | 1.9%(+0.883)#4,600 |
| 89. | Reedsport | 2.8% | 2.0%(+0.799)#89 | 1.9%(+0.881)#4,602 |
| 90. | North Plains | 2.7% | 2.0%(+0.752)#90 | 1.9%(+0.834)#4,716 |
| 91. | Dundee | 2.7% | 2.0%(+0.746)#91 | 1.9%(+0.828)#4,729 |
| 92. | Hubbard | 2.7% | 2.0%(+0.744)#92 | 1.9%(+0.825)#4,737 |
| 93. | Mission | 2.7% | 2.0%(+0.729)#93 | 1.9%(+0.811)#4,775 |
| 94. | Lincoln City | 2.6% | 2.0%(+0.675)#94 | 1.9%(+0.756)#4,932 |
| 95. | Camp Sherman | 2.6% | 2.0%(+0.624)#95 | 1.9%(+0.706)#5,070 |
| 96. | Banks | 2.6% | 2.0%(+0.616)#96 | 1.9%(+0.698)#5,090 |
| 97. | Milton Freewater | 2.6% | 2.0%(+0.608)#97 | 1.9%(+0.689)#5,117 |
| 98. | Albany | 2.6% | 2.0%(+0.595)#98 | 1.9%(+0.677)#5,159 |
| 99. | Molalla | 2.5% | 2.0%(+0.574)#99 | 1.9%(+0.656)#5,213 |
| 100. | Sisters | 2.4% | 2.0%(+0.470)#100 | 1.9%(+0.551)#5,504 |
Common Questions
What are the Top 10 Cities with the Highest Percentage of Population Employed in Real Estate, Rental & Leasing in Oregon?
Top 10 Cities with the Highest Percentage of Population Employed in Real Estate, Rental & Leasing in Oregon are:
#1
67.3%
#2
38.5%
#3
23.1%
#4
18.0%
#5
17.9%
#6
14.1%
#7
13.8%
#8
13.1%
#9
12.0%
#10
11.9%
What city has the Highest Percentage of Population Employed in Real Estate, Rental & Leasing in Oregon?
Dillard has the Highest Percentage of Population Employed in Real Estate, Rental & Leasing in Oregon with 67.3%.
What is the Percentage of Population Employed in Real Estate, Rental & Leasing in the State of Oregon?
Percentage of Population Employed in Real Estate, Rental & Leasing in Oregon is 2.0%.
What is the Percentage of Population Employed in Real Estate, Rental & Leasing in the United States?
Percentage of Population Employed in Real Estate, Rental & Leasing in the United States is 1.9%.