Zip Codes with the Highest Percentage of Population Employed in Real Estate, Rental & Leasing in Culver City, CA
RELATED REPORTS & OPTIONS
Real Estate, Rental & Leasing
Culver City
Compare Zip Codes
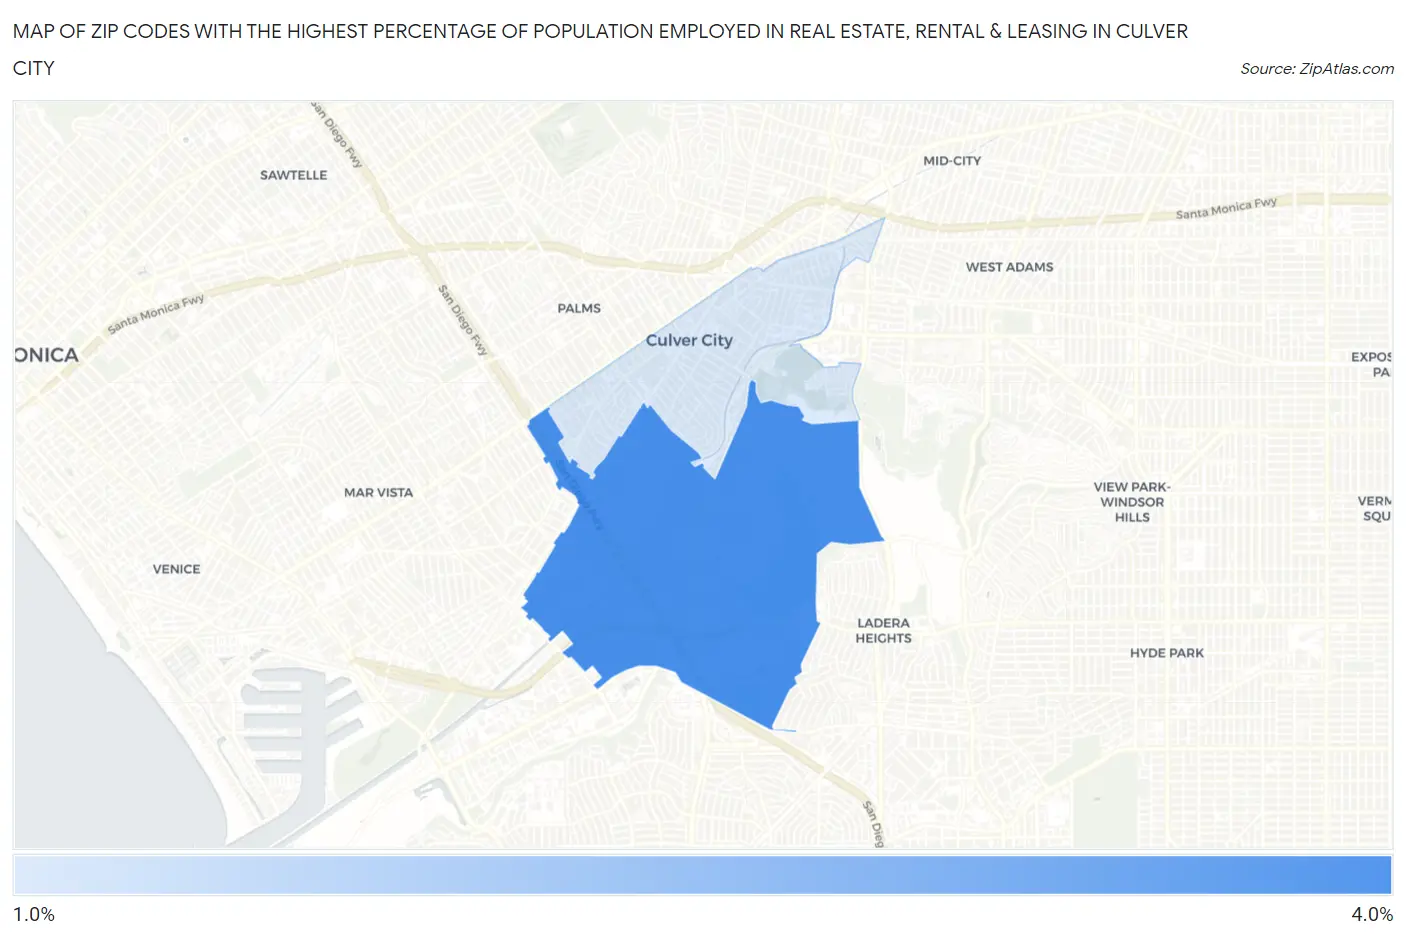
Map of Zip Codes with the Highest Percentage of Population Employed in Real Estate, Rental & Leasing in Culver City
1.7%
3.6%
Zip Codes with the Highest Percentage of Population Employed in Real Estate, Rental & Leasing in Culver City, CA
| Zip Code | % Employed | vs State | vs National | |
| 1. | 90230 | 3.6% | 2.1%(+1.44)#247 | 1.9%(+1.66)#2,745 |
| 2. | 90232 | 1.7% | 2.1%(-0.372)#824 | 1.9%(-0.144)#9,451 |
1
Common Questions
What are the Top Zip Codes with the Highest Percentage of Population Employed in Real Estate, Rental & Leasing in Culver City, CA?
Top Zip Codes with the Highest Percentage of Population Employed in Real Estate, Rental & Leasing in Culver City, CA are:
What zip code has the Highest Percentage of Population Employed in Real Estate, Rental & Leasing in Culver City, CA?
90230 has the Highest Percentage of Population Employed in Real Estate, Rental & Leasing in Culver City, CA with 3.6%.
What is the Percentage of Population Employed in Real Estate, Rental & Leasing in Culver City, CA?
Percentage of Population Employed in Real Estate, Rental & Leasing in Culver City is 2.9%.
What is the Percentage of Population Employed in Real Estate, Rental & Leasing in California?
Percentage of Population Employed in Real Estate, Rental & Leasing in California is 2.1%.
What is the Percentage of Population Employed in Real Estate, Rental & Leasing in the United States?
Percentage of Population Employed in Real Estate, Rental & Leasing in the United States is 1.9%.