Cities with the Highest Percentage of Population Employed in Real Estate, Rental & Leasing in Oklahoma
RELATED REPORTS & OPTIONS
Real Estate, Rental & Leasing
Oklahoma
Compare Cities
Map of Cities with the Highest Percentage of Population Employed in Real Estate, Rental & Leasing in Oklahoma
0.0%
40.0%
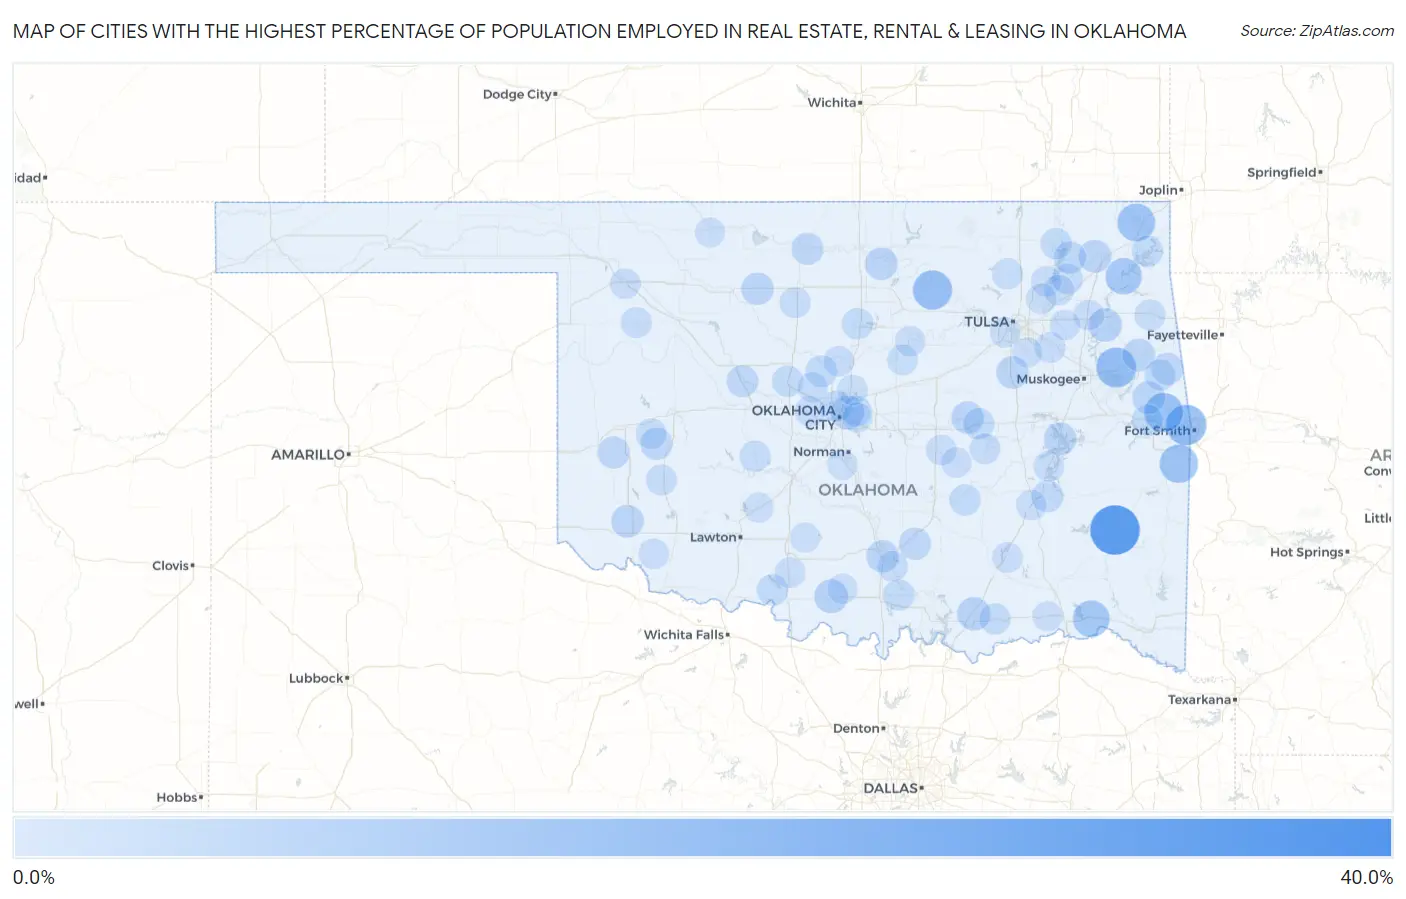
Cities with the Highest Percentage of Population Employed in Real Estate, Rental & Leasing in Oklahoma
| City | % Employed | vs State | vs National | |
| 1. | Baker | 32.8% | 1.6%(+31.2)#1 | 1.9%(+30.9)#60 |
| 2. | Albion | 28.6% | 1.6%(+27.0)#2 | 1.9%(+26.7)#74 |
| 3. | Moffett | 15.8% | 1.6%(+14.2)#3 | 1.9%(+13.9)#223 |
| 4. | Woodall | 15.0% | 1.6%(+13.4)#4 | 1.9%(+13.1)#250 |
| 5. | Skedee | 14.3% | 1.6%(+12.7)#5 | 1.9%(+12.4)#271 |
| 6. | Akins | 13.8% | 1.6%(+12.2)#6 | 1.9%(+11.9)#284 |
| 7. | Cameron | 12.9% | 1.6%(+11.3)#7 | 1.9%(+11.0)#320 |
| 8. | Dotyville | 12.3% | 1.6%(+10.7)#8 | 1.9%(+10.4)#358 |
| 9. | Milfay | 12.2% | 1.6%(+10.7)#9 | 1.9%(+10.4)#365 |
| 10. | Pumpkin Hollow | 11.5% | 1.6%(+9.95)#10 | 1.9%(+9.65)#408 |
| 11. | Ingalls | 11.0% | 1.6%(+9.38)#11 | 1.9%(+9.08)#445 |
| 12. | Fort Towson | 10.8% | 1.6%(+9.23)#12 | 1.9%(+8.93)#462 |
| 13. | Disney | 10.3% | 1.6%(+8.66)#13 | 1.9%(+8.36)#509 |
| 14. | Golden | 9.1% | 1.6%(+7.50)#14 | 1.9%(+7.20)#644 |
| 15. | Ringling | 7.0% | 1.6%(+5.41)#15 | 1.9%(+5.11)#1,044 |
| 16. | Forest Park | 6.9% | 1.6%(+5.34)#16 | 1.9%(+5.04)#1,059 |
| 17. | Cedar Crest | 6.7% | 1.6%(+5.14)#17 | 1.9%(+4.84)#1,110 |
| 18. | Armstrong | 6.4% | 1.6%(+4.79)#18 | 1.9%(+4.49)#1,221 |
| 19. | Whitehorn Cove | 6.2% | 1.6%(+4.66)#19 | 1.9%(+4.36)#1,265 |
| 20. | White Oak | 5.6% | 1.6%(+4.04)#20 | 1.9%(+3.74)#1,529 |
| 21. | Flute Springs | 5.6% | 1.6%(+3.96)#21 | 1.9%(+3.66)#1,566 |
| 22. | Martha | 5.5% | 1.6%(+3.86)#22 | 1.9%(+3.56)#1,611 |
| 23. | Winchester | 5.4% | 1.6%(+3.80)#23 | 1.9%(+3.50)#1,641 |
| 24. | Briggs | 5.4% | 1.6%(+3.77)#24 | 1.9%(+3.47)#1,661 |
| 25. | Marland | 5.3% | 1.6%(+3.74)#25 | 1.9%(+3.44)#1,675 |
| 26. | Nashoba | 5.3% | 1.6%(+3.67)#26 | 1.9%(+3.37)#1,714 |
| 27. | Castle | 5.1% | 1.6%(+3.54)#27 | 1.9%(+3.24)#1,790 |
| 28. | Eufaula | 5.1% | 1.6%(+3.50)#28 | 1.9%(+3.20)#1,804 |
| 29. | Ringwood | 5.1% | 1.6%(+3.48)#29 | 1.9%(+3.18)#1,822 |
| 30. | Davis | 5.0% | 1.6%(+3.45)#30 | 1.9%(+3.15)#1,834 |
| 31. | Hickory | 5.0% | 1.6%(+3.41)#31 | 1.9%(+3.11)#1,865 |
| 32. | Dill City | 5.0% | 1.6%(+3.37)#32 | 1.9%(+3.07)#1,885 |
| 33. | Hochatown | 4.9% | 1.6%(+3.31)#33 | 1.9%(+3.01)#1,920 |
| 34. | Carter | 4.9% | 1.6%(+3.29)#34 | 1.9%(+2.99)#1,940 |
| 35. | New Alluwe | 4.8% | 1.6%(+3.17)#35 | 1.9%(+2.87)#2,015 |
| 36. | Pond Creek | 4.7% | 1.6%(+3.11)#36 | 1.9%(+2.81)#2,056 |
| 37. | Stilwell | 4.6% | 1.6%(+3.00)#37 | 1.9%(+2.71)#2,137 |
| 38. | Greenfield | 4.5% | 1.6%(+2.95)#38 | 1.9%(+2.65)#2,179 |
| 39. | Alderson | 4.3% | 1.6%(+2.72)#39 | 1.9%(+2.42)#2,360 |
| 40. | Cashion | 4.3% | 1.6%(+2.69)#40 | 1.9%(+2.39)#2,373 |
| 41. | Chance | 4.0% | 1.6%(+2.41)#41 | 1.9%(+2.11)#2,659 |
| 42. | Nichols Hills | 3.9% | 1.6%(+2.35)#42 | 1.9%(+2.05)#2,726 |
| 43. | Hastings | 3.8% | 1.6%(+2.25)#43 | 1.9%(+1.95)#2,830 |
| 44. | Orlando | 3.8% | 1.6%(+2.25)#44 | 1.9%(+1.95)#2,832 |
| 45. | Okarche | 3.8% | 1.6%(+2.19)#45 | 1.9%(+1.89)#2,906 |
| 46. | Nowata | 3.7% | 1.6%(+2.15)#46 | 1.9%(+1.85)#2,955 |
| 47. | Bokchito | 3.7% | 1.6%(+2.13)#47 | 1.9%(+1.83)#2,981 |
| 48. | Lyons Switch | 3.7% | 1.6%(+2.11)#48 | 1.9%(+1.81)#3,012 |
| 49. | Okemah | 3.7% | 1.6%(+2.10)#49 | 1.9%(+1.80)#3,033 |
| 50. | Allen | 3.7% | 1.6%(+2.07)#50 | 1.9%(+1.77)#3,068 |
| 51. | Dickson | 3.6% | 1.6%(+2.04)#51 | 1.9%(+1.74)#3,115 |
| 52. | Copeland | 3.6% | 1.6%(+1.97)#52 | 1.9%(+1.67)#3,213 |
| 53. | Sallisaw | 3.5% | 1.6%(+1.93)#53 | 1.9%(+1.63)#3,265 |
| 54. | Gracemont | 3.4% | 1.6%(+1.83)#54 | 1.9%(+1.53)#3,395 |
| 55. | White Eagle | 3.3% | 1.6%(+1.74)#55 | 1.9%(+1.44)#3,516 |
| 56. | Vici | 3.3% | 1.6%(+1.69)#56 | 1.9%(+1.39)#3,605 |
| 57. | Avant | 3.3% | 1.6%(+1.67)#57 | 1.9%(+1.37)#3,652 |
| 58. | Kansas | 3.2% | 1.6%(+1.64)#58 | 1.9%(+1.34)#3,707 |
| 59. | Barber | 3.2% | 1.6%(+1.63)#59 | 1.9%(+1.33)#3,722 |
| 60. | Hobart | 3.2% | 1.6%(+1.63)#60 | 1.9%(+1.33)#3,740 |
| 61. | Cedar Lake | 3.2% | 1.6%(+1.59)#61 | 1.9%(+1.29)#3,791 |
| 62. | Waukomis | 3.2% | 1.6%(+1.59)#62 | 1.9%(+1.29)#3,799 |
| 63. | Wetumka | 3.2% | 1.6%(+1.58)#63 | 1.9%(+1.28)#3,814 |
| 64. | Bushyhead | 3.0% | 1.6%(+1.42)#64 | 1.9%(+1.12)#4,100 |
| 65. | Burns Flat | 3.0% | 1.6%(+1.40)#65 | 1.9%(+1.10)#4,141 |
| 66. | Chouteau | 3.0% | 1.6%(+1.36)#66 | 1.9%(+1.06)#4,206 |
| 67. | Tryon | 2.9% | 1.6%(+1.35)#67 | 1.9%(+1.05)#4,238 |
| 68. | Comanche | 2.9% | 1.6%(+1.33)#68 | 1.9%(+1.03)#4,283 |
| 69. | Coweta | 2.9% | 1.6%(+1.30)#69 | 1.9%(+1.00)#4,334 |
| 70. | Spencer | 2.9% | 1.6%(+1.29)#70 | 1.9%(+0.994)#4,346 |
| 71. | Ripley | 2.8% | 1.6%(+1.24)#71 | 1.9%(+0.938)#4,472 |
| 72. | Toppers | 2.8% | 1.6%(+1.24)#72 | 1.9%(+0.936)#4,478 |
| 73. | Crowder | 2.8% | 1.6%(+1.22)#73 | 1.9%(+0.925)#4,509 |
| 74. | Stringtown | 2.8% | 1.6%(+1.22)#74 | 1.9%(+0.917)#4,533 |
| 75. | Seminole | 2.8% | 1.6%(+1.20)#75 | 1.9%(+0.901)#4,565 |
| 76. | Cedar Valley | 2.8% | 1.6%(+1.17)#76 | 1.9%(+0.871)#4,620 |
| 77. | Yukon | 2.8% | 1.6%(+1.16)#77 | 1.9%(+0.859)#4,654 |
| 78. | Johnson Prairie | 2.7% | 1.6%(+1.11)#78 | 1.9%(+0.811)#4,786 |
| 79. | Oologah | 2.7% | 1.6%(+1.09)#79 | 1.9%(+0.789)#4,832 |
| 80. | Edmond | 2.7% | 1.6%(+1.07)#80 | 1.9%(+0.770)#4,887 |
| 81. | Dougherty | 2.6% | 1.6%(+1.04)#81 | 1.9%(+0.740)#4,974 |
| 82. | Oakhurst | 2.6% | 1.6%(+1.01)#82 | 1.9%(+0.712)#5,055 |
| 83. | Tipton | 2.6% | 1.6%(+1.00)#83 | 1.9%(+0.701)#5,079 |
| 84. | Piedmont | 2.6% | 1.6%(+0.986)#84 | 1.9%(+0.687)#5,131 |
| 85. | Savanna | 2.6% | 1.6%(+0.983)#85 | 1.9%(+0.683)#5,138 |
| 86. | Wewoka | 2.6% | 1.6%(+0.972)#86 | 1.9%(+0.672)#5,167 |
| 87. | Sequoyah | 2.6% | 1.6%(+0.964)#87 | 1.9%(+0.665)#5,190 |
| 88. | Limestone | 2.5% | 1.6%(+0.948)#88 | 1.9%(+0.649)#5,236 |
| 89. | Woodward | 2.5% | 1.6%(+0.917)#89 | 1.9%(+0.618)#5,309 |
| 90. | Inola | 2.5% | 1.6%(+0.902)#90 | 1.9%(+0.602)#5,353 |
| 91. | Sunray | 2.4% | 1.6%(+0.814)#91 | 1.9%(+0.515)#5,621 |
| 92. | Shady Grove Cdp Cherokee County | 2.4% | 1.6%(+0.800)#92 | 1.9%(+0.501)#5,666 |
| 93. | Goldsby | 2.3% | 1.6%(+0.735)#93 | 1.9%(+0.436)#5,876 |
| 94. | Healdton | 2.3% | 1.6%(+0.731)#94 | 1.9%(+0.431)#5,897 |
| 95. | Midwest City | 2.3% | 1.6%(+0.705)#95 | 1.9%(+0.405)#5,969 |
| 96. | Fletcher | 2.3% | 1.6%(+0.699)#96 | 1.9%(+0.400)#5,986 |
| 97. | Bray | 2.2% | 1.6%(+0.652)#97 | 1.9%(+0.353)#6,166 |
| 98. | Bixby | 2.2% | 1.6%(+0.638)#98 | 1.9%(+0.339)#6,210 |
| 99. | Soper | 2.2% | 1.6%(+0.630)#99 | 1.9%(+0.331)#6,240 |
| 100. | Alva | 2.2% | 1.6%(+0.610)#100 | 1.9%(+0.310)#6,304 |
Common Questions
What are the Top 10 Cities with the Highest Percentage of Population Employed in Real Estate, Rental & Leasing in Oklahoma?
Top 10 Cities with the Highest Percentage of Population Employed in Real Estate, Rental & Leasing in Oklahoma are:
What city has the Highest Percentage of Population Employed in Real Estate, Rental & Leasing in Oklahoma?
Albion has the Highest Percentage of Population Employed in Real Estate, Rental & Leasing in Oklahoma with 28.6%.
What is the Percentage of Population Employed in Real Estate, Rental & Leasing in the State of Oklahoma?
Percentage of Population Employed in Real Estate, Rental & Leasing in Oklahoma is 1.6%.
What is the Percentage of Population Employed in Real Estate, Rental & Leasing in the United States?
Percentage of Population Employed in Real Estate, Rental & Leasing in the United States is 1.9%.