Cities with the Highest Percentage of Population Employed in Real Estate, Rental & Leasing in Virginia
RELATED REPORTS & OPTIONS
Real Estate, Rental & Leasing
Virginia
Compare Cities
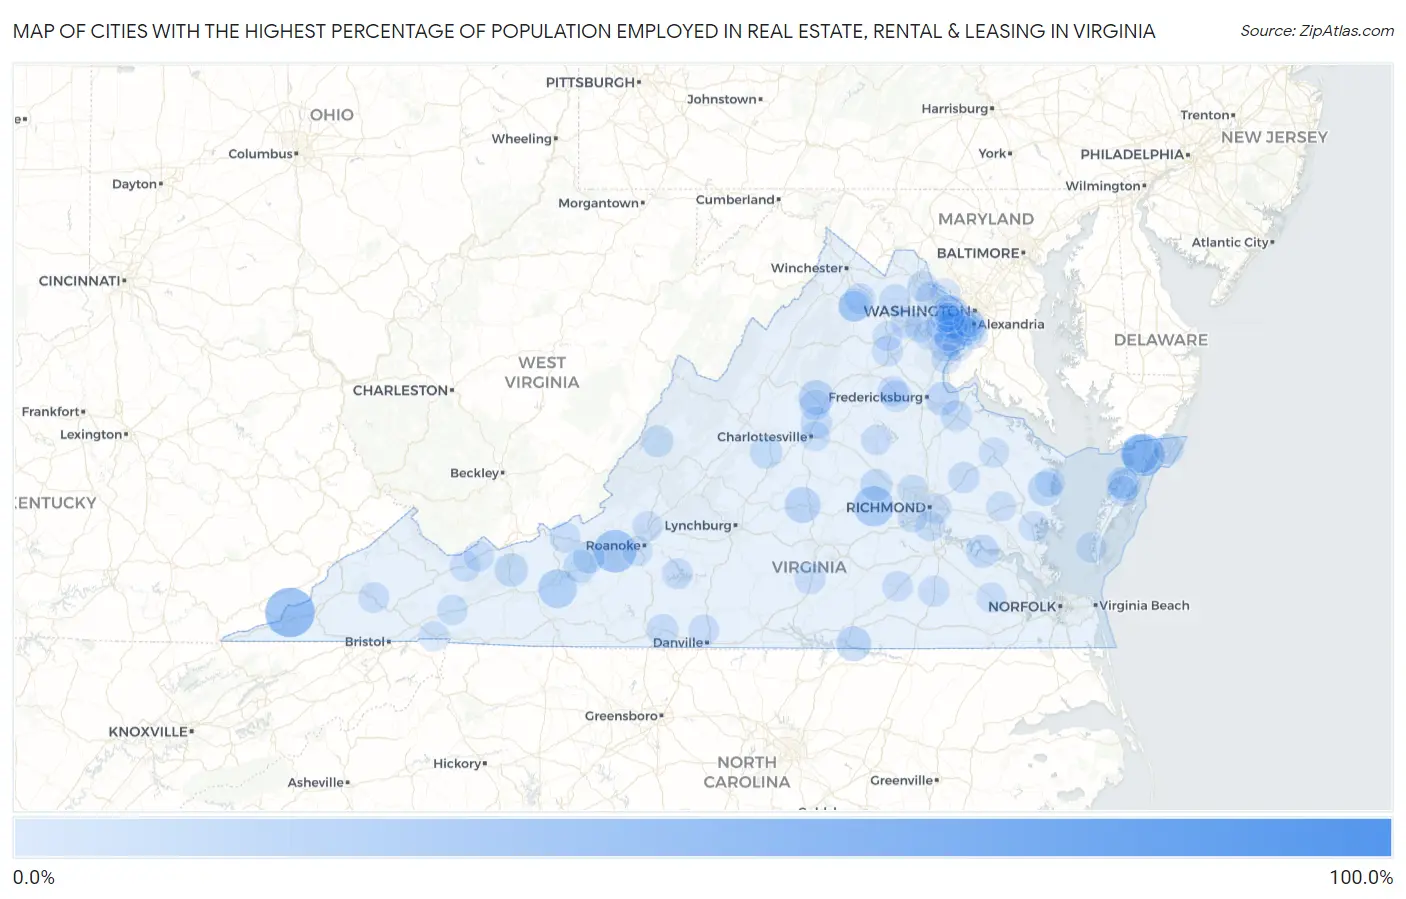
Map of Cities with the Highest Percentage of Population Employed in Real Estate, Rental & Leasing in Virginia
0.0%
100.0%
Cities with the Highest Percentage of Population Employed in Real Estate, Rental & Leasing in Virginia
| City | % Employed | vs State | vs National | |
| 1. | Stonega | 100.0% | 1.9%(+98.1)#1 | 1.9%(+98.1)#2 |
| 2. | Waterford | 56.0% | 1.9%(+54.1)#2 | 1.9%(+54.1)#16 |
| 3. | Locust Mount | 43.3% | 1.9%(+41.4)#3 | 1.9%(+41.4)#31 |
| 4. | St Charles | 42.9% | 1.9%(+41.0)#4 | 1.9%(+41.0)#33 |
| 5. | Lafayette | 28.9% | 1.9%(+27.1)#5 | 1.9%(+27.1)#72 |
| 6. | Temperanceville | 28.0% | 1.9%(+26.1)#6 | 1.9%(+26.1)#78 |
| 7. | Powhatan | 23.4% | 1.9%(+21.6)#7 | 1.9%(+21.5)#115 |
| 8. | Eggleston | 22.5% | 1.9%(+20.6)#8 | 1.9%(+20.6)#126 |
| 9. | Makemie Park | 20.7% | 1.9%(+18.8)#9 | 1.9%(+18.8)#145 |
| 10. | Linville | 20.5% | 1.9%(+18.6)#10 | 1.9%(+18.6)#148 |
| 11. | Rio | 20.4% | 1.9%(+18.5)#11 | 1.9%(+18.5)#151 |
| 12. | Hiwassee | 20.0% | 1.9%(+18.1)#12 | 1.9%(+18.1)#153 |
| 13. | Afton | 18.9% | 1.9%(+17.0)#13 | 1.9%(+17.0)#162 |
| 14. | Glen Wilton | 15.9% | 1.9%(+14.1)#14 | 1.9%(+14.0)#221 |
| 15. | Buckingham Courthouse | 14.8% | 1.9%(+12.9)#15 | 1.9%(+12.9)#256 |
| 16. | Bracey | 12.7% | 1.9%(+10.8)#16 | 1.9%(+10.8)#334 |
| 17. | Stanardsville | 12.7% | 1.9%(+10.8)#17 | 1.9%(+10.8)#335 |
| 18. | Irvington | 11.2% | 1.9%(+9.30)#18 | 1.9%(+9.26)#432 |
| 19. | Passapatanzy | 10.4% | 1.9%(+8.51)#19 | 1.9%(+8.48)#494 |
| 20. | Bland | 9.8% | 1.9%(+7.93)#20 | 1.9%(+7.89)#561 |
| 21. | Claremont | 9.3% | 1.9%(+7.48)#21 | 1.9%(+7.45)#602 |
| 22. | Plum Creek | 9.1% | 1.9%(+7.22)#22 | 1.9%(+7.18)#645 |
| 23. | Skyland Estates | 8.7% | 1.9%(+6.81)#23 | 1.9%(+6.78)#696 |
| 24. | Nellysford | 7.6% | 1.9%(+5.71)#24 | 1.9%(+5.68)#911 |
| 25. | Onley | 7.6% | 1.9%(+5.70)#25 | 1.9%(+5.67)#914 |
| 26. | Merrimac | 7.1% | 1.9%(+5.22)#26 | 1.9%(+5.18)#1,026 |
| 27. | Goochland | 6.9% | 1.9%(+5.05)#27 | 1.9%(+5.01)#1,067 |
| 28. | Chatmoss | 6.8% | 1.9%(+4.97)#28 | 1.9%(+4.94)#1,093 |
| 29. | Onancock | 6.6% | 1.9%(+4.71)#29 | 1.9%(+4.67)#1,162 |
| 30. | Hot Springs | 6.3% | 1.9%(+4.49)#30 | 1.9%(+4.46)#1,234 |
| 31. | Moneta | 6.2% | 1.9%(+4.39)#31 | 1.9%(+4.36)#1,273 |
| 32. | Middleburg | 6.2% | 1.9%(+4.31)#32 | 1.9%(+4.28)#1,310 |
| 33. | Oak Grove | 5.8% | 1.9%(+3.98)#33 | 1.9%(+3.95)#1,440 |
| 34. | Disputanta | 5.8% | 1.9%(+3.95)#34 | 1.9%(+3.92)#1,456 |
| 35. | Port Royal | 5.7% | 1.9%(+3.89)#35 | 1.9%(+3.86)#1,481 |
| 36. | Lake Wilderness | 5.6% | 1.9%(+3.77)#36 | 1.9%(+3.74)#1,531 |
| 37. | Hollymead | 5.6% | 1.9%(+3.76)#37 | 1.9%(+3.73)#1,540 |
| 38. | Central Garage | 5.6% | 1.9%(+3.72)#38 | 1.9%(+3.68)#1,558 |
| 39. | Stony Creek | 5.2% | 1.9%(+3.36)#39 | 1.9%(+3.33)#1,737 |
| 40. | Groveton | 5.2% | 1.9%(+3.30)#40 | 1.9%(+3.26)#1,776 |
| 41. | Shenandoah Farms | 4.9% | 1.9%(+3.01)#41 | 1.9%(+2.98)#1,945 |
| 42. | Sully Square | 4.8% | 1.9%(+2.99)#42 | 1.9%(+2.96)#1,963 |
| 43. | Keysville | 4.7% | 1.9%(+2.89)#43 | 1.9%(+2.86)#2,025 |
| 44. | Pembroke | 4.7% | 1.9%(+2.82)#44 | 1.9%(+2.78)#2,075 |
| 45. | North Shore | 4.6% | 1.9%(+2.79)#45 | 1.9%(+2.75)#2,108 |
| 46. | Tazewell | 4.6% | 1.9%(+2.71)#46 | 1.9%(+2.68)#2,156 |
| 47. | Mount Hermon | 4.5% | 1.9%(+2.62)#47 | 1.9%(+2.59)#2,223 |
| 48. | Fairfax Station | 4.5% | 1.9%(+2.62)#48 | 1.9%(+2.58)#2,229 |
| 49. | Haymarket | 4.3% | 1.9%(+2.49)#49 | 1.9%(+2.46)#2,328 |
| 50. | Fort Hunt | 4.3% | 1.9%(+2.47)#50 | 1.9%(+2.43)#2,349 |
| 51. | Chincoteague | 4.3% | 1.9%(+2.46)#51 | 1.9%(+2.43)#2,352 |
| 52. | Twin Lakes | 4.3% | 1.9%(+2.43)#52 | 1.9%(+2.40)#2,371 |
| 53. | Montrose | 4.2% | 1.9%(+2.34)#53 | 1.9%(+2.30)#2,448 |
| 54. | Opal | 4.2% | 1.9%(+2.29)#54 | 1.9%(+2.26)#2,494 |
| 55. | St Paul | 4.1% | 1.9%(+2.27)#55 | 1.9%(+2.24)#2,518 |
| 56. | Apple Mountain Lake | 4.1% | 1.9%(+2.25)#56 | 1.9%(+2.22)#2,536 |
| 57. | Woodlawn Cdp Fairfax County | 4.0% | 1.9%(+2.15)#57 | 1.9%(+2.12)#2,647 |
| 58. | North Springfield | 4.0% | 1.9%(+2.12)#58 | 1.9%(+2.09)#2,679 |
| 59. | Innsbrook | 3.9% | 1.9%(+2.08)#59 | 1.9%(+2.05)#2,725 |
| 60. | Long Branch | 3.9% | 1.9%(+2.05)#60 | 1.9%(+2.02)#2,755 |
| 61. | Belmont | 3.9% | 1.9%(+2.02)#61 | 1.9%(+1.98)#2,804 |
| 62. | Dunn Loring | 3.8% | 1.9%(+1.94)#62 | 1.9%(+1.90)#2,891 |
| 63. | Melfa | 3.8% | 1.9%(+1.93)#63 | 1.9%(+1.89)#2,904 |
| 64. | Springville | 3.7% | 1.9%(+1.87)#64 | 1.9%(+1.83)#2,977 |
| 65. | Seven Mile Ford | 3.7% | 1.9%(+1.86)#65 | 1.9%(+1.83)#2,984 |
| 66. | Goose Creek | 3.7% | 1.9%(+1.85)#66 | 1.9%(+1.81)#3,005 |
| 67. | Great Falls | 3.7% | 1.9%(+1.84)#67 | 1.9%(+1.81)#3,022 |
| 68. | Lake Of The Woods | 3.7% | 1.9%(+1.82)#68 | 1.9%(+1.78)#3,048 |
| 69. | Daleville | 3.7% | 1.9%(+1.81)#69 | 1.9%(+1.78)#3,053 |
| 70. | Mineral | 3.7% | 1.9%(+1.80)#70 | 1.9%(+1.77)#3,069 |
| 71. | Potomac Mills | 3.6% | 1.9%(+1.79)#71 | 1.9%(+1.75)#3,092 |
| 72. | Occoquan | 3.6% | 1.9%(+1.78)#72 | 1.9%(+1.74)#3,105 |
| 73. | Mckenney | 3.6% | 1.9%(+1.77)#73 | 1.9%(+1.74)#3,120 |
| 74. | West Springfield | 3.6% | 1.9%(+1.75)#74 | 1.9%(+1.71)#3,151 |
| 75. | Cape Charles | 3.5% | 1.9%(+1.67)#75 | 1.9%(+1.63)#3,260 |
| 76. | Tappahannock | 3.5% | 1.9%(+1.63)#76 | 1.9%(+1.60)#3,303 |
| 77. | Kings Park | 3.4% | 1.9%(+1.59)#77 | 1.9%(+1.55)#3,368 |
| 78. | West Point | 3.4% | 1.9%(+1.50)#78 | 1.9%(+1.47)#3,475 |
| 79. | Bellwood | 3.3% | 1.9%(+1.47)#79 | 1.9%(+1.44)#3,535 |
| 80. | Gloucester Courthouse | 3.3% | 1.9%(+1.42)#80 | 1.9%(+1.38)#3,626 |
| 81. | Huntington | 3.3% | 1.9%(+1.41)#81 | 1.9%(+1.37)#3,641 |
| 82. | Ivor | 3.2% | 1.9%(+1.37)#82 | 1.9%(+1.33)#3,724 |
| 83. | Hayfield | 3.2% | 1.9%(+1.33)#83 | 1.9%(+1.29)#3,794 |
| 84. | Mason Neck | 3.2% | 1.9%(+1.31)#84 | 1.9%(+1.27)#3,822 |
| 85. | Buckhall | 3.2% | 1.9%(+1.30)#85 | 1.9%(+1.26)#3,844 |
| 86. | Damascus | 3.1% | 1.9%(+1.28)#86 | 1.9%(+1.24)#3,876 |
| 87. | Cherry Hill | 3.1% | 1.9%(+1.27)#87 | 1.9%(+1.23)#3,891 |
| 88. | Fairfax | 3.1% | 1.9%(+1.26)#88 | 1.9%(+1.23)#3,904 |
| 89. | Vienna | 3.1% | 1.9%(+1.26)#89 | 1.9%(+1.22)#3,911 |
| 90. | Bull Run | 3.1% | 1.9%(+1.23)#90 | 1.9%(+1.19)#3,956 |
| 91. | Union Mill | 3.1% | 1.9%(+1.20)#91 | 1.9%(+1.17)#4,007 |
| 92. | Crosspointe | 3.0% | 1.9%(+1.17)#92 | 1.9%(+1.14)#4,067 |
| 93. | Mantua | 3.0% | 1.9%(+1.16)#93 | 1.9%(+1.13)#4,085 |
| 94. | Difficult Run | 2.9% | 1.9%(+1.07)#94 | 1.9%(+1.03)#4,276 |
| 95. | Alexandria | 2.9% | 1.9%(+1.05)#95 | 1.9%(+1.02)#4,297 |
| 96. | Cave Spring | 2.9% | 1.9%(+1.05)#96 | 1.9%(+1.01)#4,309 |
| 97. | Kilmarnock | 2.9% | 1.9%(+1.01)#97 | 1.9%(+0.972)#4,398 |
| 98. | Pantops | 2.8% | 1.9%(+0.969)#98 | 1.9%(+0.935)#4,482 |
| 99. | Warrenton | 2.8% | 1.9%(+0.950)#99 | 1.9%(+0.915)#4,536 |
| 100. | Rockwood | 2.8% | 1.9%(+0.941)#100 | 1.9%(+0.907)#4,551 |
Common Questions
What are the Top 10 Cities with the Highest Percentage of Population Employed in Real Estate, Rental & Leasing in Virginia?
Top 10 Cities with the Highest Percentage of Population Employed in Real Estate, Rental & Leasing in Virginia are:
#1
42.9%
#2
28.9%
#3
28.0%
#4
23.4%
#5
20.7%
#6
20.0%
#7
14.8%
#8
12.7%
#9
12.7%
#10
11.2%
What city has the Highest Percentage of Population Employed in Real Estate, Rental & Leasing in Virginia?
St Charles has the Highest Percentage of Population Employed in Real Estate, Rental & Leasing in Virginia with 42.9%.
What is the Percentage of Population Employed in Real Estate, Rental & Leasing in the State of Virginia?
Percentage of Population Employed in Real Estate, Rental & Leasing in Virginia is 1.9%.
What is the Percentage of Population Employed in Real Estate, Rental & Leasing in the United States?
Percentage of Population Employed in Real Estate, Rental & Leasing in the United States is 1.9%.