Zip Codes with the Highest Percentage of Population Employed in Real Estate, Rental & Leasing in San Jose, CA
RELATED REPORTS & OPTIONS
Real Estate, Rental & Leasing
San Jose
Compare Zip Codes
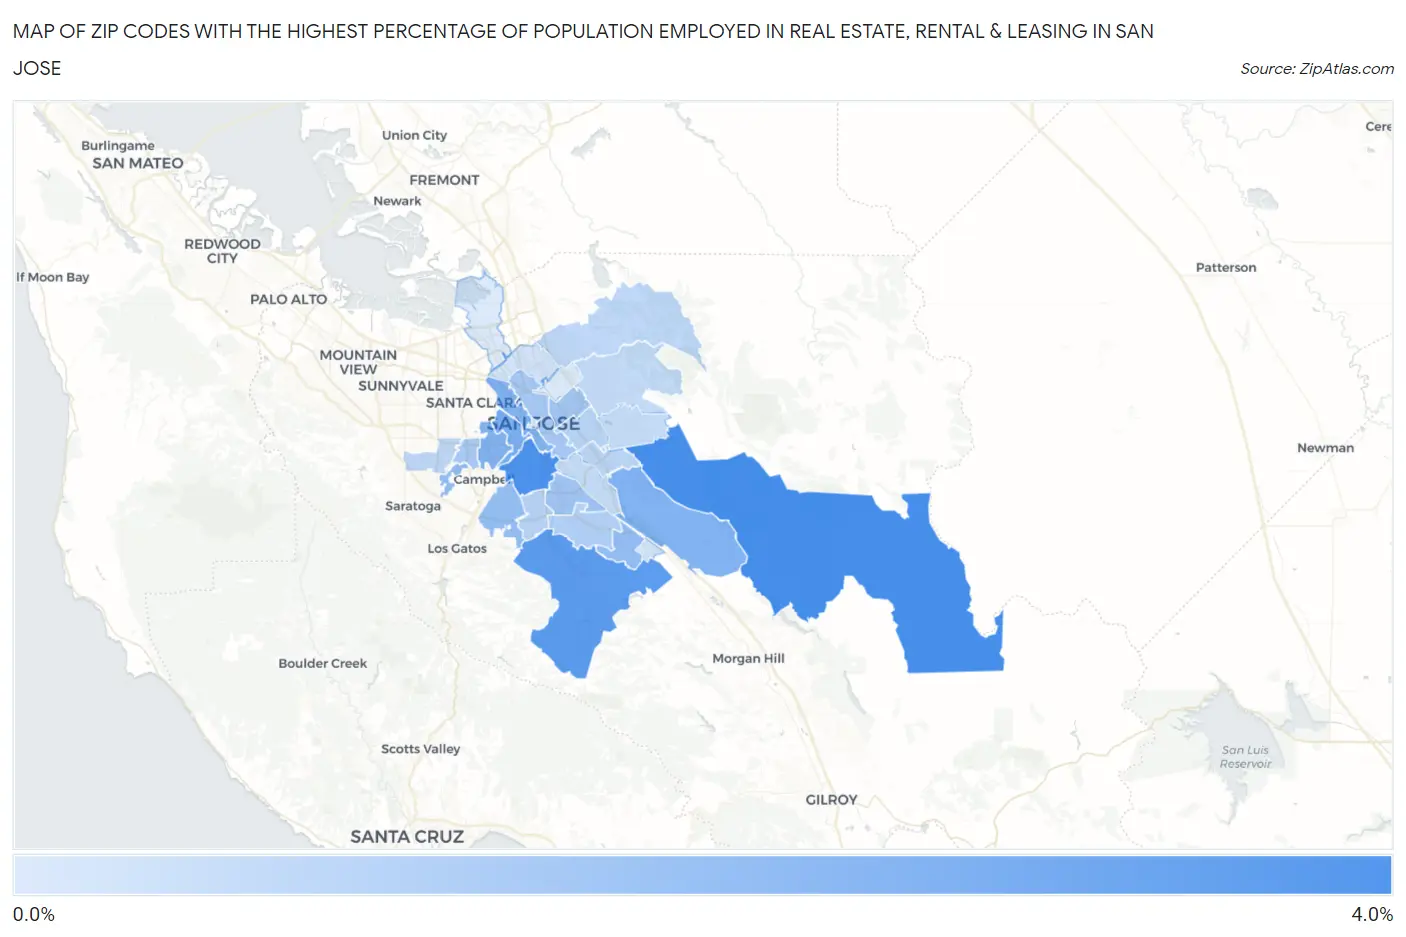
Map of Zip Codes with the Highest Percentage of Population Employed in Real Estate, Rental & Leasing in San Jose
0.59%
3.5%
Zip Codes with the Highest Percentage of Population Employed in Real Estate, Rental & Leasing in San Jose, CA
| Zip Code | % Employed | vs State | vs National | |
| 1. | 95135 | 3.5% | 2.1%(+1.43)#253 | 1.9%(+1.65)#2,765 |
| 2. | 95125 | 3.5% | 2.1%(+1.33)#275 | 1.9%(+1.56)#2,931 |
| 3. | 95120 | 3.2% | 2.1%(+1.05)#326 | 1.9%(+1.28)#3,485 |
| 4. | 95126 | 2.5% | 2.1%(+0.362)#509 | 1.9%(+0.589)#5,556 |
| 5. | 95138 | 2.4% | 2.1%(+0.268)#546 | 1.9%(+0.495)#5,953 |
| 6. | 95128 | 2.3% | 2.1%(+0.227)#554 | 1.9%(+0.454)#6,117 |
| 7. | 95110 | 2.3% | 2.1%(+0.216)#560 | 1.9%(+0.444)#6,155 |
| 8. | 95119 | 2.0% | 2.1%(-0.096)#692 | 1.9%(+0.131)#7,721 |
| 9. | 95130 | 2.0% | 2.1%(-0.099)#694 | 1.9%(+0.129)#7,734 |
| 10. | 95124 | 2.0% | 2.1%(-0.142)#710 | 1.9%(+0.086)#7,969 |
| 11. | 95136 | 1.8% | 2.1%(-0.348)#810 | 1.9%(-0.121)#9,306 |
| 12. | 95116 | 1.7% | 2.1%(-0.389)#833 | 1.9%(-0.162)#9,551 |
| 13. | 95112 | 1.7% | 2.1%(-0.460)#875 | 1.9%(-0.233)#10,053 |
| 14. | 95117 | 1.6% | 2.1%(-0.561)#921 | 1.9%(-0.333)#10,730 |
| 15. | 95123 | 1.4% | 2.1%(-0.726)#992 | 1.9%(-0.499)#12,034 |
| 16. | 95118 | 1.3% | 2.1%(-0.794)#1,024 | 1.9%(-0.566)#12,533 |
| 17. | 95122 | 1.2% | 2.1%(-0.871)#1,070 | 1.9%(-0.644)#13,101 |
| 18. | 95121 | 1.2% | 2.1%(-0.908)#1,084 | 1.9%(-0.680)#13,400 |
| 19. | 95132 | 1.2% | 2.1%(-0.938)#1,099 | 1.9%(-0.711)#13,640 |
| 20. | 95129 | 1.2% | 2.1%(-0.961)#1,111 | 1.9%(-0.734)#13,827 |
| 21. | 95127 | 1.1% | 2.1%(-1.05)#1,137 | 1.9%(-0.822)#14,539 |
| 22. | 95148 | 1.1% | 2.1%(-1.06)#1,144 | 1.9%(-0.836)#14,669 |
| 23. | 95111 | 1.0% | 2.1%(-1.08)#1,150 | 1.9%(-0.853)#14,818 |
| 24. | 95131 | 0.83% | 2.1%(-1.29)#1,222 | 1.9%(-1.06)#16,464 |
| 25. | 95139 | 0.79% | 2.1%(-1.33)#1,236 | 1.9%(-1.10)#16,784 |
| 26. | 95113 | 0.72% | 2.1%(-1.40)#1,255 | 1.9%(-1.18)#17,361 |
| 27. | 95133 | 0.60% | 2.1%(-1.52)#1,287 | 1.9%(-1.29)#18,303 |
| 28. | 95134 | 0.59% | 2.1%(-1.53)#1,289 | 1.9%(-1.30)#18,366 |
1
Common Questions
What are the Top 10 Zip Codes with the Highest Percentage of Population Employed in Real Estate, Rental & Leasing in San Jose, CA?
Top 10 Zip Codes with the Highest Percentage of Population Employed in Real Estate, Rental & Leasing in San Jose, CA are:
What zip code has the Highest Percentage of Population Employed in Real Estate, Rental & Leasing in San Jose, CA?
95135 has the Highest Percentage of Population Employed in Real Estate, Rental & Leasing in San Jose, CA with 3.5%.
What is the Percentage of Population Employed in Real Estate, Rental & Leasing in San Jose, CA?
Percentage of Population Employed in Real Estate, Rental & Leasing in San Jose is 1.6%.
What is the Percentage of Population Employed in Real Estate, Rental & Leasing in California?
Percentage of Population Employed in Real Estate, Rental & Leasing in California is 2.1%.
What is the Percentage of Population Employed in Real Estate, Rental & Leasing in the United States?
Percentage of Population Employed in Real Estate, Rental & Leasing in the United States is 1.9%.