Sunnyside Tahoe City, CA Map & Demographics
Sunnyside Tahoe City Map
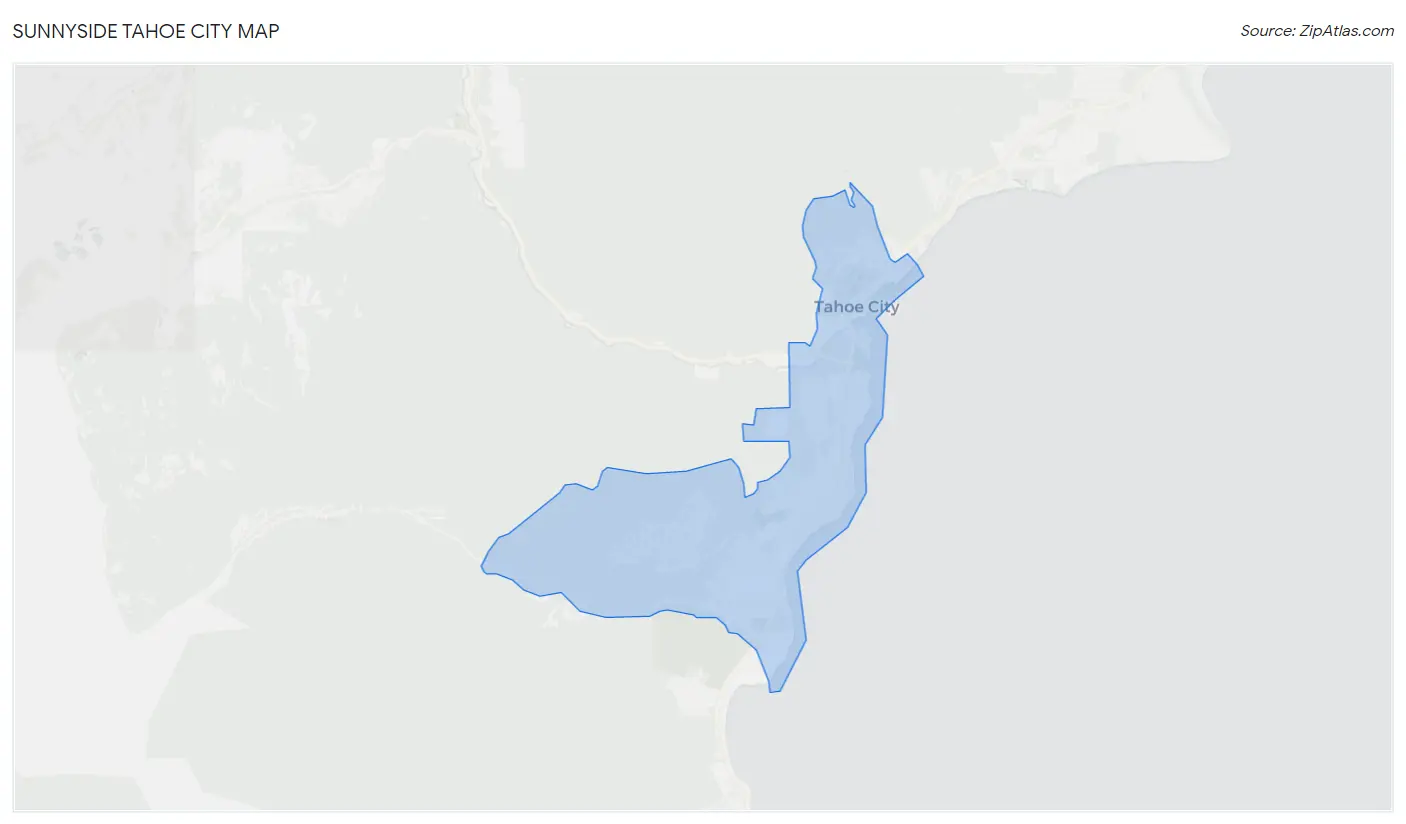
Sunnyside Tahoe City Overview
$74,389
PER CAPITA INCOME
$158,750
AVG FAMILY INCOME
$125,144
AVG HOUSEHOLD INCOME
0.45
INEQUALITY / GINI INDEX
1,536
TOTAL POPULATION
760
MALE POPULATION
776
FEMALE POPULATION
97.94
MALES / 100 FEMALES
102.11
FEMALES / 100 MALES
38.6
MEDIAN AGE
3.2
AVG FAMILY SIZE
2.4
AVG HOUSEHOLD SIZE
833
LABOR FORCE [ PEOPLE ]
68.8%
PERCENT IN LABOR FORCE
Income in Sunnyside Tahoe City
Income Overview in Sunnyside Tahoe City
Per Capita Income in Sunnyside Tahoe City is $74,389, while median incomes of families and households are $158,750 and $125,144 respectively.
| Characteristic | Number | Measure |
| Per Capita Income | 1,536 | $74,389 |
| Median Family Income | 363 | $158,750 |
| Mean Family Income | 363 | $224,317 |
| Median Household Income | 649 | $125,144 |
| Mean Household Income | 649 | $170,705 |
| Income Deficit | 363 | $0 |
| Wage / Income Gap (%) | 1,536 | 0.00% |
| Wage / Income Gap ($) | 1,536 | 100.00¢ per $1 |
| Gini / Inequality Index | 1,536 | 0.45 |
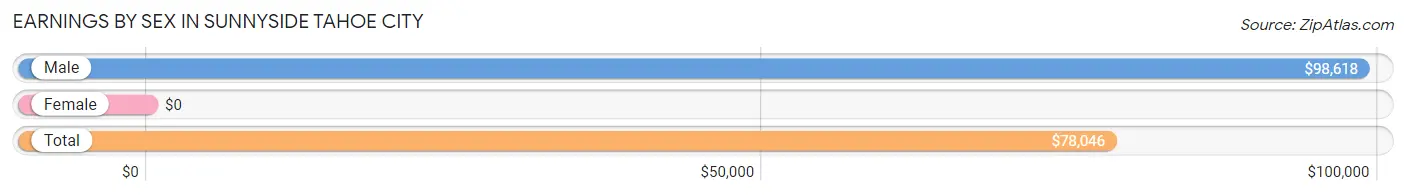
Earnings by Sex in Sunnyside Tahoe City
| Sex | Number | Average Earnings |
| Male | 435 (48.0%) | $98,618 |
| Female | 472 (52.0%) | $0 |
| Total | 907 (100.0%) | $78,046 |
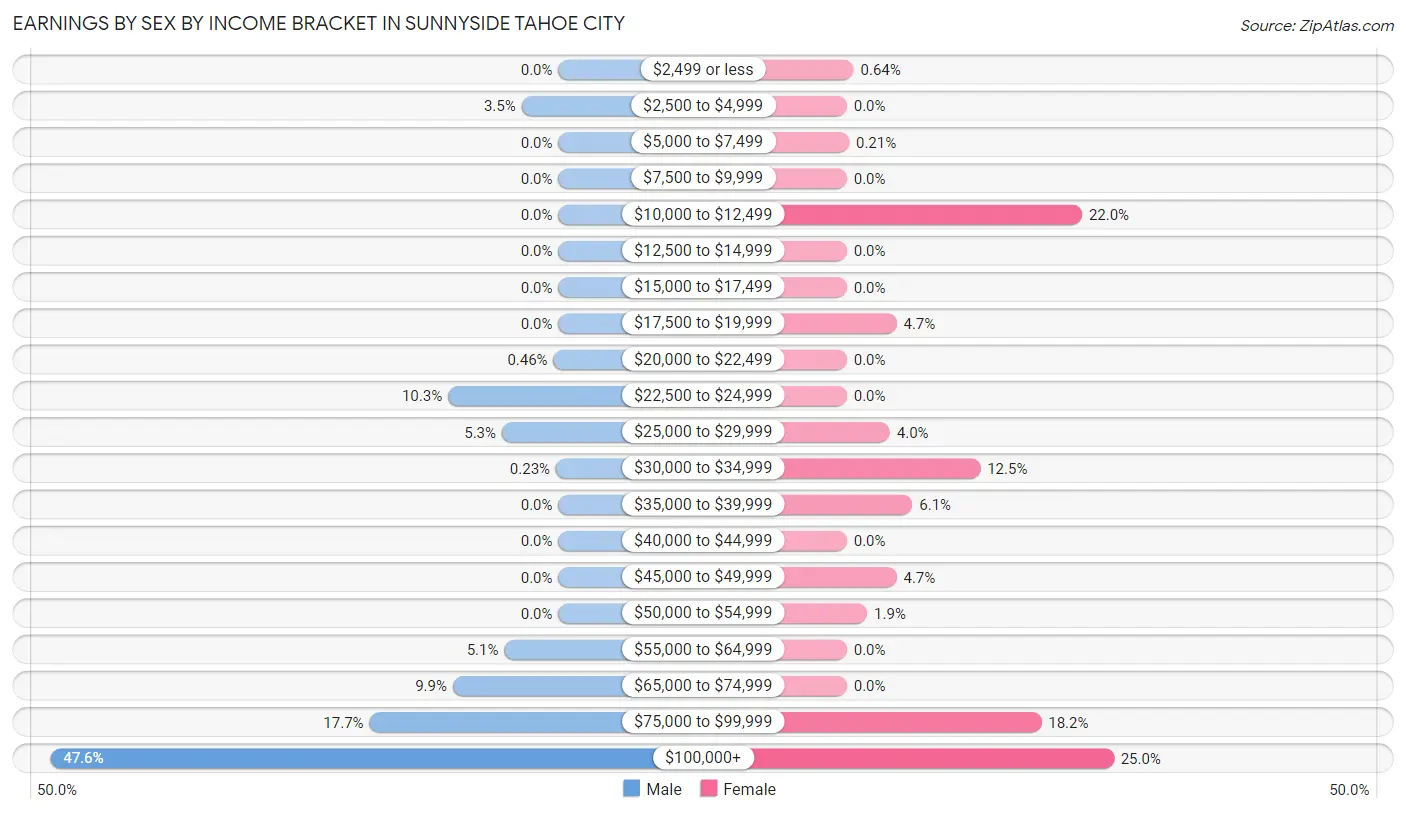
Earnings by Sex by Income Bracket in Sunnyside Tahoe City
The most common earnings brackets in Sunnyside Tahoe City are $100,000+ for men (207 | 47.6%) and $100,000+ for women (118 | 25.0%).
| Income | Male | Female |
| $2,499 or less | 0 (0.0%) | 3 (0.6%) |
| $2,500 to $4,999 | 15 (3.5%) | 0 (0.0%) |
| $5,000 to $7,499 | 0 (0.0%) | 1 (0.2%) |
| $7,500 to $9,999 | 0 (0.0%) | 0 (0.0%) |
| $10,000 to $12,499 | 0 (0.0%) | 104 (22.0%) |
| $12,500 to $14,999 | 0 (0.0%) | 0 (0.0%) |
| $15,000 to $17,499 | 0 (0.0%) | 0 (0.0%) |
| $17,500 to $19,999 | 0 (0.0%) | 22 (4.7%) |
| $20,000 to $22,499 | 2 (0.5%) | 0 (0.0%) |
| $22,500 to $24,999 | 45 (10.3%) | 0 (0.0%) |
| $25,000 to $29,999 | 23 (5.3%) | 19 (4.0%) |
| $30,000 to $34,999 | 1 (0.2%) | 59 (12.5%) |
| $35,000 to $39,999 | 0 (0.0%) | 29 (6.1%) |
| $40,000 to $44,999 | 0 (0.0%) | 0 (0.0%) |
| $45,000 to $49,999 | 0 (0.0%) | 22 (4.7%) |
| $50,000 to $54,999 | 0 (0.0%) | 9 (1.9%) |
| $55,000 to $64,999 | 22 (5.1%) | 0 (0.0%) |
| $65,000 to $74,999 | 43 (9.9%) | 0 (0.0%) |
| $75,000 to $99,999 | 77 (17.7%) | 86 (18.2%) |
| $100,000+ | 207 (47.6%) | 118 (25.0%) |
| Total | 435 (100.0%) | 472 (100.0%) |
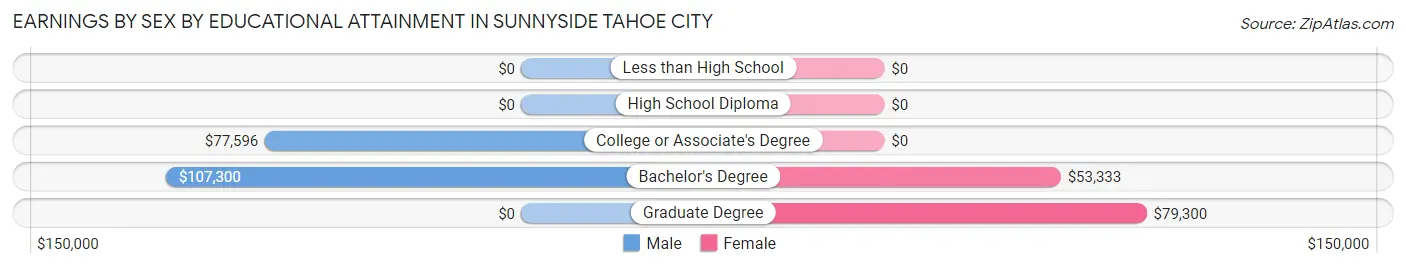
Earnings by Sex by Educational Attainment in Sunnyside Tahoe City
| Educational Attainment | Male Income | Female Income |
| Less than High School | - | - |
| High School Diploma | - | - |
| College or Associate's Degree | $77,596 | $0 |
| Bachelor's Degree | $107,300 | $53,333 |
| Graduate Degree | - | - |
| Total | $99,737 | $0 |
Family Income in Sunnyside Tahoe City
Family Income Brackets in Sunnyside Tahoe City
According to the Sunnyside Tahoe City family income data, there are 130 families falling into the $200,000+ income range, which is the most common income bracket and makes up 35.8% of all families.
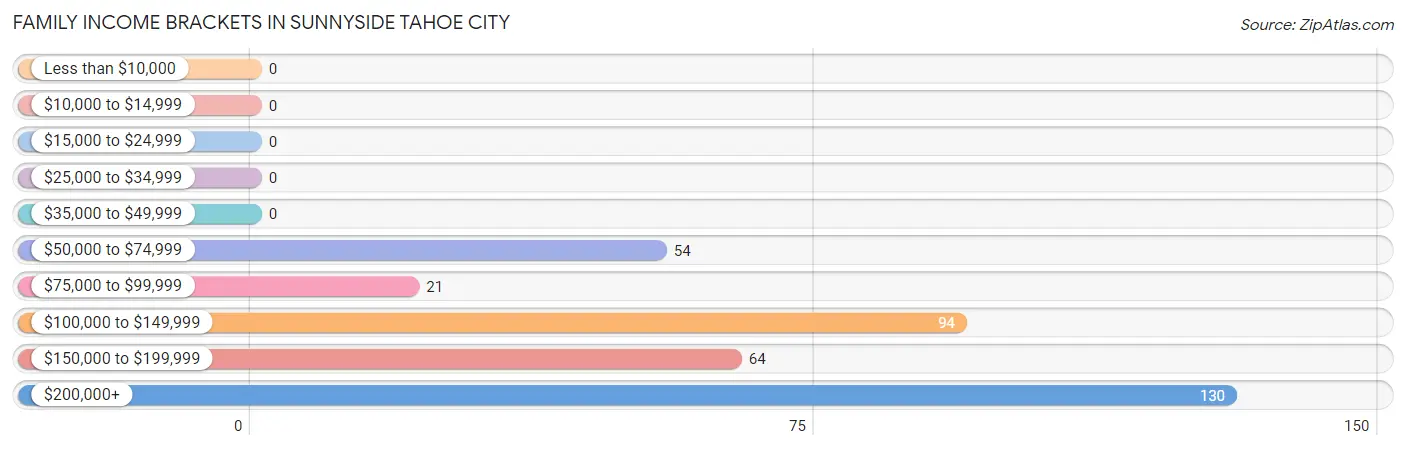
| Income Bracket | # Families | % Families |
| Less than $10,000 | 0 | 0.0% |
| $10,000 to $14,999 | 0 | 0.0% |
| $15,000 to $24,999 | 0 | 0.0% |
| $25,000 to $34,999 | 0 | 0.0% |
| $35,000 to $49,999 | 0 | 0.0% |
| $50,000 to $74,999 | 54 | 14.9% |
| $75,000 to $99,999 | 21 | 5.8% |
| $100,000 to $149,999 | 94 | 25.9% |
| $150,000 to $199,999 | 64 | 17.6% |
| $200,000+ | 130 | 35.8% |
Family Income by Famaliy Size in Sunnyside Tahoe City
4-person families (80 | 22.0%) account for the highest median family income in Sunnyside Tahoe City with $250,001 per family, while 2-person families (157 | 43.2%) have the highest median income of $95,938 per family member.
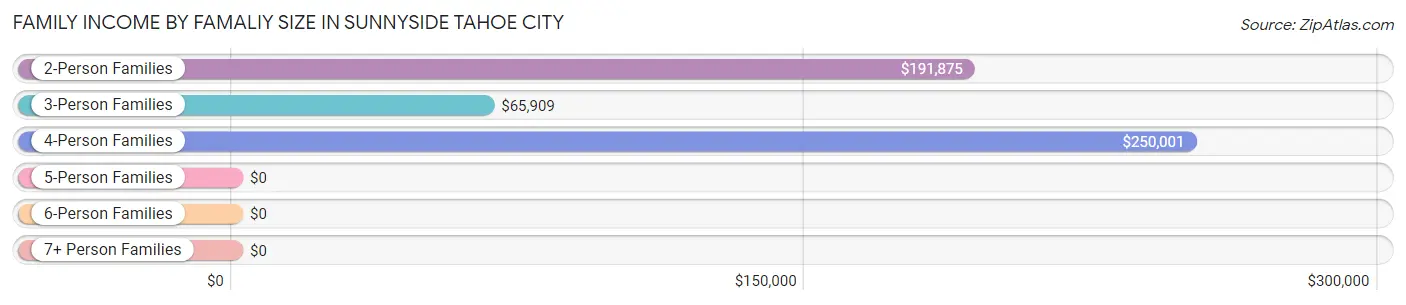
| Income Bracket | # Families | Median Income |
| 2-Person Families | 157 (43.2%) | $191,875 |
| 3-Person Families | 80 (22.0%) | $65,909 |
| 4-Person Families | 80 (22.0%) | $250,001 |
| 5-Person Families | 46 (12.7%) | $0 |
| 6-Person Families | 0 (0.0%) | $0 |
| 7+ Person Families | 0 (0.0%) | $0 |
| Total | 363 (100.0%) | $158,750 |
Family Income by Number of Earners in Sunnyside Tahoe City
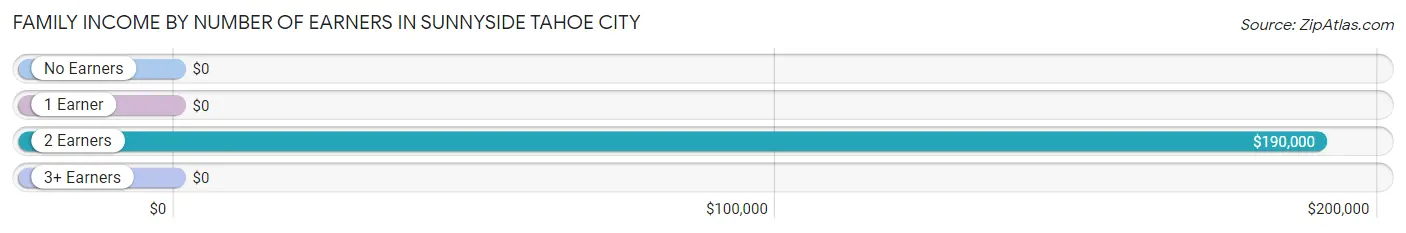
| Number of Earners | # Families | Median Income |
| No Earners | 47 (13.0%) | $0 |
| 1 Earner | 83 (22.9%) | $0 |
| 2 Earners | 208 (57.3%) | $190,000 |
| 3+ Earners | 25 (6.9%) | $0 |
| Total | 363 (100.0%) | $158,750 |
Household Income in Sunnyside Tahoe City
Household Income Brackets in Sunnyside Tahoe City
With 175 households falling in the category, the $200,000+ income range is the most frequent in Sunnyside Tahoe City, accounting for 27.0% of all households.
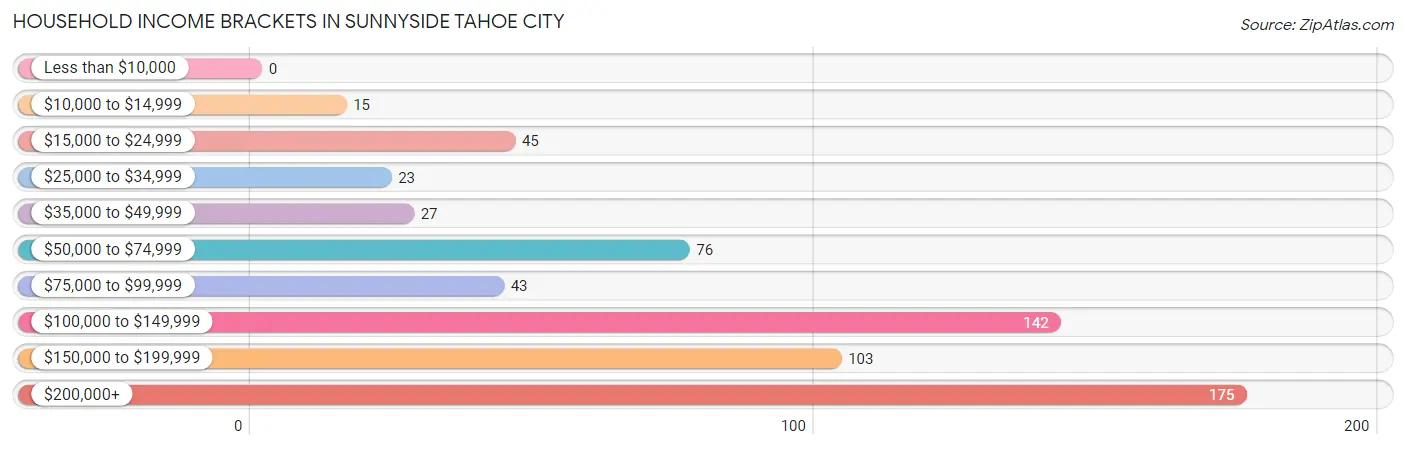
| Income Bracket | # Households | % Households |
| Less than $10,000 | 0 | 0.0% |
| $10,000 to $14,999 | 15 | 2.3% |
| $15,000 to $24,999 | 45 | 6.9% |
| $25,000 to $34,999 | 23 | 3.5% |
| $35,000 to $49,999 | 27 | 4.2% |
| $50,000 to $74,999 | 76 | 11.7% |
| $75,000 to $99,999 | 43 | 6.6% |
| $100,000 to $149,999 | 142 | 21.9% |
| $150,000 to $199,999 | 103 | 15.9% |
| $200,000+ | 175 | 27.0% |
Household Income by Householder Age in Sunnyside Tahoe City
The median household income in Sunnyside Tahoe City is $125,144, with the highest median household income of $137,955 found in the 25 to 44 years age bracket for the primary householder. A total of 358 households (55.2%) fall into this category.
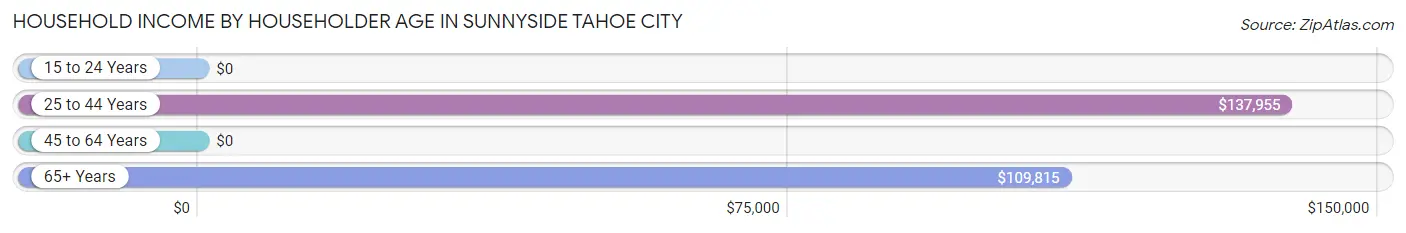
| Income Bracket | # Households | Median Income |
| 15 to 24 Years | 0 (0.0%) | $0 |
| 25 to 44 Years | 358 (55.2%) | $137,955 |
| 45 to 64 Years | 141 (21.7%) | $0 |
| 65+ Years | 150 (23.1%) | $109,815 |
| Total | 649 (100.0%) | $125,144 |
Poverty in Sunnyside Tahoe City
Income Below Poverty by Sex and Age in Sunnyside Tahoe City
With 3.5% poverty level for males and 0.4% for females among the residents of Sunnyside Tahoe City, 75 year old and over males and 18 to 24 year old females are the most vulnerable to poverty, with 15 males (17.6%) and 3 females (60.0%) in their respective age groups living below the poverty level.
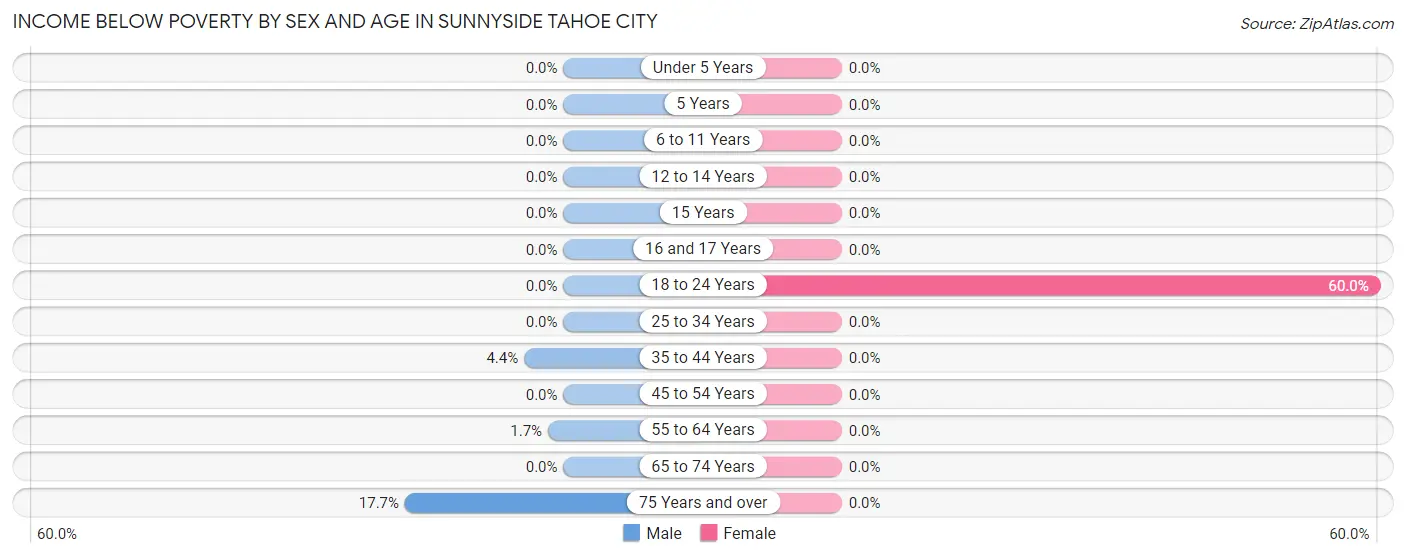
| Age Bracket | Male | Female |
| Under 5 Years | 0 (0.0%) | 0 (0.0%) |
| 5 Years | 0 (0.0%) | 0 (0.0%) |
| 6 to 11 Years | 0 (0.0%) | 0 (0.0%) |
| 12 to 14 Years | 0 (0.0%) | 0 (0.0%) |
| 15 Years | 0 (0.0%) | 0 (0.0%) |
| 16 and 17 Years | 0 (0.0%) | 0 (0.0%) |
| 18 to 24 Years | 0 (0.0%) | 3 (60.0%) |
| 25 to 34 Years | 0 (0.0%) | 0 (0.0%) |
| 35 to 44 Years | 11 (4.4%) | 0 (0.0%) |
| 45 to 54 Years | 0 (0.0%) | 0 (0.0%) |
| 55 to 64 Years | 1 (1.7%) | 0 (0.0%) |
| 65 to 74 Years | 0 (0.0%) | 0 (0.0%) |
| 75 Years and over | 15 (17.6%) | 0 (0.0%) |
| Total | 27 (3.5%) | 3 (0.4%) |
Income Above Poverty by Sex and Age in Sunnyside Tahoe City
According to the poverty statistics in Sunnyside Tahoe City, males aged under 5 years and females aged under 5 years are the age groups that are most secure financially, with 100.0% of males and 100.0% of females in these age groups living above the poverty line.
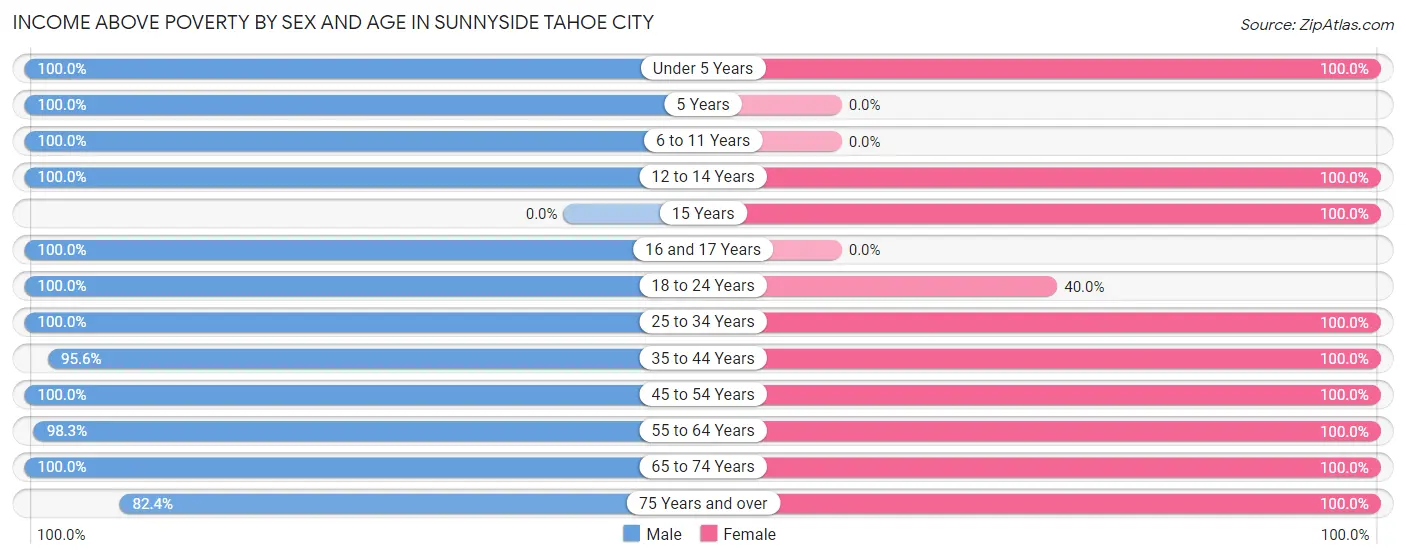
| Age Bracket | Male | Female |
| Under 5 Years | 44 (100.0%) | 129 (100.0%) |
| 5 Years | 18 (100.0%) | 0 (0.0%) |
| 6 to 11 Years | 84 (100.0%) | 0 (0.0%) |
| 12 to 14 Years | 8 (100.0%) | 20 (100.0%) |
| 15 Years | 0 (0.0%) | 22 (100.0%) |
| 16 and 17 Years | 15 (100.0%) | 0 (0.0%) |
| 18 to 24 Years | 2 (100.0%) | 2 (40.0%) |
| 25 to 34 Years | 80 (100.0%) | 191 (100.0%) |
| 35 to 44 Years | 240 (95.6%) | 147 (100.0%) |
| 45 to 54 Years | 48 (100.0%) | 34 (100.0%) |
| 55 to 64 Years | 57 (98.3%) | 131 (100.0%) |
| 65 to 74 Years | 67 (100.0%) | 53 (100.0%) |
| 75 Years and over | 70 (82.4%) | 44 (100.0%) |
| Total | 733 (96.5%) | 773 (99.6%) |
Income Below Poverty Among Married-Couple Families in Sunnyside Tahoe City
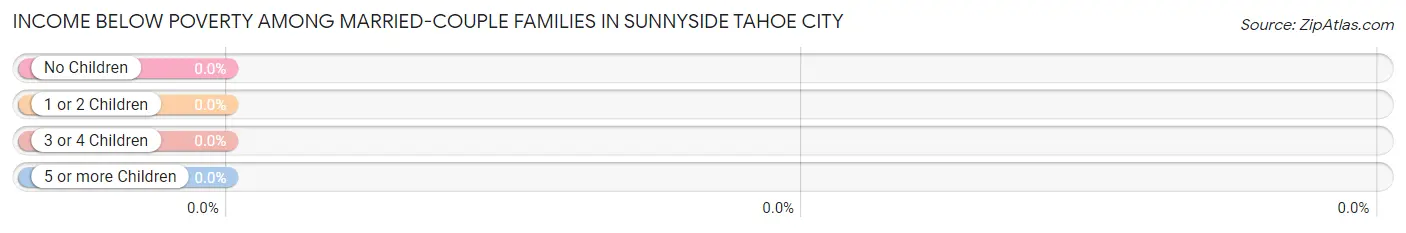
| Children | Above Poverty | Below Poverty |
| No Children | 179 (100.0%) | 0 (0.0%) |
| 1 or 2 Children | 153 (100.0%) | 0 (0.0%) |
| 3 or 4 Children | 21 (100.0%) | 0 (0.0%) |
| 5 or more Children | 0 (0.0%) | 0 (0.0%) |
| Total | 353 (100.0%) | 0 (0.0%) |
Income Below Poverty Among Single-Parent Households in Sunnyside Tahoe City
| Children | Single Father | Single Mother |
| No Children | 0 (0.0%) | 0 (0.0%) |
| 1 or 2 Children | 0 (0.0%) | 0 (0.0%) |
| 3 or 4 Children | 0 (0.0%) | 0 (0.0%) |
| 5 or more Children | 0 (0.0%) | 0 (0.0%) |
| Total | 0 (0.0%) | 0 (0.0%) |
Income Below Poverty Among Married-Couple vs Single-Parent Households in Sunnyside Tahoe City
| Children | Married-Couple Families | Single-Parent Households |
| No Children | 0 (0.0%) | 0 (0.0%) |
| 1 or 2 Children | 0 (0.0%) | 0 (0.0%) |
| 3 or 4 Children | 0 (0.0%) | 0 (0.0%) |
| 5 or more Children | 0 (0.0%) | 0 (0.0%) |
| Total | 0 (0.0%) | 0 (0.0%) |
Race in Sunnyside Tahoe City
The most populous races in Sunnyside Tahoe City are White / Caucasian (1,457 | 94.9%), Hispanic or Latino (53 | 3.5%), and Asian (36 | 2.3%).
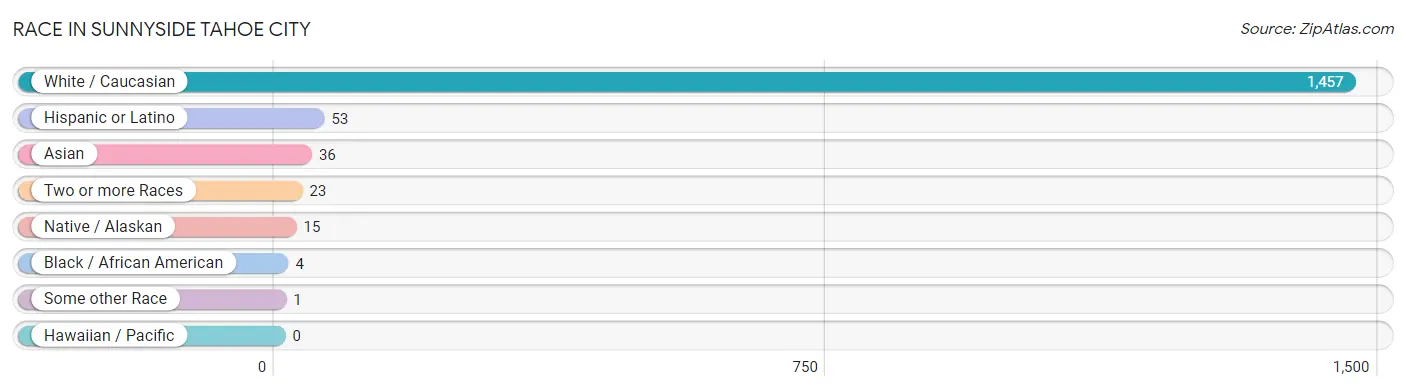
| Race | # Population | % Population |
| Asian | 36 | 2.3% |
| Black / African American | 4 | 0.3% |
| Hawaiian / Pacific | 0 | 0.0% |
| Hispanic or Latino | 53 | 3.5% |
| Native / Alaskan | 15 | 1.0% |
| White / Caucasian | 1,457 | 94.9% |
| Two or more Races | 23 | 1.5% |
| Some other Race | 1 | 0.1% |
| Total | 1,536 | 100.0% |
Ancestry in Sunnyside Tahoe City
The most populous ancestries reported in Sunnyside Tahoe City are Irish (385 | 25.1%), English (319 | 20.8%), German (208 | 13.5%), Lithuanian (122 | 7.9%), and Polish (108 | 7.0%), together accounting for 74.4% of all Sunnyside Tahoe City residents.
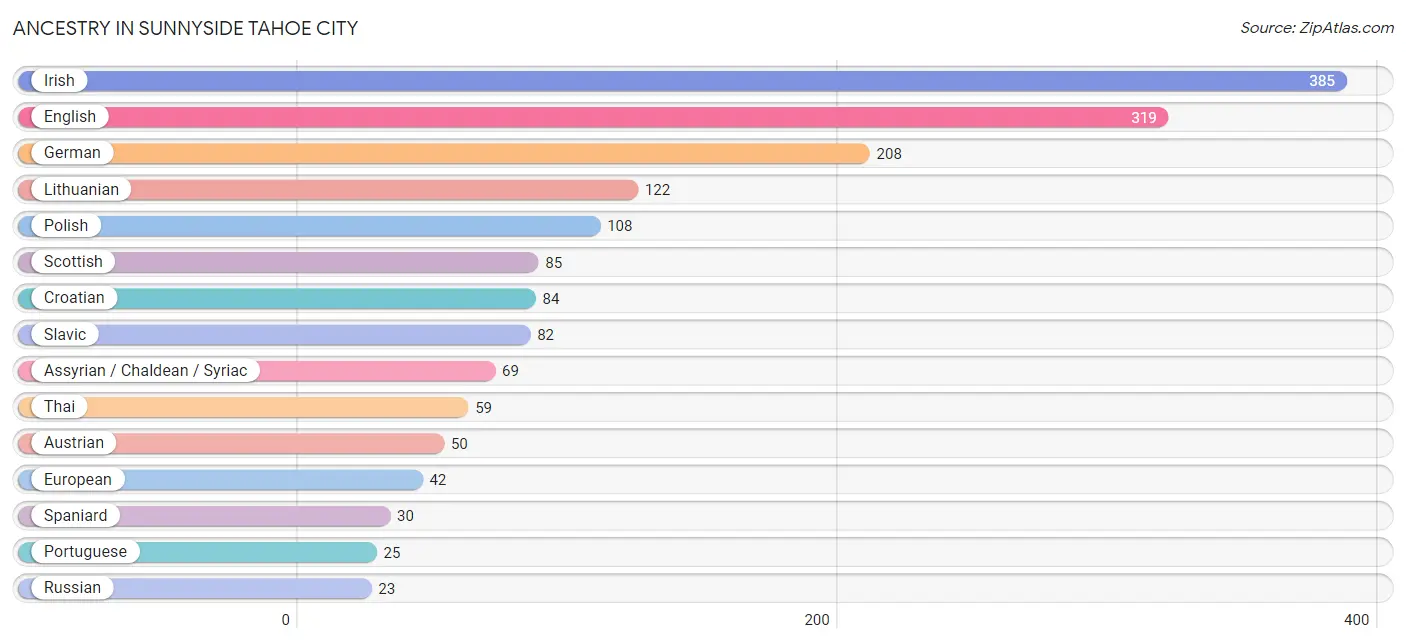
| Ancestry | # Population | % Population |
| American | 21 | 1.4% |
| Assyrian / Chaldean / Syriac | 69 | 4.5% |
| Austrian | 50 | 3.3% |
| British | 20 | 1.3% |
| Croatian | 84 | 5.5% |
| Dutch | 1 | 0.1% |
| English | 319 | 20.8% |
| European | 42 | 2.7% |
| French | 21 | 1.4% |
| German | 208 | 13.5% |
| Irish | 385 | 25.1% |
| Italian | 22 | 1.4% |
| Lithuanian | 122 | 7.9% |
| Mexican | 1 | 0.1% |
| Norwegian | 21 | 1.4% |
| Peruvian | 22 | 1.4% |
| Polish | 108 | 7.0% |
| Portuguese | 25 | 1.6% |
| Russian | 23 | 1.5% |
| Scottish | 85 | 5.5% |
| Slavic | 82 | 5.3% |
| South American | 22 | 1.4% |
| Spaniard | 30 | 1.9% |
| Swedish | 19 | 1.2% |
| Thai | 59 | 3.8% |
| Welsh | 22 | 1.4% | View All 26 Rows |
Immigrants in Sunnyside Tahoe City
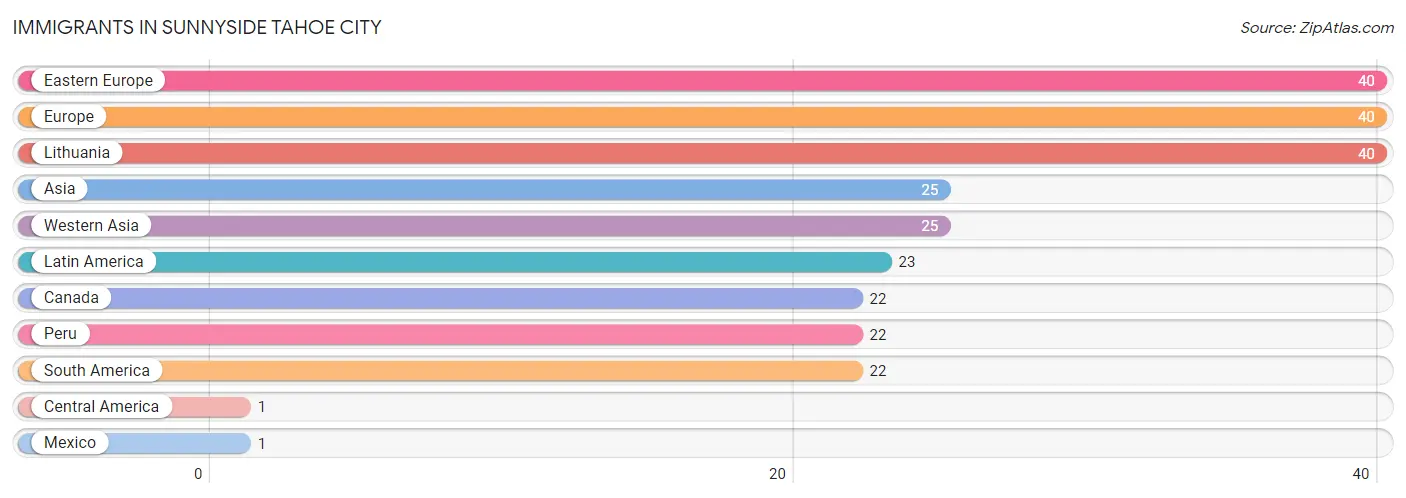
The most numerous immigrant groups reported in Sunnyside Tahoe City came from Eastern Europe (40 | 2.6%), Europe (40 | 2.6%), Lithuania (40 | 2.6%), Asia (25 | 1.6%), and Western Asia (25 | 1.6%), together accounting for 11.1% of all Sunnyside Tahoe City residents.
| Immigration Origin | # Population | % Population |
| Asia | 25 | 1.6% |
| Canada | 22 | 1.4% |
| Central America | 1 | 0.1% |
| Eastern Europe | 40 | 2.6% |
| Europe | 40 | 2.6% |
| Latin America | 23 | 1.5% |
| Lithuania | 40 | 2.6% |
| Mexico | 1 | 0.1% |
| Peru | 22 | 1.4% |
| South America | 22 | 1.4% |
| Western Asia | 25 | 1.6% | View All 11 Rows |
Sex and Age in Sunnyside Tahoe City
Sex and Age in Sunnyside Tahoe City
The most populous age groups in Sunnyside Tahoe City are 40 to 44 Years (156 | 20.5%) for men and 30 to 34 Years (155 | 20.0%) for women.
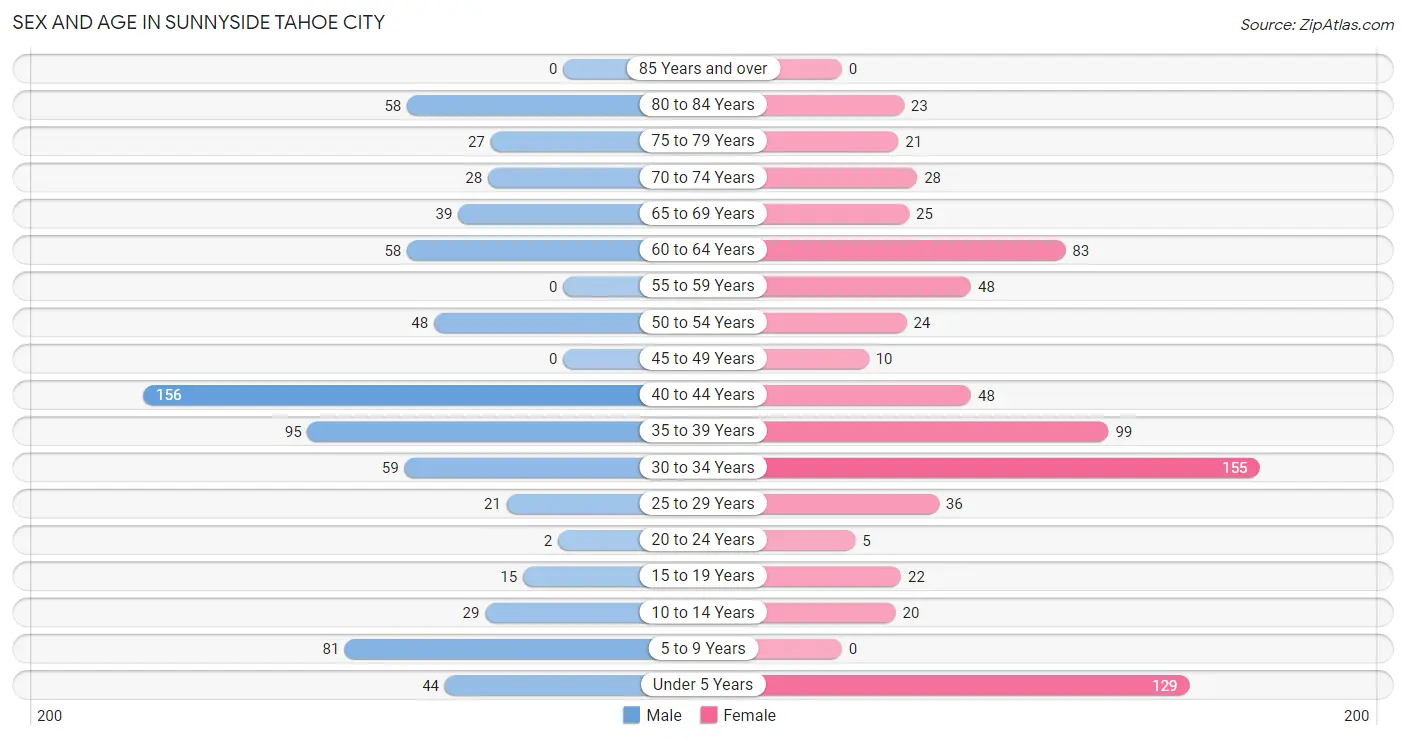
| Age Bracket | Male | Female |
| Under 5 Years | 44 (5.8%) | 129 (16.6%) |
| 5 to 9 Years | 81 (10.7%) | 0 (0.0%) |
| 10 to 14 Years | 29 (3.8%) | 20 (2.6%) |
| 15 to 19 Years | 15 (2.0%) | 22 (2.8%) |
| 20 to 24 Years | 2 (0.3%) | 5 (0.6%) |
| 25 to 29 Years | 21 (2.8%) | 36 (4.6%) |
| 30 to 34 Years | 59 (7.8%) | 155 (20.0%) |
| 35 to 39 Years | 95 (12.5%) | 99 (12.8%) |
| 40 to 44 Years | 156 (20.5%) | 48 (6.2%) |
| 45 to 49 Years | 0 (0.0%) | 10 (1.3%) |
| 50 to 54 Years | 48 (6.3%) | 24 (3.1%) |
| 55 to 59 Years | 0 (0.0%) | 48 (6.2%) |
| 60 to 64 Years | 58 (7.6%) | 83 (10.7%) |
| 65 to 69 Years | 39 (5.1%) | 25 (3.2%) |
| 70 to 74 Years | 28 (3.7%) | 28 (3.6%) |
| 75 to 79 Years | 27 (3.5%) | 21 (2.7%) |
| 80 to 84 Years | 58 (7.6%) | 23 (3.0%) |
| 85 Years and over | 0 (0.0%) | 0 (0.0%) |
| Total | 760 (100.0%) | 776 (100.0%) |
Families and Households in Sunnyside Tahoe City
Median Family Size in Sunnyside Tahoe City
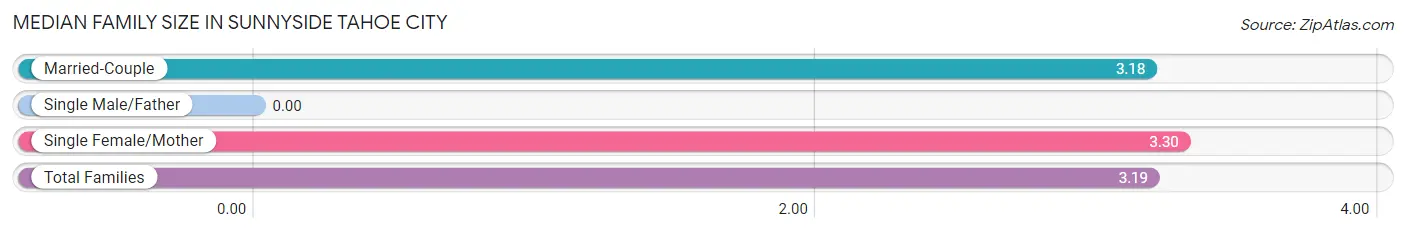
| Family Type | # Families | Family Size |
| Married-Couple | 353 (97.3%) | 3.18 |
| Single Male/Father | 0 (0.0%) | - |
| Single Female/Mother | 10 (2.8%) | 3.30 |
| Total Families | 363 (100.0%) | 3.19 |
Median Household Size in Sunnyside Tahoe City
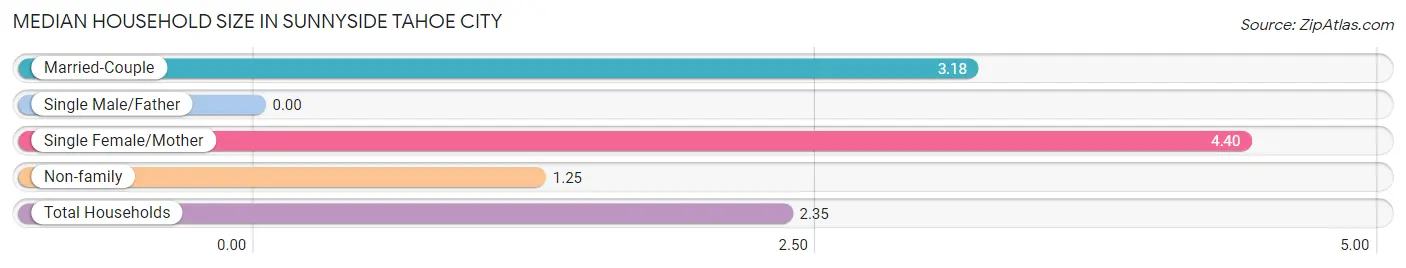
| Household Type | # Households | Household Size |
| Married-Couple | 353 (54.4%) | 3.18 |
| Single Male/Father | 0 (0.0%) | - |
| Single Female/Mother | 10 (1.5%) | 4.40 |
| Non-family | 286 (44.1%) | 1.25 |
| Total Households | 649 (100.0%) | 2.35 |
Household Size by Marriage Status in Sunnyside Tahoe City
Out of a total of 649 households in Sunnyside Tahoe City, 363 (55.9%) are family households, while 286 (44.1%) are nonfamily households. The most numerous type of family households are 2-person households, comprising 157, and the most common type of nonfamily households are 1-person households, comprising 222.
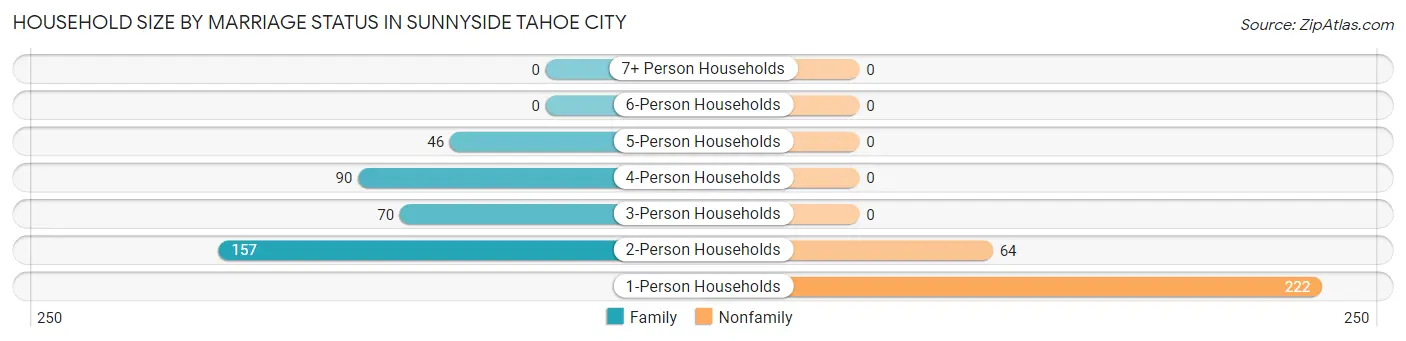
| Household Size | Family Households | Nonfamily Households |
| 1-Person Households | - | 222 (34.2%) |
| 2-Person Households | 157 (24.2%) | 64 (9.9%) |
| 3-Person Households | 70 (10.8%) | 0 (0.0%) |
| 4-Person Households | 90 (13.9%) | 0 (0.0%) |
| 5-Person Households | 46 (7.1%) | 0 (0.0%) |
| 6-Person Households | 0 (0.0%) | 0 (0.0%) |
| 7+ Person Households | 0 (0.0%) | 0 (0.0%) |
| Total | 363 (55.9%) | 286 (44.1%) |
Female Fertility in Sunnyside Tahoe City
Fertility by Age in Sunnyside Tahoe City
Average fertility rate in Sunnyside Tahoe City is 112.0 births per 1,000 women. Women in the age bracket of 20 to 34 years have the highest fertility rate with 214.0 births per 1,000 women. Women in the age bracket of 20 to 34 years acount for 100.0% of all women with births.
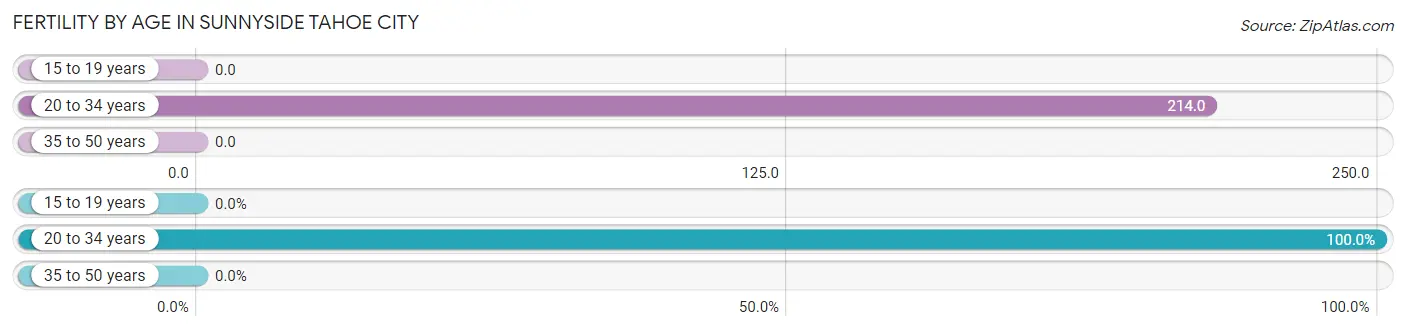
| Age Bracket | Women with Births | Births / 1,000 Women |
| 15 to 19 years | 0 (0.0%) | 0.0 |
| 20 to 34 years | 42 (100.0%) | 214.0 |
| 35 to 50 years | 0 (0.0%) | 0.0 |
| Total | 42 (100.0%) | 112.0 |
Fertility by Age by Marriage Status in Sunnyside Tahoe City
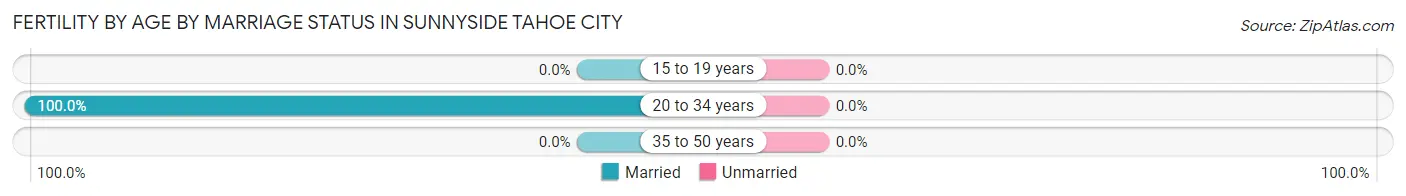
| Age Bracket | Married | Unmarried |
| 15 to 19 years | 0 (0.0%) | 0 (0.0%) |
| 20 to 34 years | 42 (100.0%) | 0 (0.0%) |
| 35 to 50 years | 0 (0.0%) | 0 (0.0%) |
| Total | 42 (100.0%) | 0 (0.0%) |
Fertility by Education in Sunnyside Tahoe City
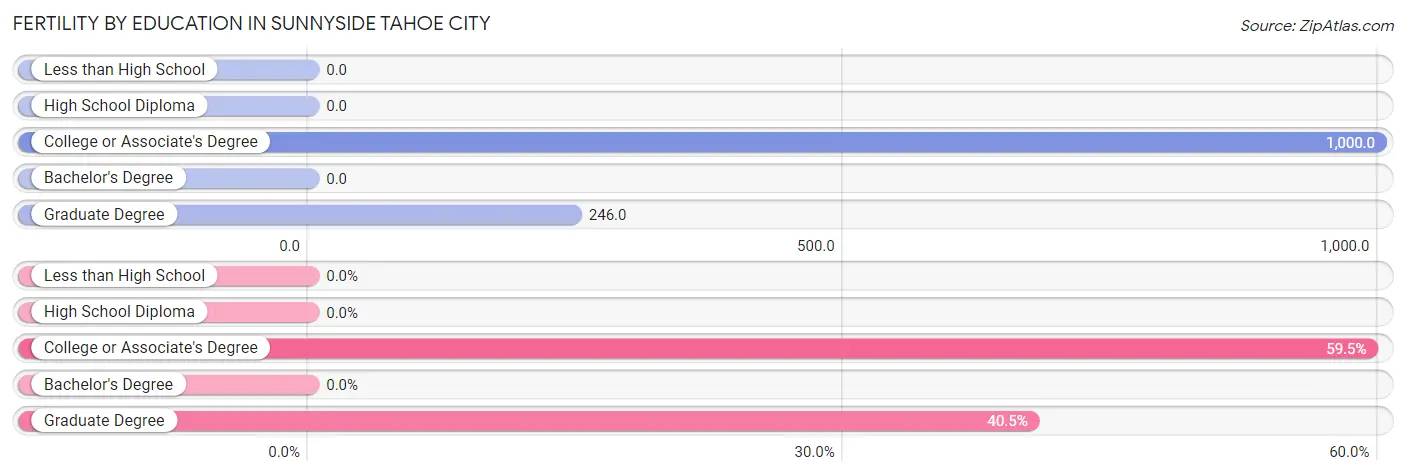
| Educational Attainment | Women with Births | Births / 1,000 Women |
| Less than High School | 0 (0.0%) | 0.0 |
| High School Diploma | 0 (0.0%) | 0.0 |
| College or Associate's Degree | 25 (59.5%) | 1,000.0 |
| Bachelor's Degree | 0 (0.0%) | 0.0 |
| Graduate Degree | 17 (40.5%) | 246.0 |
| Total | 42 (100.0%) | 112.0 |
Fertility by Education by Marriage Status in Sunnyside Tahoe City
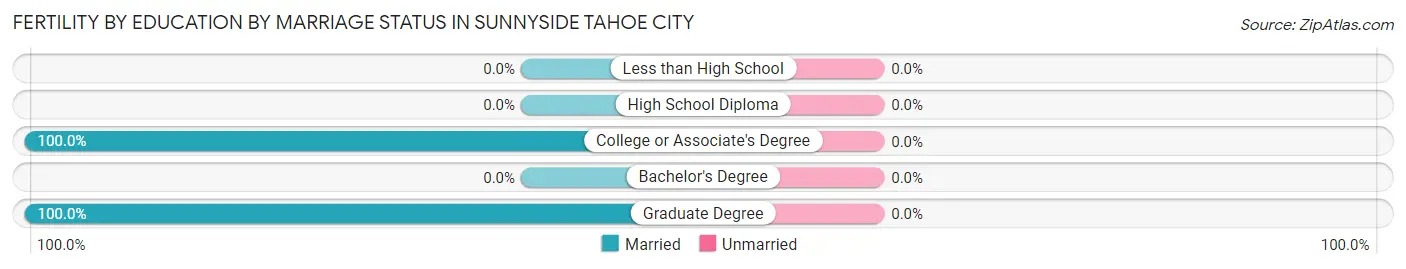
| Educational Attainment | Married | Unmarried |
| Less than High School | 0 (0.0%) | 0 (0.0%) |
| High School Diploma | 0 (0.0%) | 0 (0.0%) |
| College or Associate's Degree | 25 (100.0%) | 0 (0.0%) |
| Bachelor's Degree | 0 (0.0%) | 0 (0.0%) |
| Graduate Degree | 17 (100.0%) | 0 (0.0%) |
| Total | 42 (100.0%) | 0 (0.0%) |
Employment Characteristics in Sunnyside Tahoe City
Employment by Class of Employer in Sunnyside Tahoe City
Among the 775 employed individuals in Sunnyside Tahoe City, private company employees (488 | 63.0%), self-employed (not incorporated) (77 | 9.9%), and not-for-profit organizations (68 | 8.8%) make up the most common classes of employment.
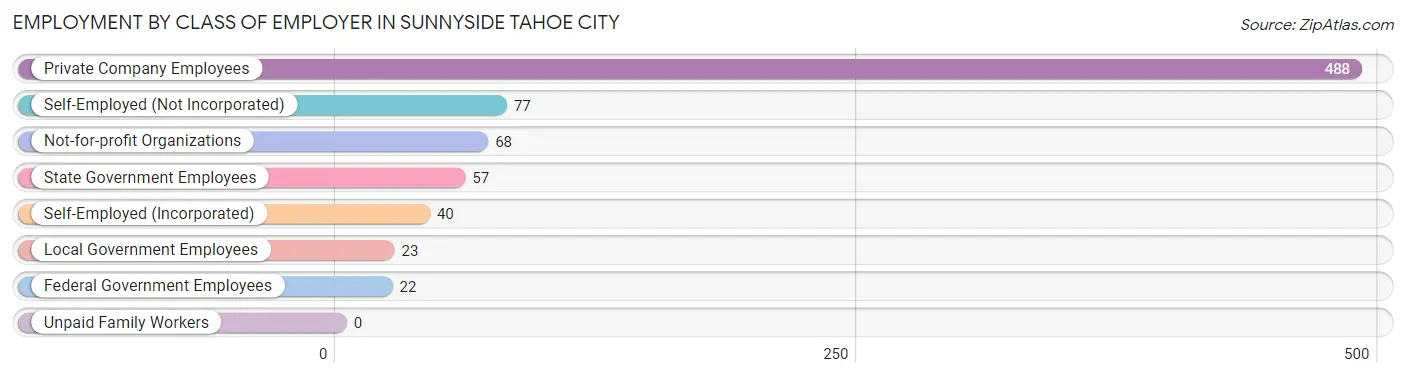
| Employer Class | # Employees | % Employees |
| Private Company Employees | 488 | 63.0% |
| Self-Employed (Incorporated) | 40 | 5.2% |
| Self-Employed (Not Incorporated) | 77 | 9.9% |
| Not-for-profit Organizations | 68 | 8.8% |
| Local Government Employees | 23 | 3.0% |
| State Government Employees | 57 | 7.3% |
| Federal Government Employees | 22 | 2.8% |
| Unpaid Family Workers | 0 | 0.0% |
| Total | 775 | 100.0% |
Employment Status by Age in Sunnyside Tahoe City
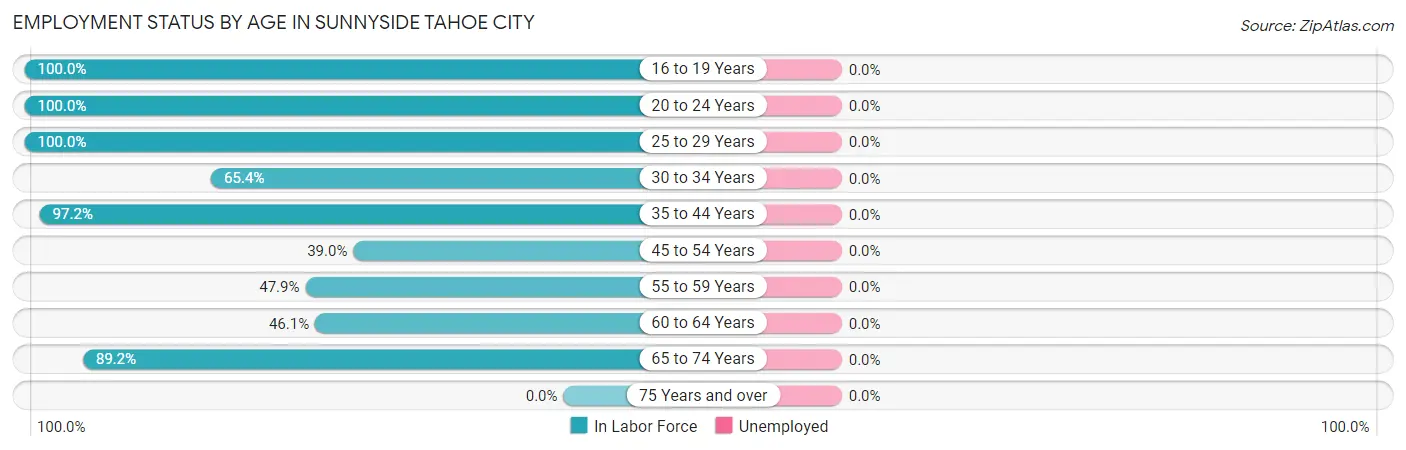
| Age Bracket | In Labor Force | Unemployed |
| 16 to 19 Years | 15 (100.0%) | 0 (0.0%) |
| 20 to 24 Years | 7 (100.0%) | 0 (0.0%) |
| 25 to 29 Years | 57 (100.0%) | 0 (0.0%) |
| 30 to 34 Years | 140 (65.4%) | 0 (0.0%) |
| 35 to 44 Years | 387 (97.2%) | 0 (0.0%) |
| 45 to 54 Years | 32 (39.0%) | 0 (0.0%) |
| 55 to 59 Years | 23 (47.9%) | 0 (0.0%) |
| 60 to 64 Years | 65 (46.1%) | 0 (0.0%) |
| 65 to 74 Years | 107 (89.2%) | 0 (0.0%) |
| 75 Years and over | 0 (0.0%) | 0 (0.0%) |
| Total | 833 (68.8%) | 0 (0.0%) |
Employment Status by Educational Attainment in Sunnyside Tahoe City
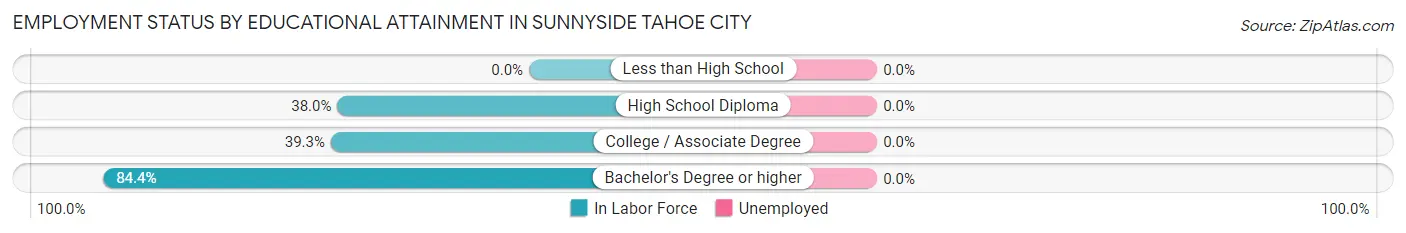
| Educational Attainment | In Labor Force | Unemployed |
| Less than High School | 0 (0.0%) | 0 (0.0%) |
| High School Diploma | 30 (38.0%) | 0 (0.0%) |
| College / Associate Degree | 46 (39.3%) | 0 (0.0%) |
| Bachelor's Degree or higher | 628 (84.4%) | 0 (0.0%) |
| Total | 704 (74.9%) | 0 (0.0%) |
Employment Occupations by Sex in Sunnyside Tahoe City
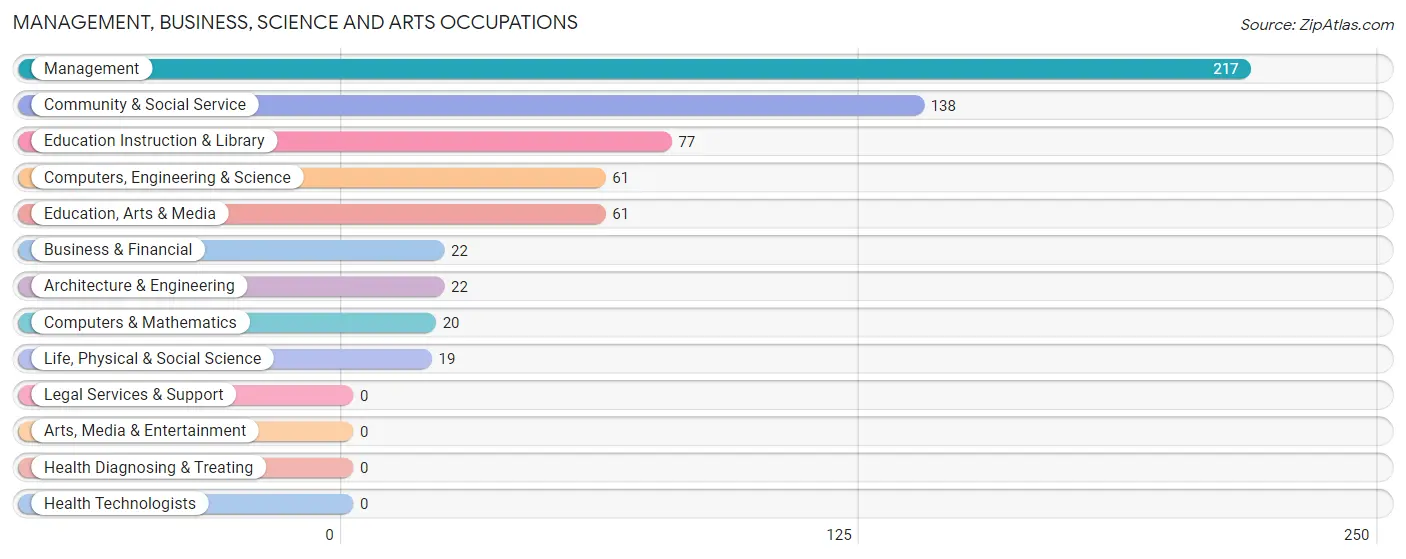
Management, Business, Science and Arts Occupations
The most common Management, Business, Science and Arts occupations in Sunnyside Tahoe City are Management (217 | 26.1%), Community & Social Service (138 | 16.6%), Education Instruction & Library (77 | 9.2%), Computers, Engineering & Science (61 | 7.3%), and Education, Arts & Media (61 | 7.3%).
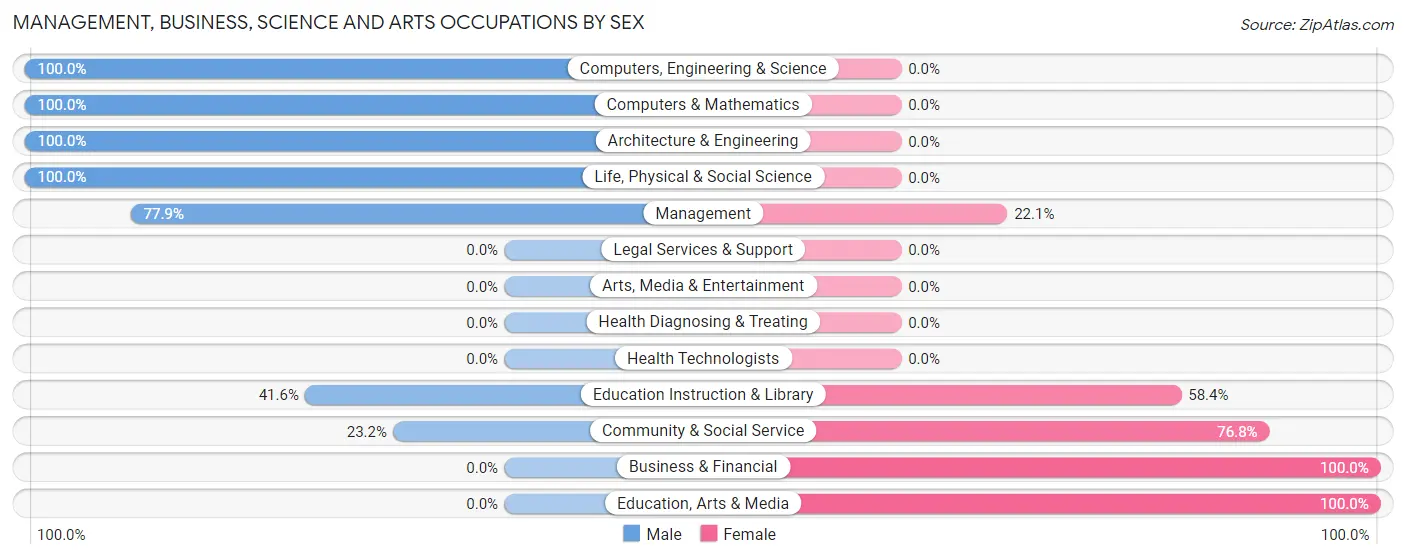
Management, Business, Science and Arts Occupations by Sex
Within the Management, Business, Science and Arts occupations in Sunnyside Tahoe City, the most male-oriented occupations are Computers, Engineering & Science (100.0%), Computers & Mathematics (100.0%), and Architecture & Engineering (100.0%), while the most female-oriented occupations are Business & Financial (100.0%), Education, Arts & Media (100.0%), and Community & Social Service (76.8%).
| Occupation | Male | Female |
| Management | 169 (77.9%) | 48 (22.1%) |
| Business & Financial | 0 (0.0%) | 22 (100.0%) |
| Computers, Engineering & Science | 61 (100.0%) | 0 (0.0%) |
| Computers & Mathematics | 20 (100.0%) | 0 (0.0%) |
| Architecture & Engineering | 22 (100.0%) | 0 (0.0%) |
| Life, Physical & Social Science | 19 (100.0%) | 0 (0.0%) |
| Community & Social Service | 32 (23.2%) | 106 (76.8%) |
| Education, Arts & Media | 0 (0.0%) | 61 (100.0%) |
| Legal Services & Support | 0 (0.0%) | 0 (0.0%) |
| Education Instruction & Library | 32 (41.6%) | 45 (58.4%) |
| Arts, Media & Entertainment | 0 (0.0%) | 0 (0.0%) |
| Health Diagnosing & Treating | 0 (0.0%) | 0 (0.0%) |
| Health Technologists | 0 (0.0%) | 0 (0.0%) |
| Total (Category) | 262 (59.8%) | 176 (40.2%) |
| Total (Overall) | 435 (52.2%) | 398 (47.8%) |
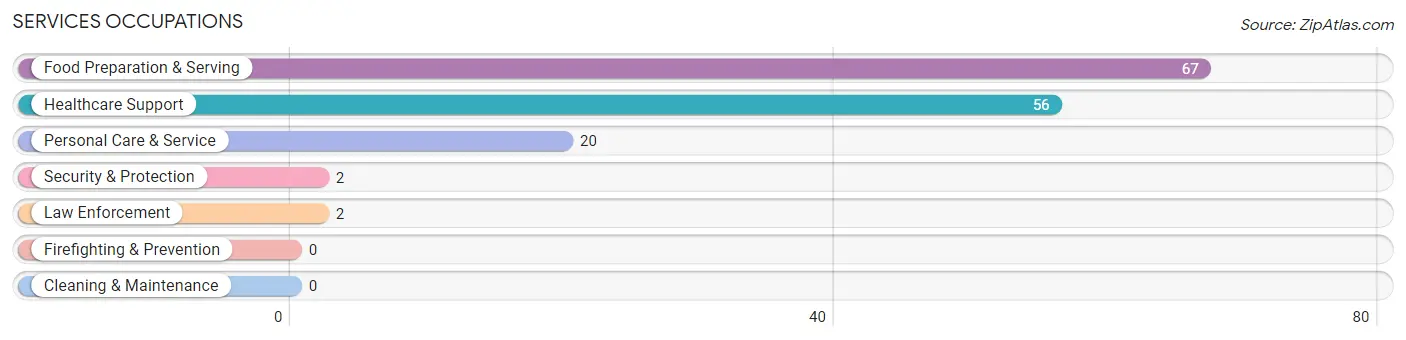
Services Occupations
The most common Services occupations in Sunnyside Tahoe City are Food Preparation & Serving (67 | 8.0%), Healthcare Support (56 | 6.7%), Personal Care & Service (20 | 2.4%), Security & Protection (2 | 0.2%), and Law Enforcement (2 | 0.2%).
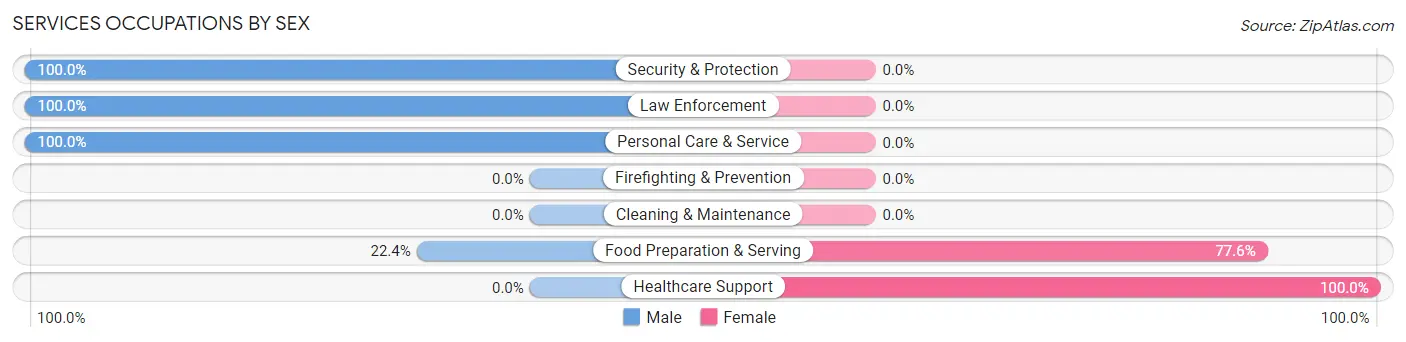
Services Occupations by Sex
Within the Services occupations in Sunnyside Tahoe City, the most male-oriented occupations are Security & Protection (100.0%), Law Enforcement (100.0%), and Personal Care & Service (100.0%), while the most female-oriented occupations are Healthcare Support (100.0%), and Food Preparation & Serving (77.6%).
| Occupation | Male | Female |
| Healthcare Support | 0 (0.0%) | 56 (100.0%) |
| Security & Protection | 2 (100.0%) | 0 (0.0%) |
| Firefighting & Prevention | 0 (0.0%) | 0 (0.0%) |
| Law Enforcement | 2 (100.0%) | 0 (0.0%) |
| Food Preparation & Serving | 15 (22.4%) | 52 (77.6%) |
| Cleaning & Maintenance | 0 (0.0%) | 0 (0.0%) |
| Personal Care & Service | 20 (100.0%) | 0 (0.0%) |
| Total (Category) | 37 (25.5%) | 108 (74.5%) |
| Total (Overall) | 435 (52.2%) | 398 (47.8%) |
Sales and Office Occupations
The most common Sales and Office occupations in Sunnyside Tahoe City are , and Sales & Related (159 | 19.1%).
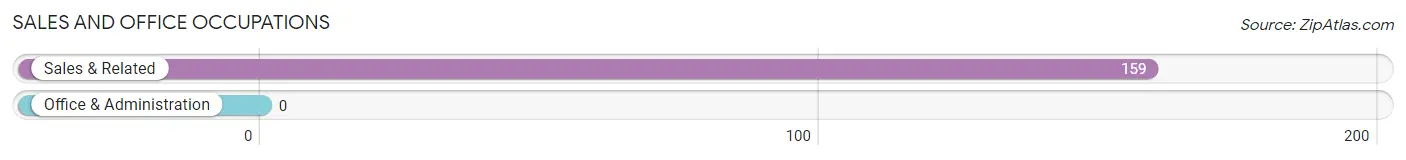
Sales and Office Occupations by Sex
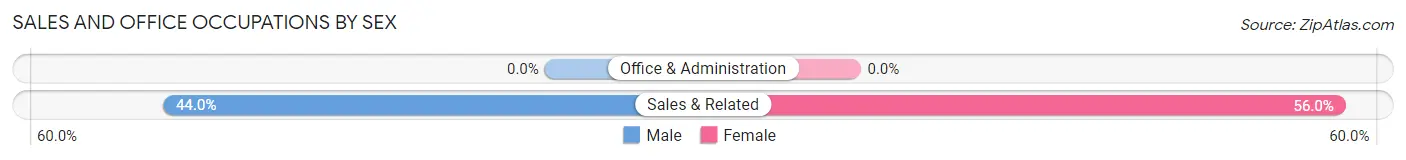
| Occupation | Male | Female |
| Sales & Related | 70 (44.0%) | 89 (56.0%) |
| Office & Administration | 0 (0.0%) | 0 (0.0%) |
| Total (Category) | 70 (44.0%) | 89 (56.0%) |
| Total (Overall) | 435 (52.2%) | 398 (47.8%) |
Natural Resources, Construction and Maintenance Occupations
The most common Natural Resources, Construction and Maintenance occupations in Sunnyside Tahoe City are Farming, Fishing & Forestry (22 | 2.6%), and Construction & Extraction (21 | 2.5%).
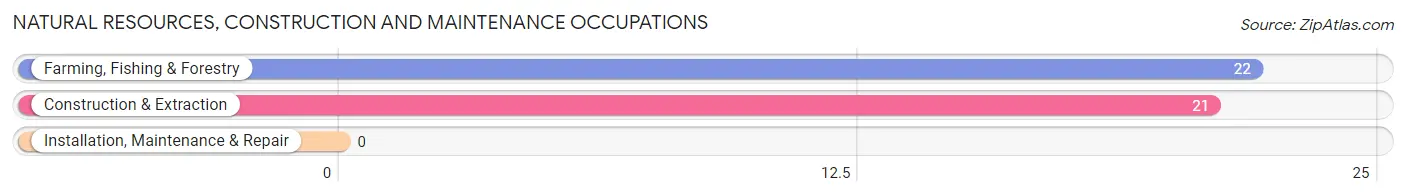
Natural Resources, Construction and Maintenance Occupations by Sex
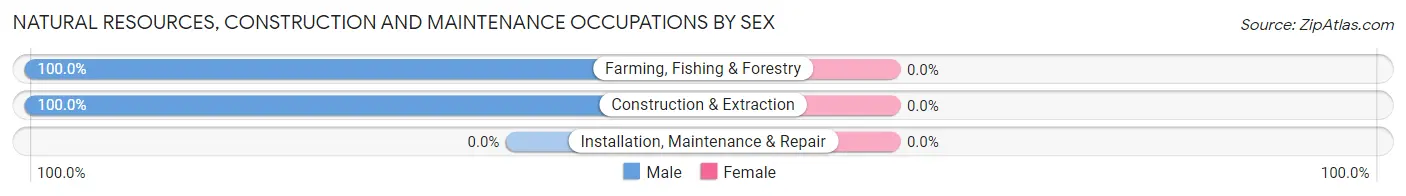
| Occupation | Male | Female |
| Farming, Fishing & Forestry | 22 (100.0%) | 0 (0.0%) |
| Construction & Extraction | 21 (100.0%) | 0 (0.0%) |
| Installation, Maintenance & Repair | 0 (0.0%) | 0 (0.0%) |
| Total (Category) | 43 (100.0%) | 0 (0.0%) |
| Total (Overall) | 435 (52.2%) | 398 (47.8%) |
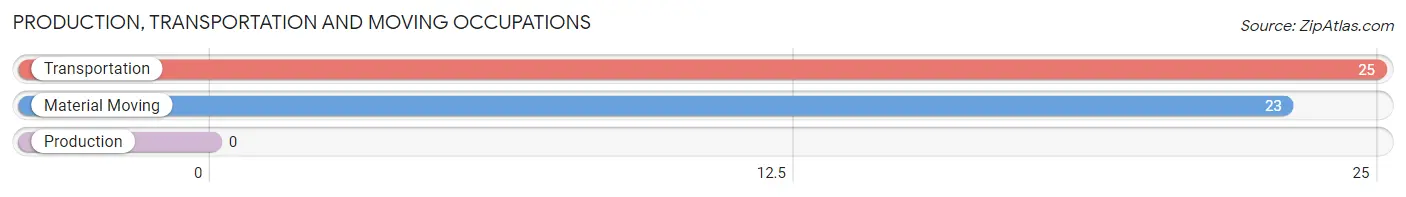
Production, Transportation and Moving Occupations
The most common Production, Transportation and Moving occupations in Sunnyside Tahoe City are Transportation (25 | 3.0%), and Material Moving (23 | 2.8%).
Production, Transportation and Moving Occupations by Sex
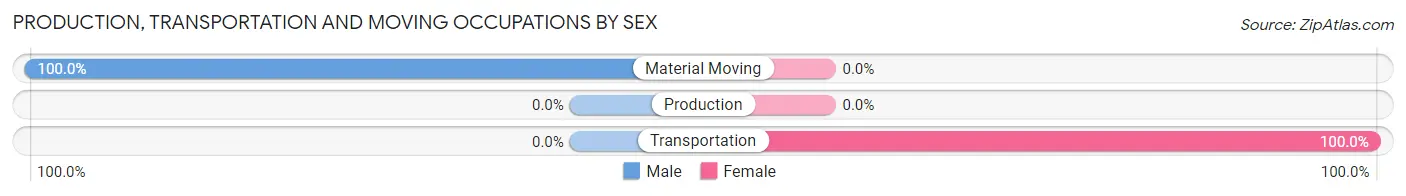
| Occupation | Male | Female |
| Production | 0 (0.0%) | 0 (0.0%) |
| Transportation | 0 (0.0%) | 25 (100.0%) |
| Material Moving | 23 (100.0%) | 0 (0.0%) |
| Total (Category) | 23 (47.9%) | 25 (52.1%) |
| Total (Overall) | 435 (52.2%) | 398 (47.8%) |
Employment Industries by Sex in Sunnyside Tahoe City
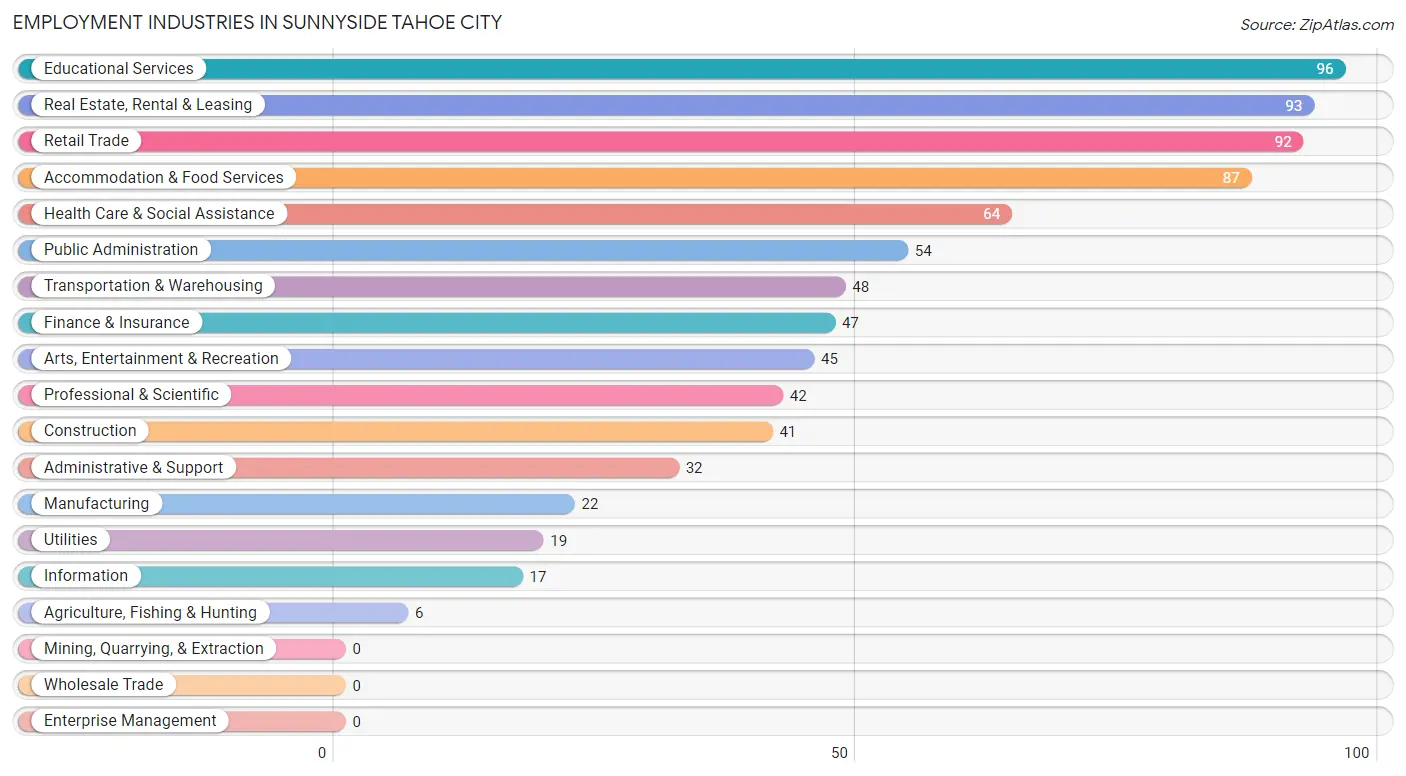
Employment Industries in Sunnyside Tahoe City
The major employment industries in Sunnyside Tahoe City include Educational Services (96 | 11.5%), Real Estate, Rental & Leasing (93 | 11.2%), Retail Trade (92 | 11.0%), Accommodation & Food Services (87 | 10.4%), and Health Care & Social Assistance (64 | 7.7%).
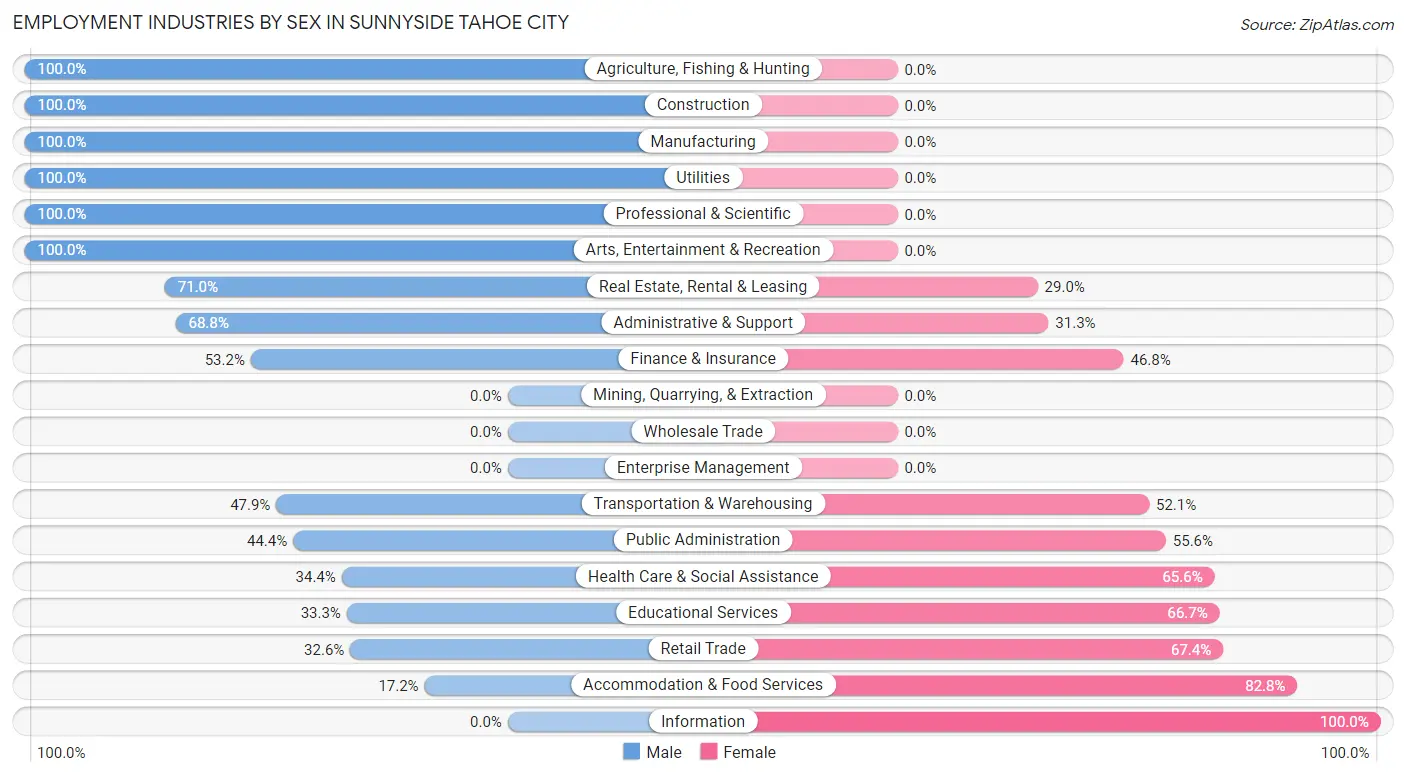
Employment Industries by Sex in Sunnyside Tahoe City
The Sunnyside Tahoe City industries that see more men than women are Agriculture, Fishing & Hunting (100.0%), Construction (100.0%), and Manufacturing (100.0%), whereas the industries that tend to have a higher number of women are Information (100.0%), Accommodation & Food Services (82.8%), and Retail Trade (67.4%).
| Industry | Male | Female |
| Agriculture, Fishing & Hunting | 6 (100.0%) | 0 (0.0%) |
| Mining, Quarrying, & Extraction | 0 (0.0%) | 0 (0.0%) |
| Construction | 41 (100.0%) | 0 (0.0%) |
| Manufacturing | 22 (100.0%) | 0 (0.0%) |
| Wholesale Trade | 0 (0.0%) | 0 (0.0%) |
| Retail Trade | 30 (32.6%) | 62 (67.4%) |
| Transportation & Warehousing | 23 (47.9%) | 25 (52.1%) |
| Utilities | 19 (100.0%) | 0 (0.0%) |
| Information | 0 (0.0%) | 17 (100.0%) |
| Finance & Insurance | 25 (53.2%) | 22 (46.8%) |
| Real Estate, Rental & Leasing | 66 (71.0%) | 27 (29.0%) |
| Professional & Scientific | 42 (100.0%) | 0 (0.0%) |
| Enterprise Management | 0 (0.0%) | 0 (0.0%) |
| Administrative & Support | 22 (68.8%) | 10 (31.2%) |
| Educational Services | 32 (33.3%) | 64 (66.7%) |
| Health Care & Social Assistance | 22 (34.4%) | 42 (65.6%) |
| Arts, Entertainment & Recreation | 45 (100.0%) | 0 (0.0%) |
| Accommodation & Food Services | 15 (17.2%) | 72 (82.8%) |
| Public Administration | 24 (44.4%) | 30 (55.6%) |
| Total | 435 (52.2%) | 398 (47.8%) |
Education in Sunnyside Tahoe City
School Enrollment in Sunnyside Tahoe City
The most common levels of schooling among the 225 students in Sunnyside Tahoe City are college / undergraduate (53 | 23.6%), kindergarten (42 | 18.7%), and elementary school (42 | 18.7%).
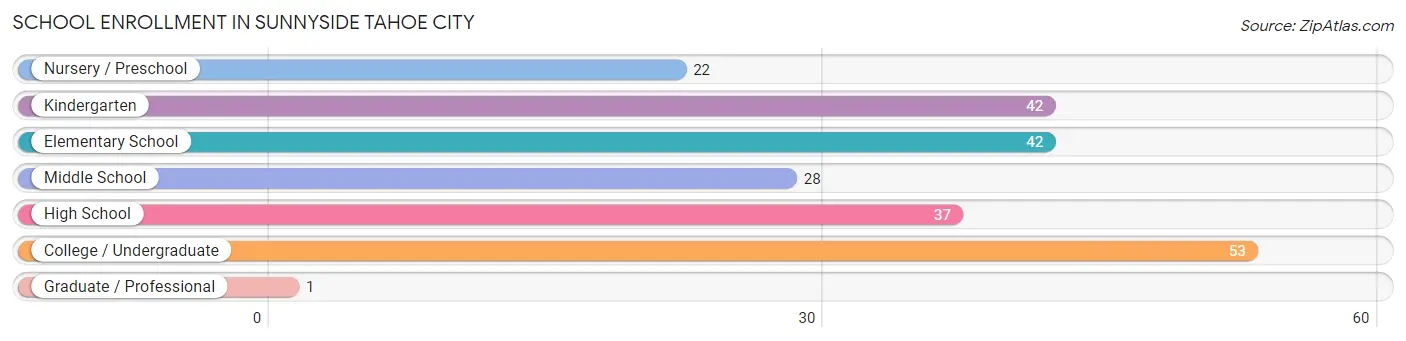
| School Level | # Students | % Students |
| Nursery / Preschool | 22 | 9.8% |
| Kindergarten | 42 | 18.7% |
| Elementary School | 42 | 18.7% |
| Middle School | 28 | 12.4% |
| High School | 37 | 16.4% |
| College / Undergraduate | 53 | 23.6% |
| Graduate / Professional | 1 | 0.4% |
| Total | 225 | 100.0% |
School Enrollment by Age by Funding Source in Sunnyside Tahoe City
Out of a total of 225 students who are enrolled in schools in Sunnyside Tahoe City, 22 (9.8%) attend a private institution, while the remaining 203 (90.2%) are enrolled in public schools. The age group of 3 to 4 year olds has the highest likelihood of being enrolled in private schools, with 22 (100.0% in the age bracket) enrolled. Conversely, the age group of 5 to 9 year old has the lowest likelihood of being enrolled in a private school, with 63 (100.0% in the age bracket) attending a public institution.
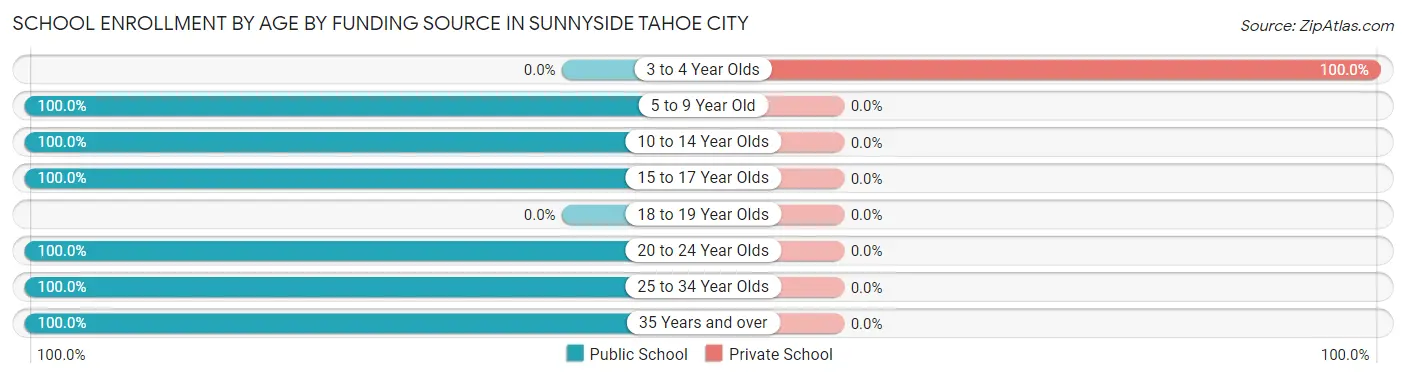
| Age Bracket | Public School | Private School |
| 3 to 4 Year Olds | 0 (0.0%) | 22 (100.0%) |
| 5 to 9 Year Old | 63 (100.0%) | 0 (0.0%) |
| 10 to 14 Year Olds | 49 (100.0%) | 0 (0.0%) |
| 15 to 17 Year Olds | 37 (100.0%) | 0 (0.0%) |
| 18 to 19 Year Olds | 0 (0.0%) | 0 (0.0%) |
| 20 to 24 Year Olds | 7 (100.0%) | 0 (0.0%) |
| 25 to 34 Year Olds | 19 (100.0%) | 0 (0.0%) |
| 35 Years and over | 28 (100.0%) | 0 (0.0%) |
| Total | 203 (90.2%) | 22 (9.8%) |
Educational Attainment by Field of Study in Sunnyside Tahoe City
Liberal arts & history (136 | 14.6%), bio, nature & agricultural (126 | 13.5%), social sciences (114 | 12.2%), education (110 | 11.8%), and business (109 | 11.7%) are the most common fields of study among 931 individuals in Sunnyside Tahoe City who have obtained a bachelor's degree or higher.
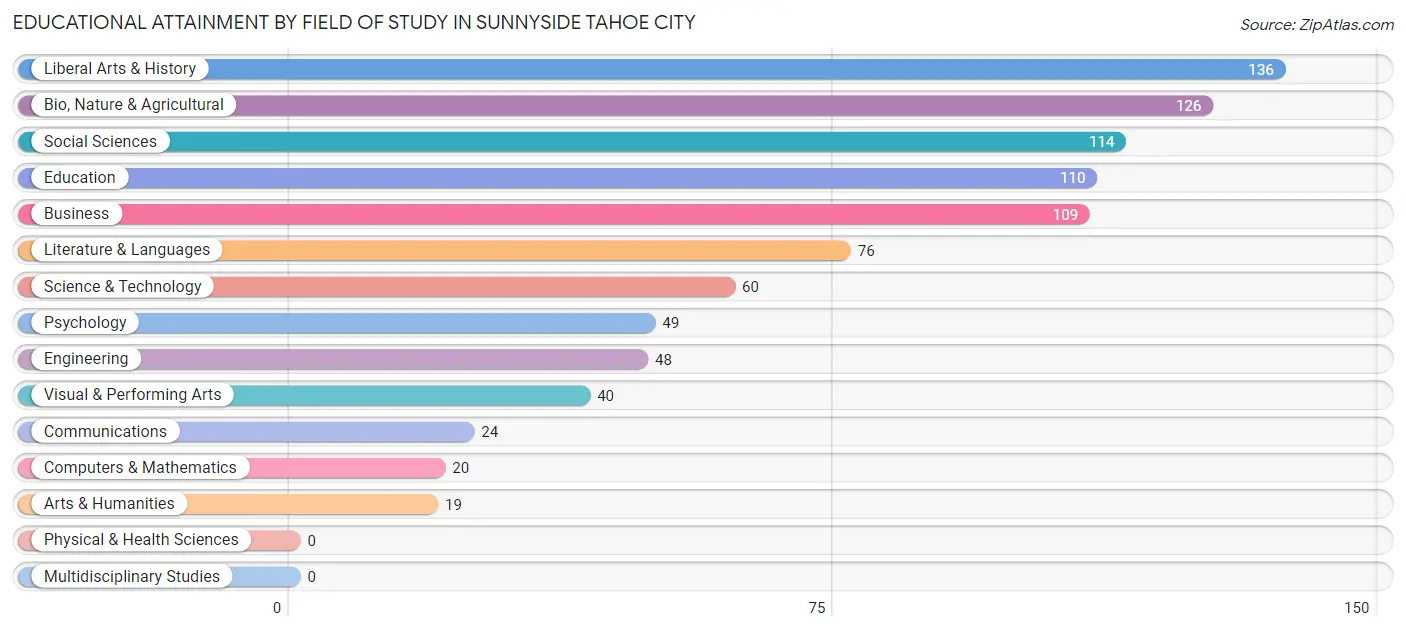
| Field of Study | # Graduates | % Graduates |
| Computers & Mathematics | 20 | 2.1% |
| Bio, Nature & Agricultural | 126 | 13.5% |
| Physical & Health Sciences | 0 | 0.0% |
| Psychology | 49 | 5.3% |
| Social Sciences | 114 | 12.2% |
| Engineering | 48 | 5.2% |
| Multidisciplinary Studies | 0 | 0.0% |
| Science & Technology | 60 | 6.4% |
| Business | 109 | 11.7% |
| Education | 110 | 11.8% |
| Literature & Languages | 76 | 8.2% |
| Liberal Arts & History | 136 | 14.6% |
| Visual & Performing Arts | 40 | 4.3% |
| Communications | 24 | 2.6% |
| Arts & Humanities | 19 | 2.0% |
| Total | 931 | 100.0% |
Transportation & Commute in Sunnyside Tahoe City
Vehicle Availability by Sex in Sunnyside Tahoe City
The most prevalent vehicle ownership categories in Sunnyside Tahoe City are males with 2 vehicles (270, accounting for 67.5%) and females with 2 vehicles (240, making up 73.8%).
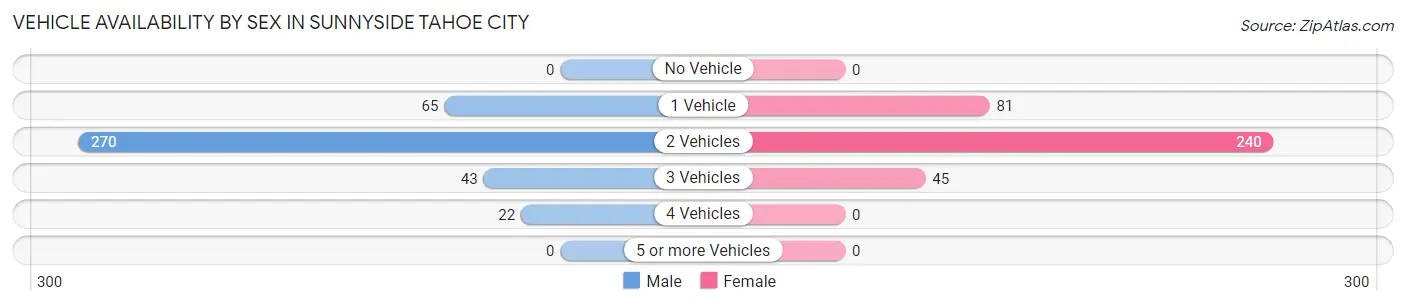
| Vehicles Available | Male | Female |
| No Vehicle | 0 (0.0%) | 0 (0.0%) |
| 1 Vehicle | 65 (16.3%) | 81 (22.1%) |
| 2 Vehicles | 270 (67.5%) | 240 (65.6%) |
| 3 Vehicles | 43 (10.7%) | 45 (12.3%) |
| 4 Vehicles | 22 (5.5%) | 0 (0.0%) |
| 5 or more Vehicles | 0 (0.0%) | 0 (0.0%) |
| Total | 400 (100.0%) | 366 (100.0%) |
Commute Time in Sunnyside Tahoe City
The most frequently occuring commute durations in Sunnyside Tahoe City are 5 to 9 minutes (134 commuters, 19.9%), 90 or more minutes (130 commuters, 19.3%), and 30 to 34 minutes (121 commuters, 17.9%).
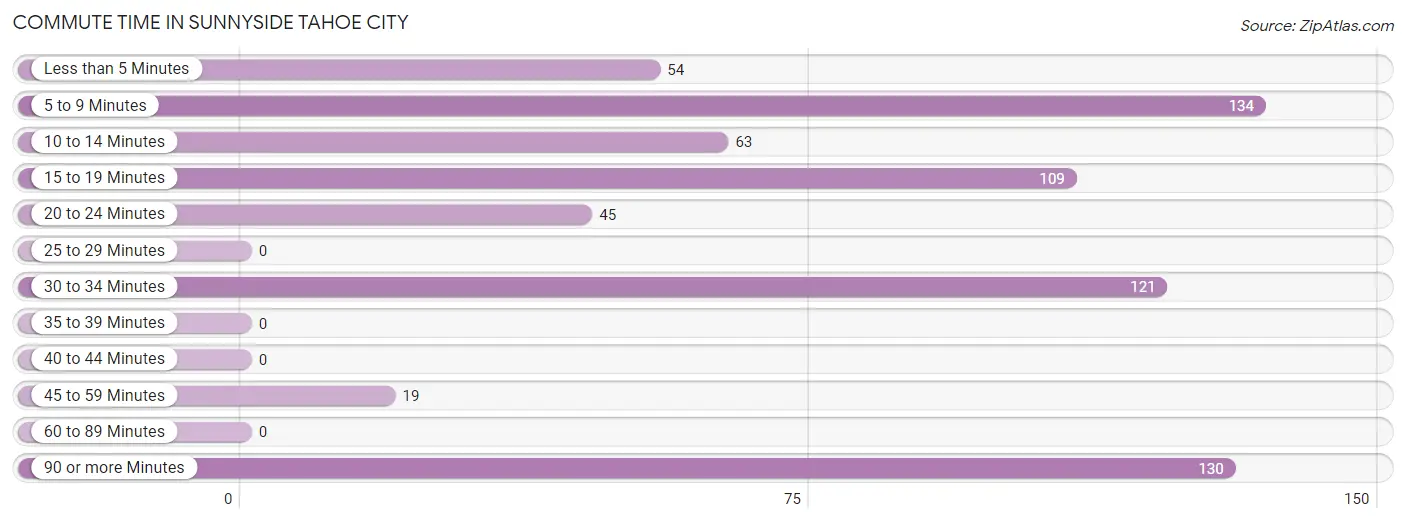
| Commute Time | # Commuters | % Commuters |
| Less than 5 Minutes | 54 | 8.0% |
| 5 to 9 Minutes | 134 | 19.9% |
| 10 to 14 Minutes | 63 | 9.3% |
| 15 to 19 Minutes | 109 | 16.2% |
| 20 to 24 Minutes | 45 | 6.7% |
| 25 to 29 Minutes | 0 | 0.0% |
| 30 to 34 Minutes | 121 | 17.9% |
| 35 to 39 Minutes | 0 | 0.0% |
| 40 to 44 Minutes | 0 | 0.0% |
| 45 to 59 Minutes | 19 | 2.8% |
| 60 to 89 Minutes | 0 | 0.0% |
| 90 or more Minutes | 130 | 19.3% |
Commute Time by Sex in Sunnyside Tahoe City
The most common commute times in Sunnyside Tahoe City are 90 or more minutes (130 commuters, 37.7%) for males and 5 to 9 minutes (83 commuters, 25.2%) for females.
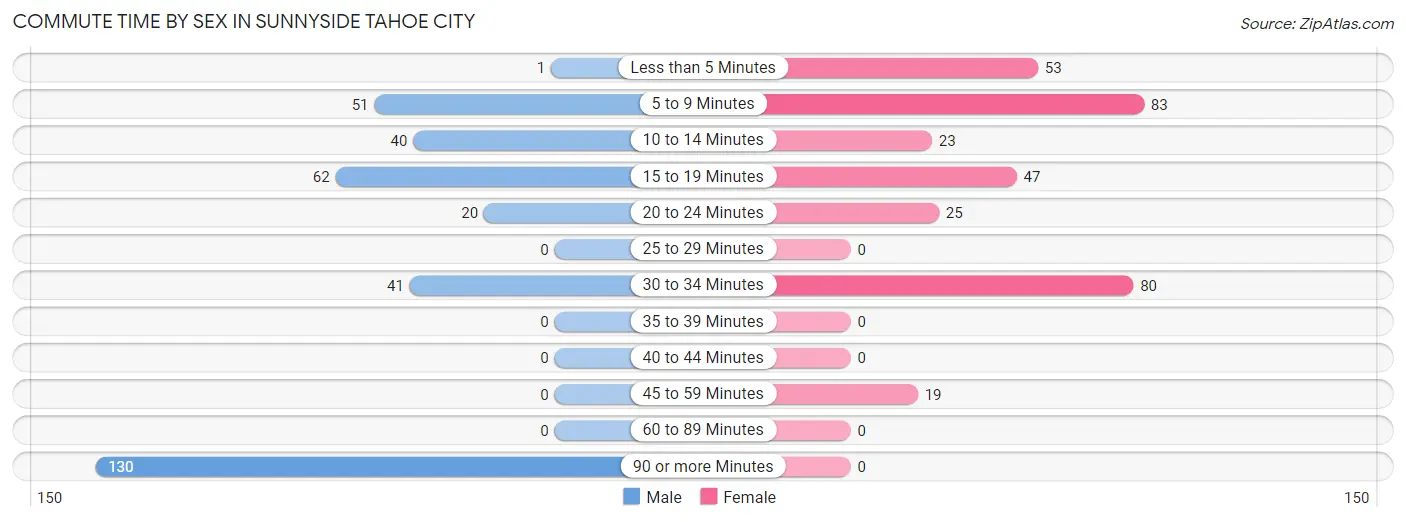
| Commute Time | Male | Female |
| Less than 5 Minutes | 1 (0.3%) | 53 (16.1%) |
| 5 to 9 Minutes | 51 (14.8%) | 83 (25.2%) |
| 10 to 14 Minutes | 40 (11.6%) | 23 (7.0%) |
| 15 to 19 Minutes | 62 (18.0%) | 47 (14.2%) |
| 20 to 24 Minutes | 20 (5.8%) | 25 (7.6%) |
| 25 to 29 Minutes | 0 (0.0%) | 0 (0.0%) |
| 30 to 34 Minutes | 41 (11.9%) | 80 (24.2%) |
| 35 to 39 Minutes | 0 (0.0%) | 0 (0.0%) |
| 40 to 44 Minutes | 0 (0.0%) | 0 (0.0%) |
| 45 to 59 Minutes | 0 (0.0%) | 19 (5.8%) |
| 60 to 89 Minutes | 0 (0.0%) | 0 (0.0%) |
| 90 or more Minutes | 130 (37.7%) | 0 (0.0%) |
Time of Departure to Work by Sex in Sunnyside Tahoe City
The most frequent times of departure to work in Sunnyside Tahoe City are 5:00 AM to 5:29 AM (67, 19.4%) for males and 8:00 AM to 8:29 AM (85, 25.8%) for females.
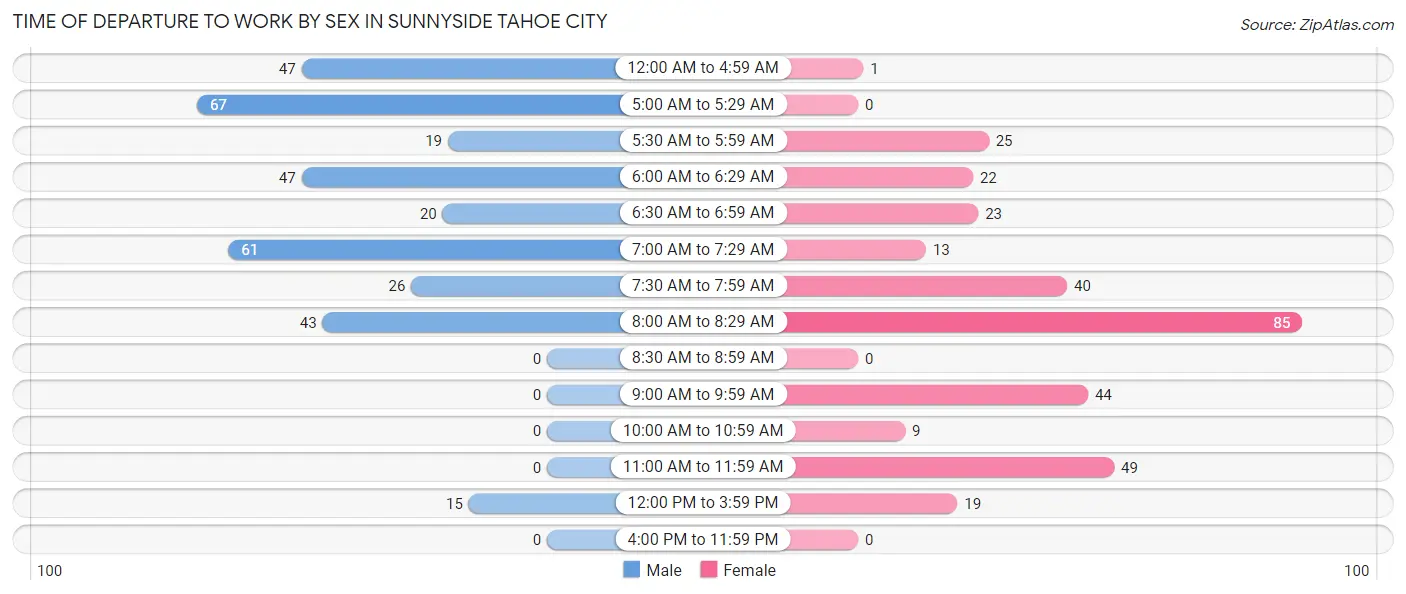
| Time of Departure | Male | Female |
| 12:00 AM to 4:59 AM | 47 (13.6%) | 1 (0.3%) |
| 5:00 AM to 5:29 AM | 67 (19.4%) | 0 (0.0%) |
| 5:30 AM to 5:59 AM | 19 (5.5%) | 25 (7.6%) |
| 6:00 AM to 6:29 AM | 47 (13.6%) | 22 (6.7%) |
| 6:30 AM to 6:59 AM | 20 (5.8%) | 23 (7.0%) |
| 7:00 AM to 7:29 AM | 61 (17.7%) | 13 (3.9%) |
| 7:30 AM to 7:59 AM | 26 (7.5%) | 40 (12.1%) |
| 8:00 AM to 8:29 AM | 43 (12.5%) | 85 (25.8%) |
| 8:30 AM to 8:59 AM | 0 (0.0%) | 0 (0.0%) |
| 9:00 AM to 9:59 AM | 0 (0.0%) | 44 (13.3%) |
| 10:00 AM to 10:59 AM | 0 (0.0%) | 9 (2.7%) |
| 11:00 AM to 11:59 AM | 0 (0.0%) | 49 (14.8%) |
| 12:00 PM to 3:59 PM | 15 (4.3%) | 19 (5.8%) |
| 4:00 PM to 11:59 PM | 0 (0.0%) | 0 (0.0%) |
| Total | 345 (100.0%) | 330 (100.0%) |
Housing Occupancy in Sunnyside Tahoe City
Occupancy by Ownership in Sunnyside Tahoe City
Of the total 649 dwellings in Sunnyside Tahoe City, owner-occupied units account for 438 (67.5%), while renter-occupied units make up 211 (32.5%).
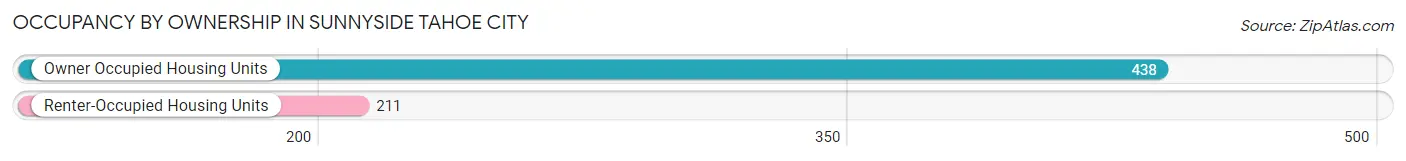
| Occupancy | # Housing Units | % Housing Units |
| Owner Occupied Housing Units | 438 | 67.5% |
| Renter-Occupied Housing Units | 211 | 32.5% |
| Total Occupied Housing Units | 649 | 100.0% |
Occupancy by Household Size in Sunnyside Tahoe City
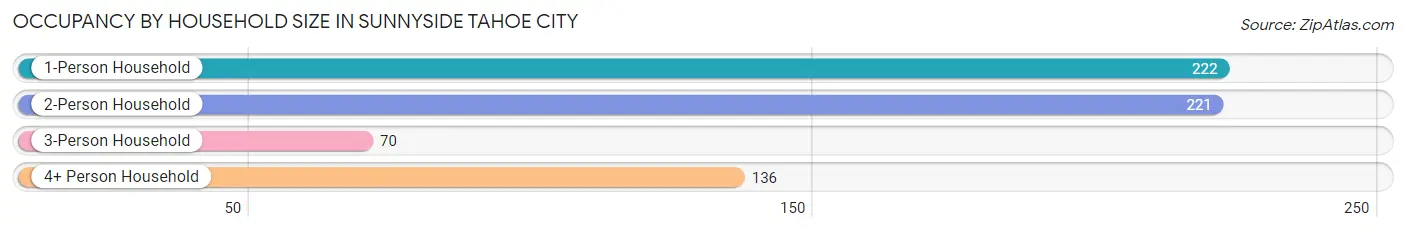
| Household Size | # Housing Units | % Housing Units |
| 1-Person Household | 222 | 34.2% |
| 2-Person Household | 221 | 34.1% |
| 3-Person Household | 70 | 10.8% |
| 4+ Person Household | 136 | 21.0% |
| Total Housing Units | 649 | 100.0% |
Occupancy by Ownership by Household Size in Sunnyside Tahoe City
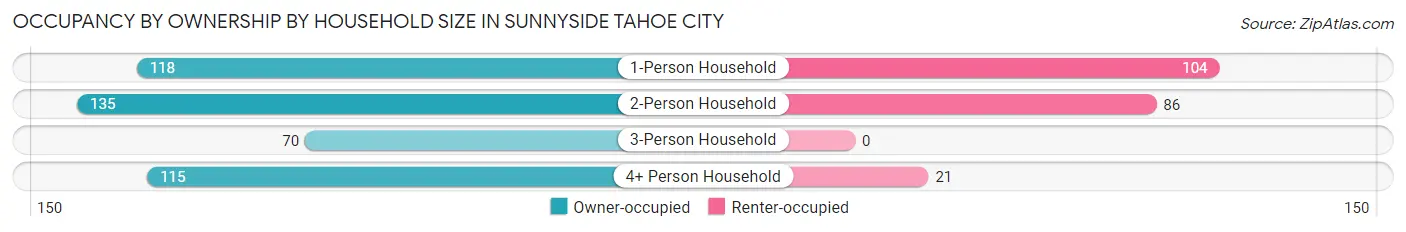
| Household Size | Owner-occupied | Renter-occupied |
| 1-Person Household | 118 (53.1%) | 104 (46.9%) |
| 2-Person Household | 135 (61.1%) | 86 (38.9%) |
| 3-Person Household | 70 (100.0%) | 0 (0.0%) |
| 4+ Person Household | 115 (84.6%) | 21 (15.4%) |
| Total Housing Units | 438 (67.5%) | 211 (32.5%) |
Occupancy by Educational Attainment in Sunnyside Tahoe City
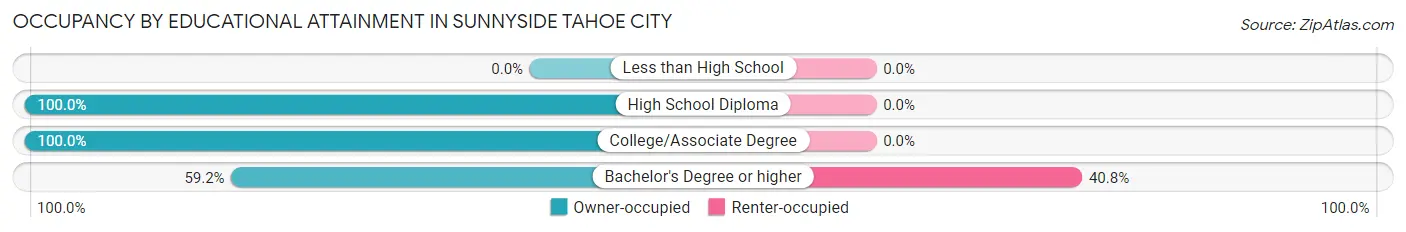
| Household Size | Owner-occupied | Renter-occupied |
| Less than High School | 0 (0.0%) | 0 (0.0%) |
| High School Diploma | 27 (100.0%) | 0 (0.0%) |
| College/Associate Degree | 105 (100.0%) | 0 (0.0%) |
| Bachelor's Degree or higher | 306 (59.2%) | 211 (40.8%) |
Occupancy by Age of Householder in Sunnyside Tahoe City
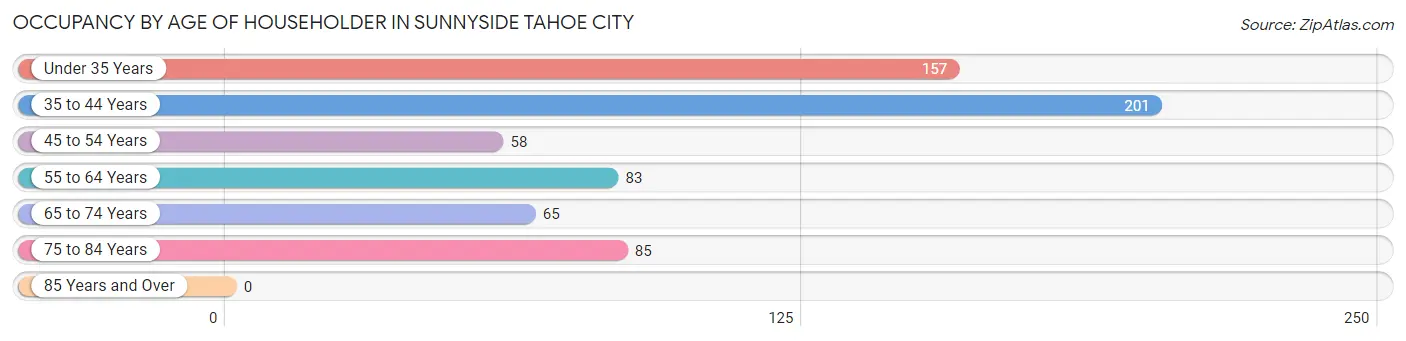
| Age Bracket | # Households | % Households |
| Under 35 Years | 157 | 24.2% |
| 35 to 44 Years | 201 | 31.0% |
| 45 to 54 Years | 58 | 8.9% |
| 55 to 64 Years | 83 | 12.8% |
| 65 to 74 Years | 65 | 10.0% |
| 75 to 84 Years | 85 | 13.1% |
| 85 Years and Over | 0 | 0.0% |
| Total | 649 | 100.0% |
Housing Finances in Sunnyside Tahoe City
Median Income by Occupancy in Sunnyside Tahoe City
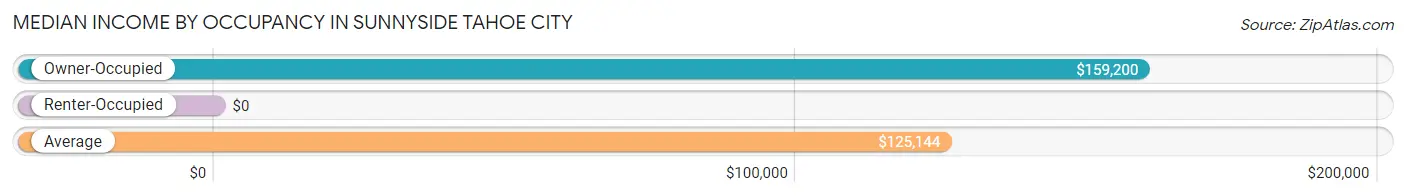
| Occupancy Type | # Households | Median Income |
| Owner-Occupied | 438 (67.5%) | $159,200 |
| Renter-Occupied | 211 (32.5%) | $0 |
| Average | 649 (100.0%) | $125,144 |
Occupancy by Householder Income Bracket in Sunnyside Tahoe City
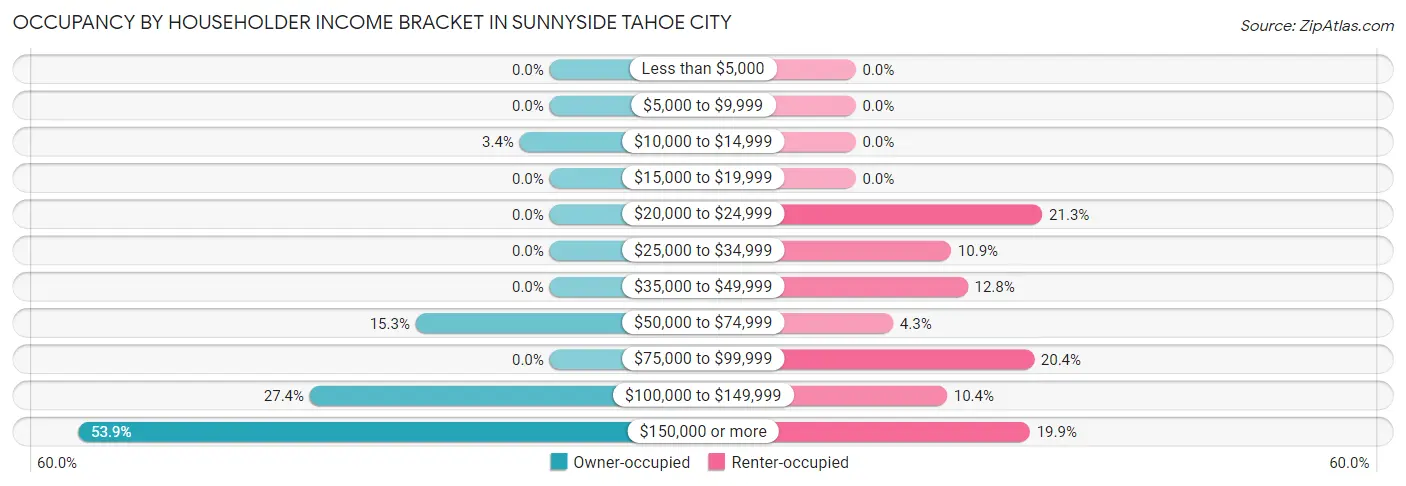
| Income Bracket | Owner-occupied | Renter-occupied |
| Less than $5,000 | 0 (0.0%) | 0 (0.0%) |
| $5,000 to $9,999 | 0 (0.0%) | 0 (0.0%) |
| $10,000 to $14,999 | 15 (3.4%) | 0 (0.0%) |
| $15,000 to $19,999 | 0 (0.0%) | 0 (0.0%) |
| $20,000 to $24,999 | 0 (0.0%) | 45 (21.3%) |
| $25,000 to $34,999 | 0 (0.0%) | 23 (10.9%) |
| $35,000 to $49,999 | 0 (0.0%) | 27 (12.8%) |
| $50,000 to $74,999 | 67 (15.3%) | 9 (4.3%) |
| $75,000 to $99,999 | 0 (0.0%) | 43 (20.4%) |
| $100,000 to $149,999 | 120 (27.4%) | 22 (10.4%) |
| $150,000 or more | 236 (53.9%) | 42 (19.9%) |
| Total | 438 (100.0%) | 211 (100.0%) |
Monthly Housing Cost Tiers in Sunnyside Tahoe City
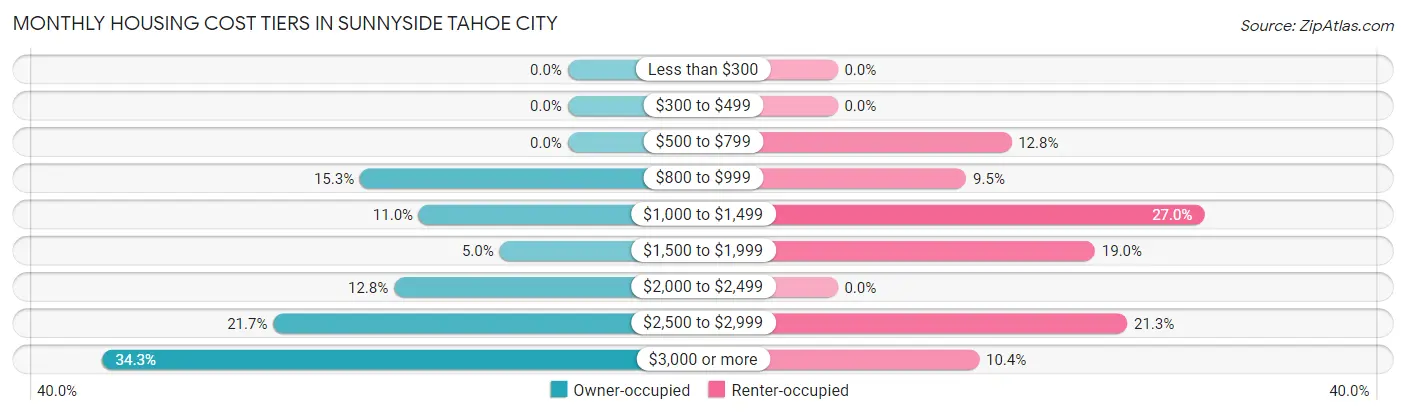
| Monthly Cost | Owner-occupied | Renter-occupied |
| Less than $300 | 0 (0.0%) | 0 (0.0%) |
| $300 to $499 | 0 (0.0%) | 0 (0.0%) |
| $500 to $799 | 0 (0.0%) | 27 (12.8%) |
| $800 to $999 | 67 (15.3%) | 20 (9.5%) |
| $1,000 to $1,499 | 48 (11.0%) | 57 (27.0%) |
| $1,500 to $1,999 | 22 (5.0%) | 40 (19.0%) |
| $2,000 to $2,499 | 56 (12.8%) | 0 (0.0%) |
| $2,500 to $2,999 | 95 (21.7%) | 45 (21.3%) |
| $3,000 or more | 150 (34.3%) | 22 (10.4%) |
| Total | 438 (100.0%) | 211 (100.0%) |
Physical Housing Characteristics in Sunnyside Tahoe City
Housing Structures in Sunnyside Tahoe City
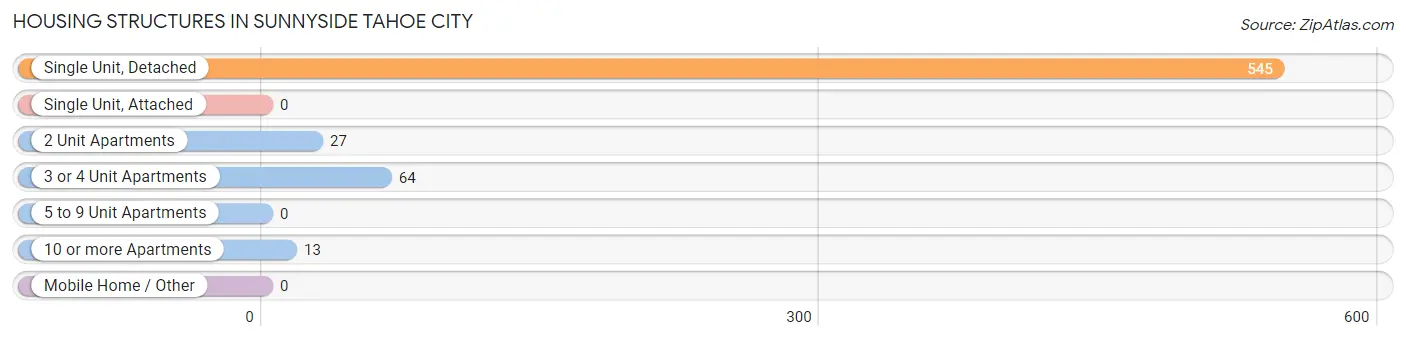
| Structure Type | # Housing Units | % Housing Units |
| Single Unit, Detached | 545 | 84.0% |
| Single Unit, Attached | 0 | 0.0% |
| 2 Unit Apartments | 27 | 4.2% |
| 3 or 4 Unit Apartments | 64 | 9.9% |
| 5 to 9 Unit Apartments | 0 | 0.0% |
| 10 or more Apartments | 13 | 2.0% |
| Mobile Home / Other | 0 | 0.0% |
| Total | 649 | 100.0% |
Housing Structures by Occupancy in Sunnyside Tahoe City
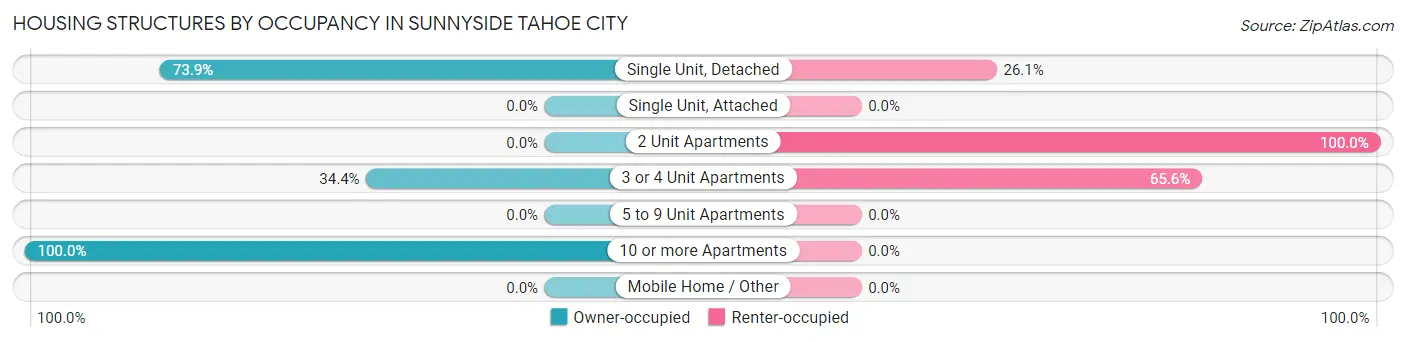
| Structure Type | Owner-occupied | Renter-occupied |
| Single Unit, Detached | 403 (73.9%) | 142 (26.1%) |
| Single Unit, Attached | 0 (0.0%) | 0 (0.0%) |
| 2 Unit Apartments | 0 (0.0%) | 27 (100.0%) |
| 3 or 4 Unit Apartments | 22 (34.4%) | 42 (65.6%) |
| 5 to 9 Unit Apartments | 0 (0.0%) | 0 (0.0%) |
| 10 or more Apartments | 13 (100.0%) | 0 (0.0%) |
| Mobile Home / Other | 0 (0.0%) | 0 (0.0%) |
| Total | 438 (67.5%) | 211 (32.5%) |
Housing Structures by Number of Rooms in Sunnyside Tahoe City
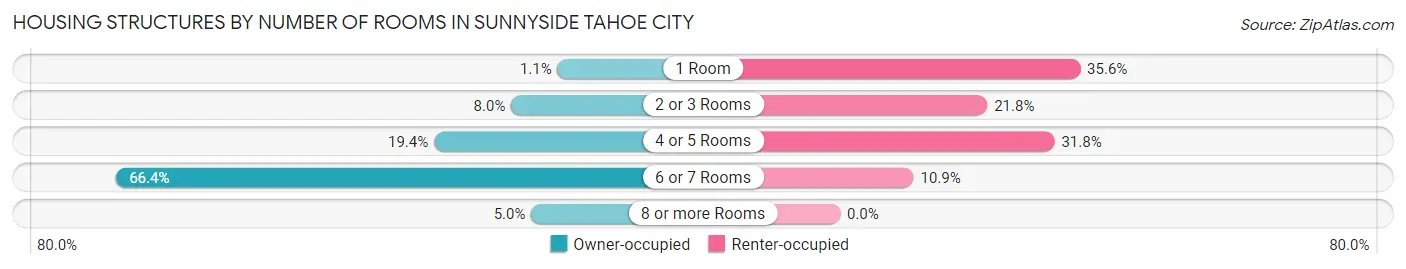
| Number of Rooms | Owner-occupied | Renter-occupied |
| 1 Room | 5 (1.1%) | 75 (35.5%) |
| 2 or 3 Rooms | 35 (8.0%) | 46 (21.8%) |
| 4 or 5 Rooms | 85 (19.4%) | 67 (31.8%) |
| 6 or 7 Rooms | 291 (66.4%) | 23 (10.9%) |
| 8 or more Rooms | 22 (5.0%) | 0 (0.0%) |
| Total | 438 (100.0%) | 211 (100.0%) |
Housing Structure by Heating Type in Sunnyside Tahoe City
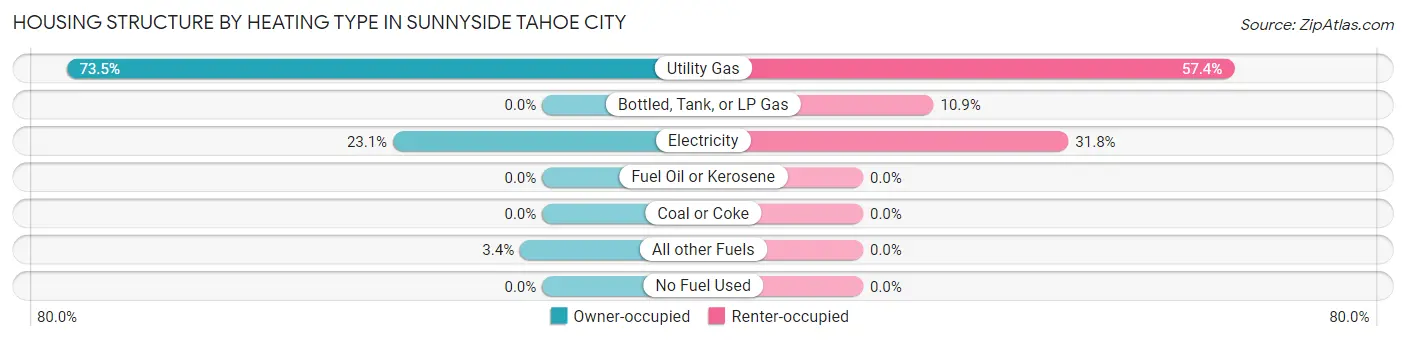
| Heating Type | Owner-occupied | Renter-occupied |
| Utility Gas | 322 (73.5%) | 121 (57.4%) |
| Bottled, Tank, or LP Gas | 0 (0.0%) | 23 (10.9%) |
| Electricity | 101 (23.1%) | 67 (31.8%) |
| Fuel Oil or Kerosene | 0 (0.0%) | 0 (0.0%) |
| Coal or Coke | 0 (0.0%) | 0 (0.0%) |
| All other Fuels | 15 (3.4%) | 0 (0.0%) |
| No Fuel Used | 0 (0.0%) | 0 (0.0%) |
| Total | 438 (100.0%) | 211 (100.0%) |
Household Vehicle Usage in Sunnyside Tahoe City
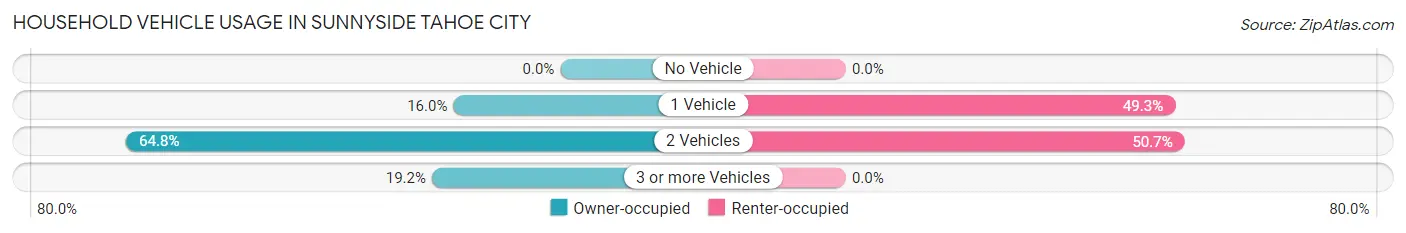
| Vehicles per Household | Owner-occupied | Renter-occupied |
| No Vehicle | 0 (0.0%) | 0 (0.0%) |
| 1 Vehicle | 70 (16.0%) | 104 (49.3%) |
| 2 Vehicles | 284 (64.8%) | 107 (50.7%) |
| 3 or more Vehicles | 84 (19.2%) | 0 (0.0%) |
| Total | 438 (100.0%) | 211 (100.0%) |
Real Estate & Mortgages in Sunnyside Tahoe City
Real Estate and Mortgage Overview in Sunnyside Tahoe City
| Characteristic | Without Mortgage | With Mortgage |
| Housing Units | 128 | 310 |
| Median Property Value | $676,500 | $1,026,900 |
| Median Household Income | $225,096 | $146 |
| Monthly Housing Costs | $982 | $150 |
| Real Estate Taxes | $7,957 | $0 |
Property Value by Mortgage Status in Sunnyside Tahoe City
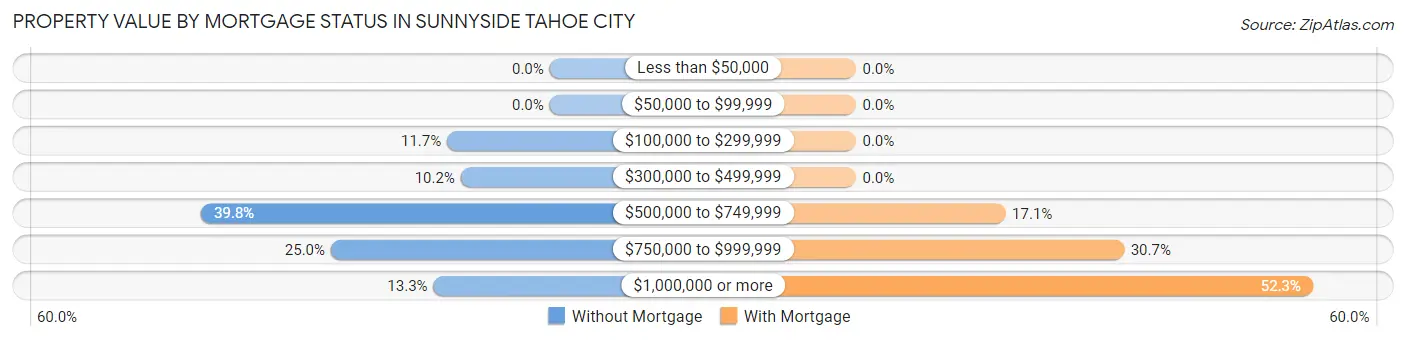
| Property Value | Without Mortgage | With Mortgage |
| Less than $50,000 | 0 (0.0%) | 0 (0.0%) |
| $50,000 to $99,999 | 0 (0.0%) | 0 (0.0%) |
| $100,000 to $299,999 | 15 (11.7%) | 0 (0.0%) |
| $300,000 to $499,999 | 13 (10.2%) | 0 (0.0%) |
| $500,000 to $749,999 | 51 (39.8%) | 53 (17.1%) |
| $750,000 to $999,999 | 32 (25.0%) | 95 (30.6%) |
| $1,000,000 or more | 17 (13.3%) | 162 (52.3%) |
| Total | 128 (100.0%) | 310 (100.0%) |
Household Income by Mortgage Status in Sunnyside Tahoe City
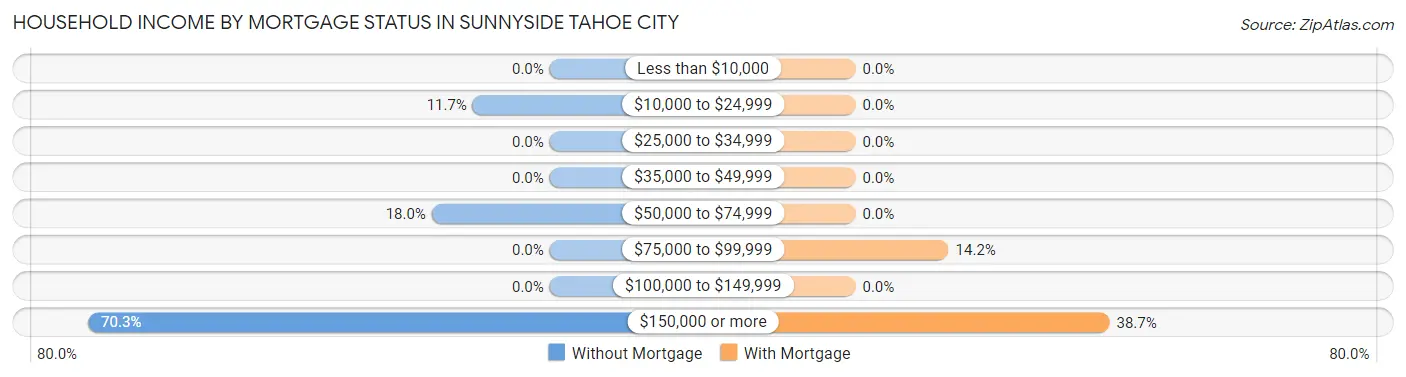
| Household Income | Without Mortgage | With Mortgage |
| Less than $10,000 | 0 (0.0%) | 0 (0.0%) |
| $10,000 to $24,999 | 15 (11.7%) | 0 (0.0%) |
| $25,000 to $34,999 | 0 (0.0%) | 0 (0.0%) |
| $35,000 to $49,999 | 0 (0.0%) | 0 (0.0%) |
| $50,000 to $74,999 | 23 (18.0%) | 0 (0.0%) |
| $75,000 to $99,999 | 0 (0.0%) | 44 (14.2%) |
| $100,000 to $149,999 | 0 (0.0%) | 0 (0.0%) |
| $150,000 or more | 90 (70.3%) | 120 (38.7%) |
| Total | 128 (100.0%) | 310 (100.0%) |
Property Value to Household Income Ratio in Sunnyside Tahoe City
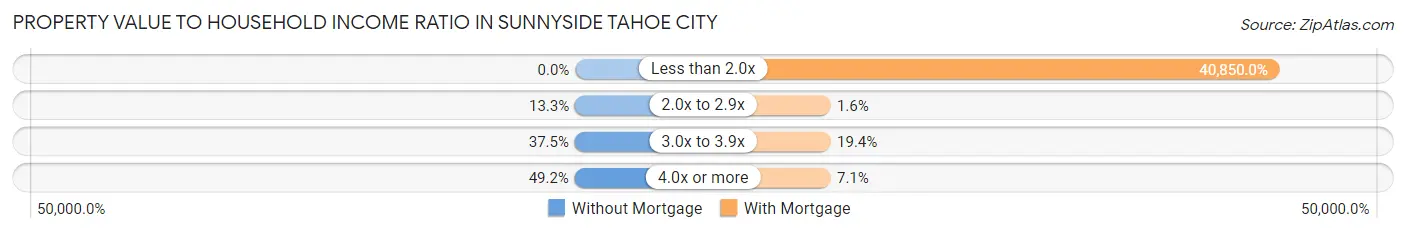
| Value-to-Income Ratio | Without Mortgage | With Mortgage |
| Less than 2.0x | 0 (0.0%) | 126,635 (40,850.0%) |
| 2.0x to 2.9x | 17 (13.3%) | 5 (1.6%) |
| 3.0x to 3.9x | 48 (37.5%) | 60 (19.4%) |
| 4.0x or more | 63 (49.2%) | 22 (7.1%) |
| Total | 128 (100.0%) | 310 (100.0%) |
Real Estate Taxes by Mortgage Status in Sunnyside Tahoe City
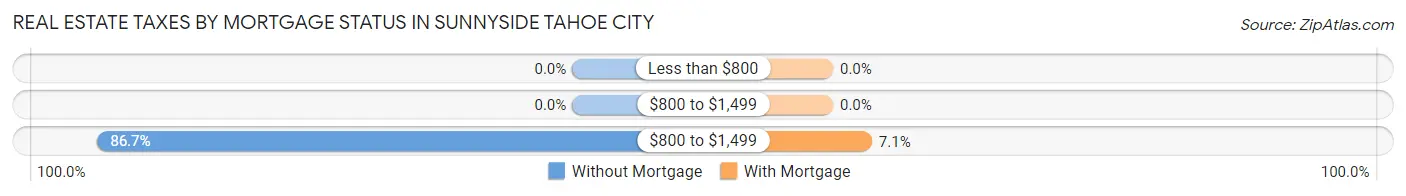
| Property Taxes | Without Mortgage | With Mortgage |
| Less than $800 | 0 (0.0%) | 0 (0.0%) |
| $800 to $1,499 | 0 (0.0%) | 0 (0.0%) |
| $800 to $1,499 | 111 (86.7%) | 22 (7.1%) |
| Total | 128 (100.0%) | 310 (100.0%) |
Health & Disability in Sunnyside Tahoe City
Health Insurance Coverage by Age in Sunnyside Tahoe City
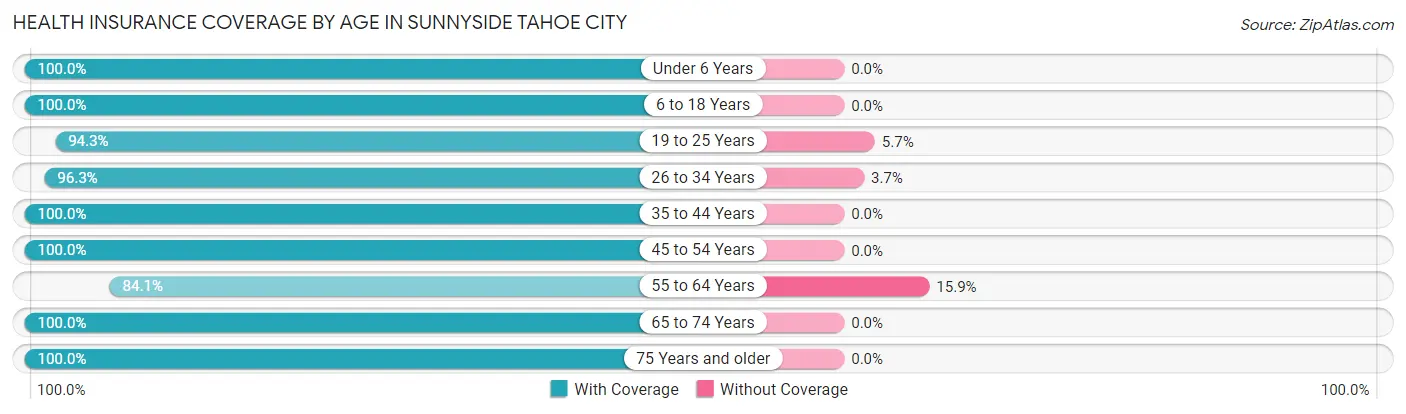
| Age Bracket | With Coverage | Without Coverage |
| Under 6 Years | 191 (100.0%) | 0 (0.0%) |
| 6 to 18 Years | 149 (100.0%) | 0 (0.0%) |
| 19 to 25 Years | 33 (94.3%) | 2 (5.7%) |
| 26 to 34 Years | 234 (96.3%) | 9 (3.7%) |
| 35 to 44 Years | 398 (100.0%) | 0 (0.0%) |
| 45 to 54 Years | 82 (100.0%) | 0 (0.0%) |
| 55 to 64 Years | 159 (84.1%) | 30 (15.9%) |
| 65 to 74 Years | 120 (100.0%) | 0 (0.0%) |
| 75 Years and older | 129 (100.0%) | 0 (0.0%) |
| Total | 1,495 (97.3%) | 41 (2.7%) |
Health Insurance Coverage by Citizenship Status in Sunnyside Tahoe City
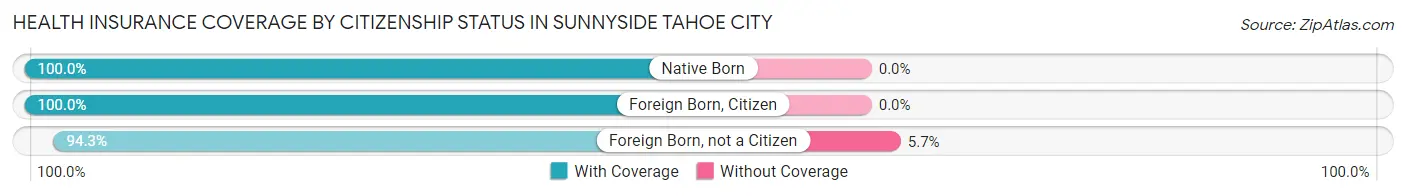
| Citizenship Status | With Coverage | Without Coverage |
| Native Born | 191 (100.0%) | 0 (0.0%) |
| Foreign Born, Citizen | 149 (100.0%) | 0 (0.0%) |
| Foreign Born, not a Citizen | 33 (94.3%) | 2 (5.7%) |
Health Insurance Coverage by Household Income in Sunnyside Tahoe City
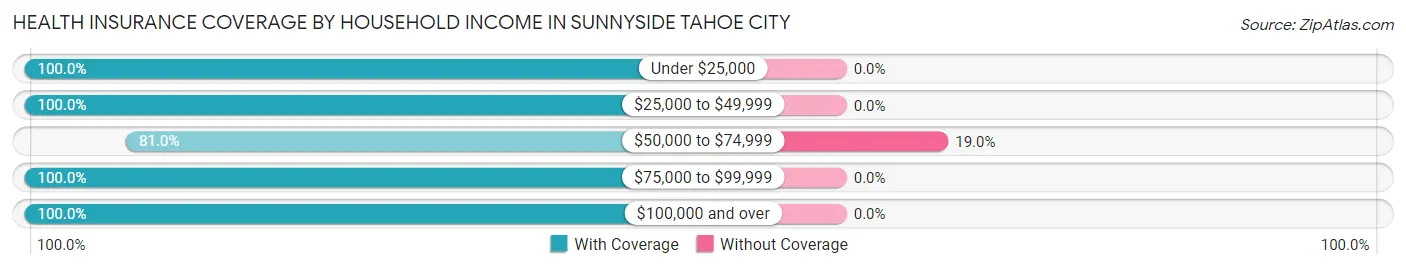
| Household Income | With Coverage | Without Coverage |
| Under $25,000 | 60 (100.0%) | 0 (0.0%) |
| $25,000 to $49,999 | 50 (100.0%) | 0 (0.0%) |
| $50,000 to $74,999 | 166 (81.0%) | 39 (19.0%) |
| $75,000 to $99,999 | 148 (100.0%) | 0 (0.0%) |
| $100,000 and over | 1,063 (100.0%) | 0 (0.0%) |
Public vs Private Health Insurance Coverage by Age in Sunnyside Tahoe City
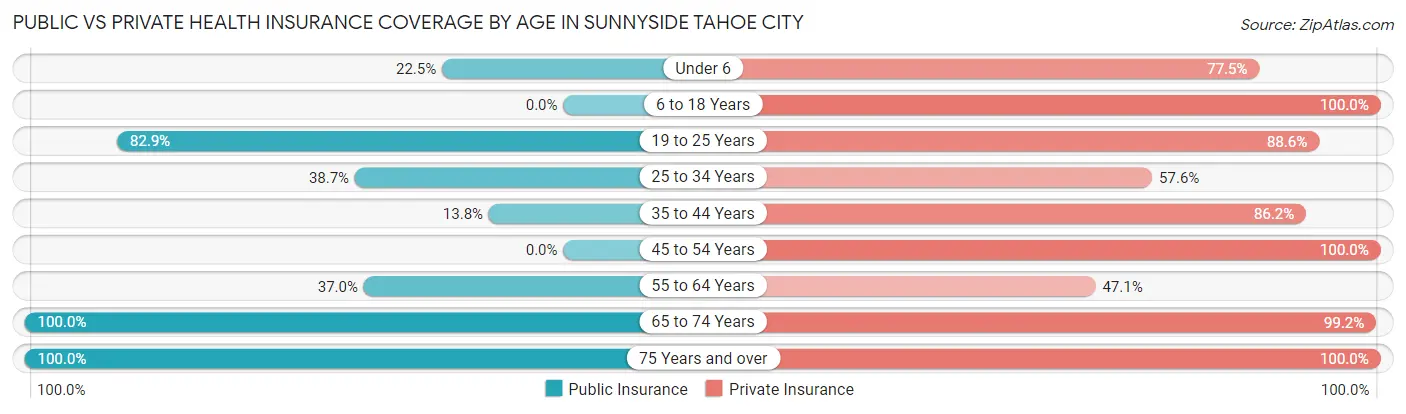
| Age Bracket | Public Insurance | Private Insurance |
| Under 6 | 43 (22.5%) | 148 (77.5%) |
| 6 to 18 Years | 0 (0.0%) | 149 (100.0%) |
| 19 to 25 Years | 29 (82.9%) | 31 (88.6%) |
| 25 to 34 Years | 94 (38.7%) | 140 (57.6%) |
| 35 to 44 Years | 55 (13.8%) | 343 (86.2%) |
| 45 to 54 Years | 0 (0.0%) | 82 (100.0%) |
| 55 to 64 Years | 70 (37.0%) | 89 (47.1%) |
| 65 to 74 Years | 120 (100.0%) | 119 (99.2%) |
| 75 Years and over | 129 (100.0%) | 129 (100.0%) |
| Total | 540 (35.2%) | 1,230 (80.1%) |
Disability Status by Sex by Age in Sunnyside Tahoe City
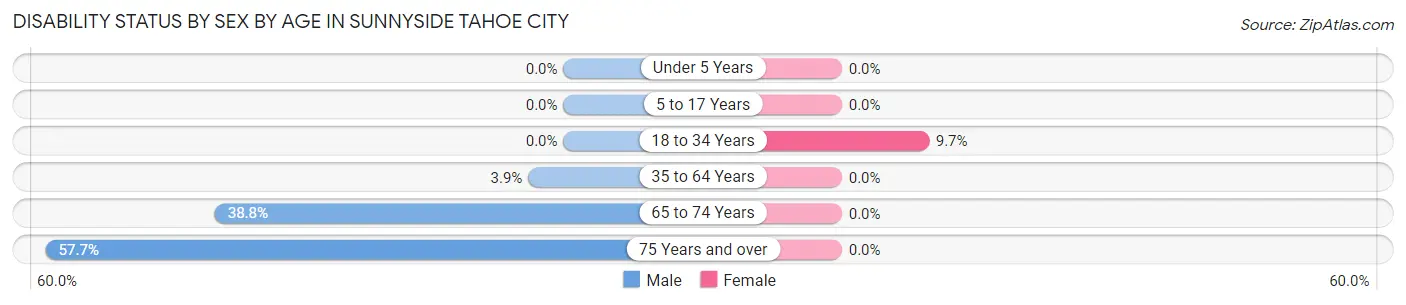
| Age Bracket | Male | Female |
| Under 5 Years | 0 (0.0%) | 0 (0.0%) |
| 5 to 17 Years | 0 (0.0%) | 0 (0.0%) |
| 18 to 34 Years | 0 (0.0%) | 19 (9.7%) |
| 35 to 64 Years | 14 (3.9%) | 0 (0.0%) |
| 65 to 74 Years | 26 (38.8%) | 0 (0.0%) |
| 75 Years and over | 49 (57.7%) | 0 (0.0%) |
Disability Class by Sex by Age in Sunnyside Tahoe City
Disability Class: Hearing Difficulty
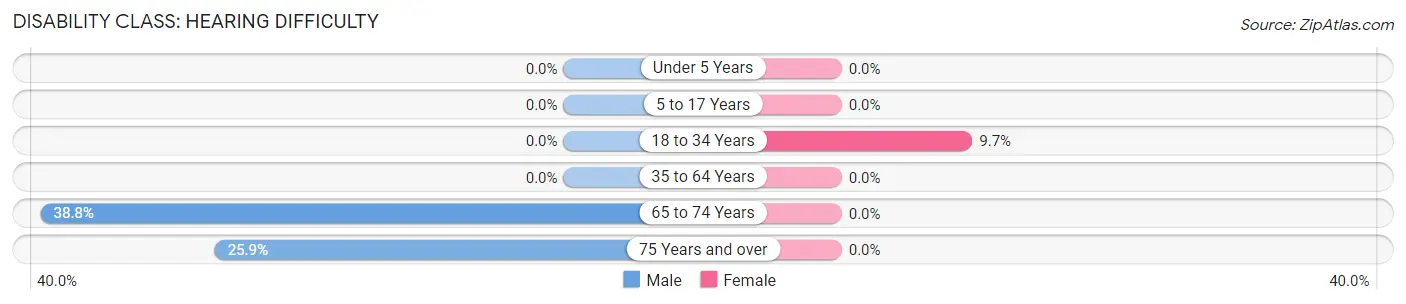
| Age Bracket | Male | Female |
| Under 5 Years | 0 (0.0%) | 0 (0.0%) |
| 5 to 17 Years | 0 (0.0%) | 0 (0.0%) |
| 18 to 34 Years | 0 (0.0%) | 19 (9.7%) |
| 35 to 64 Years | 0 (0.0%) | 0 (0.0%) |
| 65 to 74 Years | 26 (38.8%) | 0 (0.0%) |
| 75 Years and over | 22 (25.9%) | 0 (0.0%) |
Disability Class: Vision Difficulty
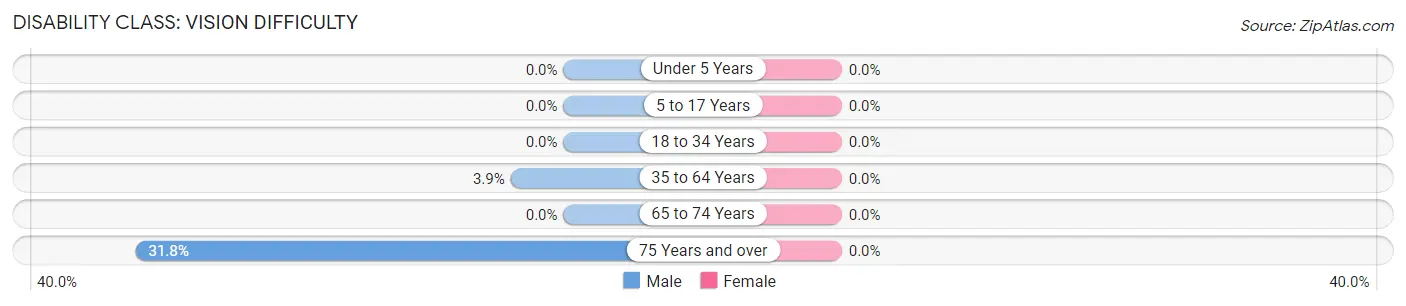
| Age Bracket | Male | Female |
| Under 5 Years | 0 (0.0%) | 0 (0.0%) |
| 5 to 17 Years | 0 (0.0%) | 0 (0.0%) |
| 18 to 34 Years | 0 (0.0%) | 0 (0.0%) |
| 35 to 64 Years | 14 (3.9%) | 0 (0.0%) |
| 65 to 74 Years | 0 (0.0%) | 0 (0.0%) |
| 75 Years and over | 27 (31.8%) | 0 (0.0%) |
Disability Class: Cognitive Difficulty
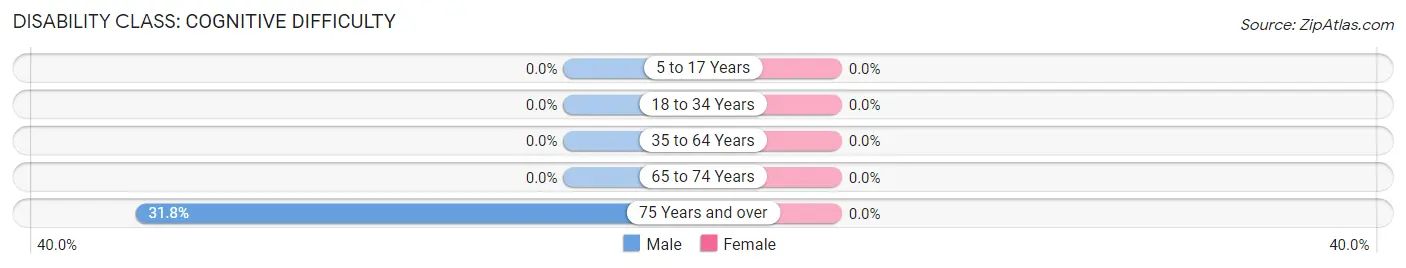
| Age Bracket | Male | Female |
| 5 to 17 Years | 0 (0.0%) | 0 (0.0%) |
| 18 to 34 Years | 0 (0.0%) | 0 (0.0%) |
| 35 to 64 Years | 0 (0.0%) | 0 (0.0%) |
| 65 to 74 Years | 0 (0.0%) | 0 (0.0%) |
| 75 Years and over | 27 (31.8%) | 0 (0.0%) |
Disability Class: Ambulatory Difficulty
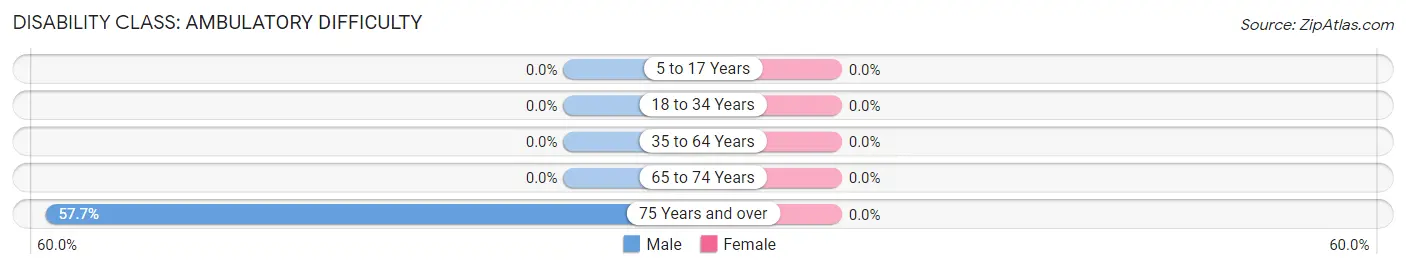
| Age Bracket | Male | Female |
| 5 to 17 Years | 0 (0.0%) | 0 (0.0%) |
| 18 to 34 Years | 0 (0.0%) | 0 (0.0%) |
| 35 to 64 Years | 0 (0.0%) | 0 (0.0%) |
| 65 to 74 Years | 0 (0.0%) | 0 (0.0%) |
| 75 Years and over | 49 (57.7%) | 0 (0.0%) |
Disability Class: Self-Care Difficulty
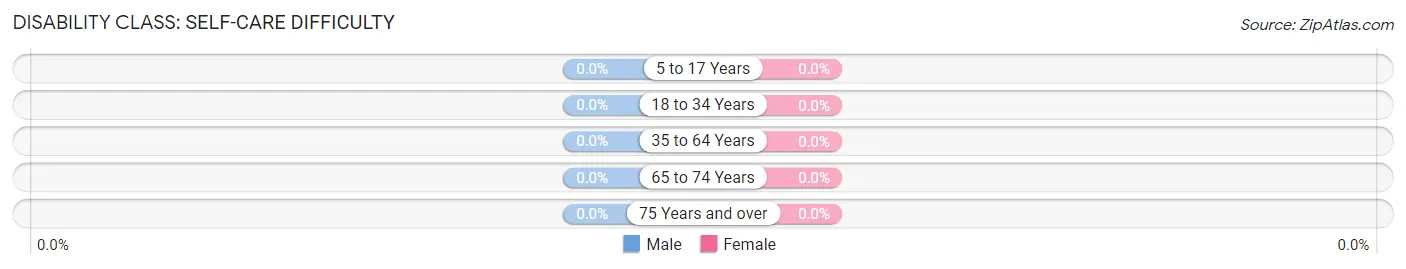
| Age Bracket | Male | Female |
| 5 to 17 Years | 0 (0.0%) | 0 (0.0%) |
| 18 to 34 Years | 0 (0.0%) | 0 (0.0%) |
| 35 to 64 Years | 0 (0.0%) | 0 (0.0%) |
| 65 to 74 Years | 0 (0.0%) | 0 (0.0%) |
| 75 Years and over | 0 (0.0%) | 0 (0.0%) |
Technology Access in Sunnyside Tahoe City
Computing Device Access in Sunnyside Tahoe City
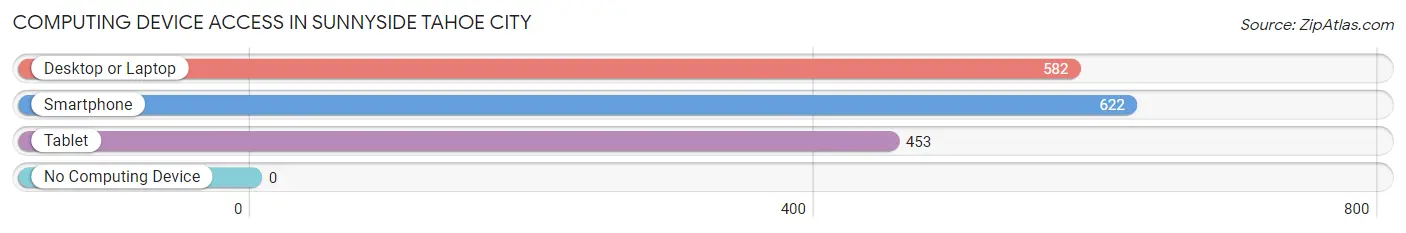
| Device Type | # Households | % Households |
| Desktop or Laptop | 582 | 89.7% |
| Smartphone | 622 | 95.8% |
| Tablet | 453 | 69.8% |
| No Computing Device | 0 | 0.0% |
| Total | 649 | 100.0% |
Internet Access in Sunnyside Tahoe City
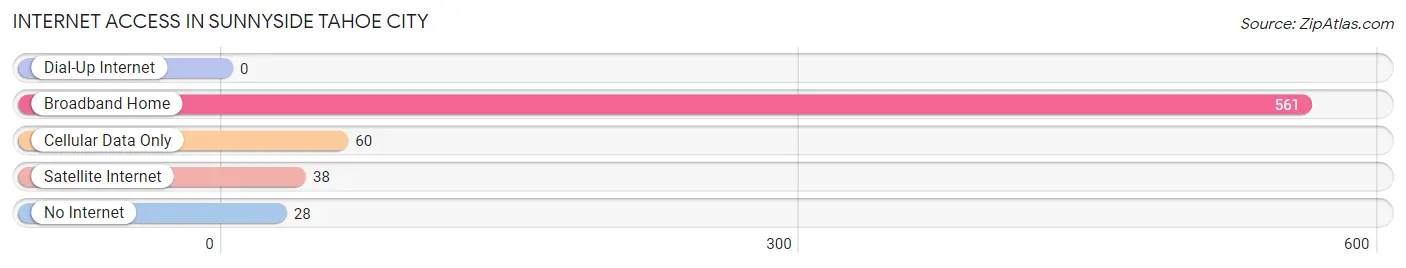
| Internet Type | # Households | % Households |
| Dial-Up Internet | 0 | 0.0% |
| Broadband Home | 561 | 86.4% |
| Cellular Data Only | 60 | 9.2% |
| Satellite Internet | 38 | 5.9% |
| No Internet | 28 | 4.3% |
| Total | 649 | 100.0% |
Sunnyside Tahoe City Summary
Sunnyside Tahoe City, CA is a small town located in the Sierra Nevada Mountains of California. It is situated on the north shore of Lake Tahoe, the largest alpine lake in North America. The town is located in Placer County and is part of the Tahoe City-Carnelian Bay-Sunnyside-Tahoe Vista census-designated place. The population of Sunnyside Tahoe City was 1,845 at the 2010 census.
History
Sunnyside Tahoe City was originally inhabited by the Washoe people, who lived in the area for thousands of years before the arrival of European settlers. The first non-native settlers arrived in the area in the late 1800s, and the town was officially founded in 1887. The town was named after the Sunnyside Hotel, which was built in 1887 and was the first hotel in the area.
The town grew rapidly in the early 1900s, and by the 1920s it had become a popular tourist destination. The town was home to several resorts, including the Sunnyside Hotel, the Tahoe Tavern, and the Tahoe Inn. The town also had a post office, a general store, and a school.
In the 1950s, the town began to decline as tourists began to flock to other parts of Lake Tahoe. The town was further impacted by the construction of the Tahoe City Dam in the 1960s, which flooded much of the town. The town was eventually incorporated in 1972, and the population has remained relatively stable since then.
Geography
Sunnyside Tahoe City is located on the north shore of Lake Tahoe, at an elevation of 6,200 feet. The town is surrounded by the Sierra Nevada Mountains, and is located approximately 10 miles west of Truckee, California. The town is located in Placer County, and is part of the Tahoe City-Carnelian Bay-Sunnyside-Tahoe Vista census-designated place.
The town is located on the Truckee River, which flows through the town and into Lake Tahoe. The town is also located near several ski resorts, including Squaw Valley, Alpine Meadows, and Northstar.
Economy
The economy of Sunnyside Tahoe City is largely based on tourism. The town is home to several resorts, including the Sunnyside Hotel, the Tahoe Tavern, and the Tahoe Inn. The town is also home to several restaurants, bars, and shops.
The town is also home to several outdoor recreation activities, including skiing, snowboarding, hiking, fishing, and boating. The town is also home to several marinas, which provide access to Lake Tahoe.
Demographics
As of the 2010 census, the population of Sunnyside Tahoe City was 1,845. The racial makeup of the town was 91.2% White, 0.7% African American, 0.3% Native American, 0.7% Asian, 0.1% Pacific Islander, 4.2% from other races, and 2.8% from two or more races. Hispanic or Latino of any race were 8.2% of the population.
The median household income in Sunnyside Tahoe City was $50,938, and the median family income was $60,938. The per capita income for the town was $30,938. About 8.2% of families and 11.2% of the population were below the poverty line, including 16.2% of those under age 18 and 4.2% of those age 65 or over.
Common Questions
What is Per Capita Income in Sunnyside Tahoe City?
Per Capita income in Sunnyside Tahoe City is $74,389.
What is the Median Family Income in Sunnyside Tahoe City?
Median Family Income in Sunnyside Tahoe City is $158,750.
What is the Median Household income in Sunnyside Tahoe City?
Median Household Income in Sunnyside Tahoe City is $125,144.
What is Inequality or Gini Index in Sunnyside Tahoe City?
Inequality or Gini Index in Sunnyside Tahoe City is 0.45.
What is the Total Population of Sunnyside Tahoe City?
Total Population of Sunnyside Tahoe City is 1,536.
What is the Total Male Population of Sunnyside Tahoe City?
Total Male Population of Sunnyside Tahoe City is 760.
What is the Total Female Population of Sunnyside Tahoe City?
Total Female Population of Sunnyside Tahoe City is 776.
What is the Ratio of Males per 100 Females in Sunnyside Tahoe City?
There are 97.94 Males per 100 Females in Sunnyside Tahoe City.
What is the Ratio of Females per 100 Males in Sunnyside Tahoe City?
There are 102.11 Females per 100 Males in Sunnyside Tahoe City.
What is the Median Population Age in Sunnyside Tahoe City?
Median Population Age in Sunnyside Tahoe City is 38.6 Years.
What is the Average Family Size in Sunnyside Tahoe City
Average Family Size in Sunnyside Tahoe City is 3.2 People.
What is the Average Household Size in Sunnyside Tahoe City
Average Household Size in Sunnyside Tahoe City is 2.4 People.
How Large is the Labor Force in Sunnyside Tahoe City?
There are 833 People in the Labor Forcein in Sunnyside Tahoe City.
What is the Percentage of People in the Labor Force in Sunnyside Tahoe City?
68.8% of People are in the Labor Force in Sunnyside Tahoe City.