Cities with the Highest Percentage of Population Employed in Real Estate, Rental & Leasing in Maryland
RELATED REPORTS & OPTIONS
Real Estate, Rental & Leasing
Maryland
Compare Cities
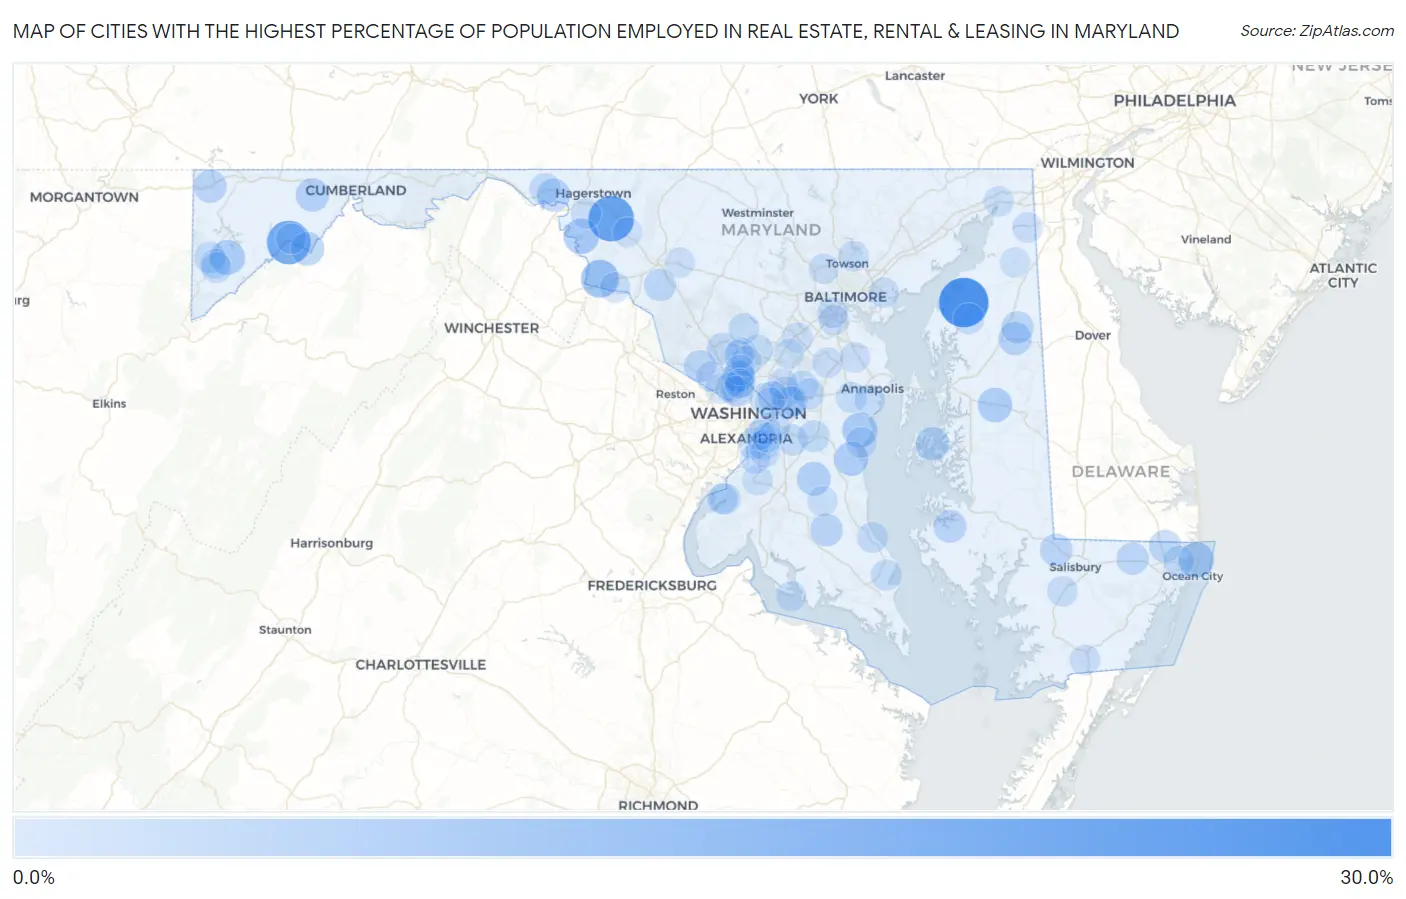
Map of Cities with the Highest Percentage of Population Employed in Real Estate, Rental & Leasing in Maryland
0.0%
30.0%
Cities with the Highest Percentage of Population Employed in Real Estate, Rental & Leasing in Maryland
| City | % Employed | vs State | vs National | |
| 1. | Worton | 29.9% | 2.1%(+27.8)#1 | 1.9%(+28.0)#67 |
| 2. | San Mar | 24.2% | 2.1%(+22.1)#2 | 1.9%(+22.3)#108 |
| 3. | Luke | 21.4% | 2.1%(+19.3)#3 | 1.9%(+19.5)#137 |
| 4. | Garretts Mill | 13.2% | 2.1%(+11.1)#4 | 1.9%(+11.3)#305 |
| 5. | Ocean City | 10.2% | 2.1%(+8.13)#5 | 1.9%(+8.33)#510 |
| 6. | Mercersville | 10.0% | 2.1%(+7.91)#6 | 1.9%(+8.11)#532 |
| 7. | Galesville | 9.5% | 2.1%(+7.44)#7 | 1.9%(+7.64)#586 |
| 8. | Deer Park | 9.3% | 2.1%(+7.24)#8 | 1.9%(+7.44)#605 |
| 9. | Queen Anne | 8.8% | 2.1%(+6.73)#9 | 1.9%(+6.93)#674 |
| 10. | Friendship | 8.2% | 2.1%(+6.11)#10 | 1.9%(+6.31)#782 |
| 11. | Baden | 7.7% | 2.1%(+5.64)#11 | 1.9%(+5.83)#875 |
| 12. | St Michaels | 7.4% | 2.1%(+5.34)#12 | 1.9%(+5.53)#947 |
| 13. | Ten Mile Creek | 7.4% | 2.1%(+5.33)#13 | 1.9%(+5.53)#948 |
| 14. | Mccoole | 7.3% | 2.1%(+5.23)#14 | 1.9%(+5.43)#964 |
| 15. | Midlothian | 7.3% | 2.1%(+5.18)#15 | 1.9%(+5.38)#975 |
| 16. | Barclay | 6.9% | 2.1%(+4.84)#16 | 1.9%(+5.04)#1,061 |
| 17. | Charlton | 6.9% | 2.1%(+4.82)#17 | 1.9%(+5.02)#1,065 |
| 18. | Friendsville | 6.7% | 2.1%(+4.58)#18 | 1.9%(+4.77)#1,121 |
| 19. | Chevy Chase View | 6.5% | 2.1%(+4.39)#19 | 1.9%(+4.58)#1,197 |
| 20. | Church Creek | 6.4% | 2.1%(+4.29)#20 | 1.9%(+4.49)#1,222 |
| 21. | Golden Beach | 6.3% | 2.1%(+4.24)#21 | 1.9%(+4.44)#1,241 |
| 22. | Hebron | 6.2% | 2.1%(+4.12)#22 | 1.9%(+4.32)#1,292 |
| 23. | Bishopville | 6.0% | 2.1%(+3.88)#23 | 1.9%(+4.07)#1,390 |
| 24. | Sudlersville | 6.0% | 2.1%(+3.86)#24 | 1.9%(+4.06)#1,399 |
| 25. | Buckeystown | 5.7% | 2.1%(+3.62)#25 | 1.9%(+3.82)#1,491 |
| 26. | Willards | 5.6% | 2.1%(+3.47)#26 | 1.9%(+3.66)#1,563 |
| 27. | Travilah | 5.5% | 2.1%(+3.41)#27 | 1.9%(+3.61)#1,594 |
| 28. | Glenarden | 5.5% | 2.1%(+3.37)#28 | 1.9%(+3.57)#1,609 |
| 29. | Derwood | 5.2% | 2.1%(+3.08)#29 | 1.9%(+3.28)#1,762 |
| 30. | Upper Marlboro | 4.7% | 2.1%(+2.65)#30 | 1.9%(+2.85)#2,030 |
| 31. | Mount Rainier | 4.7% | 2.1%(+2.63)#31 | 1.9%(+2.83)#2,045 |
| 32. | Potomac Heights | 4.7% | 2.1%(+2.60)#32 | 1.9%(+2.80)#2,065 |
| 33. | Oakland | 4.7% | 2.1%(+2.59)#33 | 1.9%(+2.79)#2,072 |
| 34. | Cedar Heights | 4.7% | 2.1%(+2.58)#34 | 1.9%(+2.77)#2,085 |
| 35. | National Harbor | 4.7% | 2.1%(+2.56)#35 | 1.9%(+2.76)#2,093 |
| 36. | Clear Spring | 4.5% | 2.1%(+2.43)#36 | 1.9%(+2.63)#2,191 |
| 37. | North Chevy Chase | 4.5% | 2.1%(+2.41)#37 | 1.9%(+2.61)#2,209 |
| 38. | New Carrollton | 4.4% | 2.1%(+2.31)#38 | 1.9%(+2.51)#2,288 |
| 39. | Chestertown | 4.3% | 2.1%(+2.26)#39 | 1.9%(+2.46)#2,325 |
| 40. | Riva | 4.2% | 2.1%(+2.15)#40 | 1.9%(+2.35)#2,415 |
| 41. | Melwood | 4.2% | 2.1%(+2.15)#41 | 1.9%(+2.34)#2,418 |
| 42. | Cloverly | 4.2% | 2.1%(+2.08)#42 | 1.9%(+2.28)#2,470 |
| 43. | Loch Lynn Heights | 4.1% | 2.1%(+2.01)#43 | 1.9%(+2.21)#2,559 |
| 44. | Drum Point | 4.1% | 2.1%(+2.00)#44 | 1.9%(+2.20)#2,563 |
| 45. | Ocean Pines | 4.1% | 2.1%(+1.98)#45 | 1.9%(+2.18)#2,585 |
| 46. | Glenn Dale | 4.1% | 2.1%(+1.97)#46 | 1.9%(+2.17)#2,593 |
| 47. | Brookeville | 4.0% | 2.1%(+1.95)#47 | 1.9%(+2.15)#2,624 |
| 48. | Fairwood | 4.0% | 2.1%(+1.91)#48 | 1.9%(+2.11)#2,663 |
| 49. | St Leonard | 4.0% | 2.1%(+1.90)#49 | 1.9%(+2.10)#2,672 |
| 50. | Chevy Chase Village | 3.9% | 2.1%(+1.80)#50 | 1.9%(+2.00)#2,777 |
| 51. | Indian Head | 3.8% | 2.1%(+1.71)#51 | 1.9%(+1.91)#2,879 |
| 52. | South Kensington | 3.7% | 2.1%(+1.64)#52 | 1.9%(+1.84)#2,964 |
| 53. | Brunswick | 3.7% | 2.1%(+1.63)#53 | 1.9%(+1.82)#2,988 |
| 54. | Deale | 3.7% | 2.1%(+1.56)#54 | 1.9%(+1.76)#3,081 |
| 55. | Glenmont | 3.6% | 2.1%(+1.56)#55 | 1.9%(+1.76)#3,089 |
| 56. | Eden | 3.6% | 2.1%(+1.55)#56 | 1.9%(+1.74)#3,107 |
| 57. | Annapolis Neck | 3.6% | 2.1%(+1.47)#57 | 1.9%(+1.66)#3,218 |
| 58. | Lansdowne | 3.5% | 2.1%(+1.45)#58 | 1.9%(+1.65)#3,231 |
| 59. | Greenbelt | 3.5% | 2.1%(+1.43)#59 | 1.9%(+1.63)#3,261 |
| 60. | Hampton | 3.5% | 2.1%(+1.42)#60 | 1.9%(+1.62)#3,279 |
| 61. | Hillcrest Heights | 3.5% | 2.1%(+1.40)#61 | 1.9%(+1.60)#3,301 |
| 62. | Accokeek | 3.5% | 2.1%(+1.37)#62 | 1.9%(+1.57)#3,340 |
| 63. | Savage | 3.5% | 2.1%(+1.37)#63 | 1.9%(+1.57)#3,341 |
| 64. | Odenton | 3.4% | 2.1%(+1.35)#64 | 1.9%(+1.55)#3,367 |
| 65. | Linthicum | 3.4% | 2.1%(+1.34)#65 | 1.9%(+1.53)#3,382 |
| 66. | Chesapeake City | 3.4% | 2.1%(+1.26)#66 | 1.9%(+1.46)#3,493 |
| 67. | Oxon Hill | 3.3% | 2.1%(+1.23)#67 | 1.9%(+1.43)#3,551 |
| 68. | Woodlawn Cdp Prince George S County | 3.3% | 2.1%(+1.22)#68 | 1.9%(+1.42)#3,568 |
| 69. | Essex | 3.3% | 2.1%(+1.16)#69 | 1.9%(+1.36)#3,681 |
| 70. | Springdale | 3.2% | 2.1%(+1.16)#70 | 1.9%(+1.35)#3,692 |
| 71. | Westernport | 3.2% | 2.1%(+1.15)#71 | 1.9%(+1.35)#3,698 |
| 72. | Fort Washington | 3.2% | 2.1%(+1.14)#72 | 1.9%(+1.34)#3,709 |
| 73. | Pocomoke City | 3.2% | 2.1%(+1.14)#73 | 1.9%(+1.34)#3,714 |
| 74. | Potomac | 3.2% | 2.1%(+1.13)#74 | 1.9%(+1.33)#3,727 |
| 75. | St James | 3.2% | 2.1%(+1.13)#75 | 1.9%(+1.33)#3,743 |
| 76. | Suitland | 3.2% | 2.1%(+1.08)#76 | 1.9%(+1.28)#3,805 |
| 77. | Cobb Island | 3.2% | 2.1%(+1.08)#77 | 1.9%(+1.28)#3,818 |
| 78. | Wildewood | 3.2% | 2.1%(+1.07)#78 | 1.9%(+1.27)#3,838 |
| 79. | Aquasco | 3.2% | 2.1%(+1.06)#79 | 1.9%(+1.26)#3,843 |
| 80. | Pikesville | 3.1% | 2.1%(+1.05)#80 | 1.9%(+1.25)#3,859 |
| 81. | North East | 3.1% | 2.1%(+1.05)#81 | 1.9%(+1.25)#3,866 |
| 82. | Edmonston | 3.1% | 2.1%(+1.05)#82 | 1.9%(+1.25)#3,867 |
| 83. | Severna Park | 3.1% | 2.1%(+0.996)#83 | 1.9%(+1.19)#3,957 |
| 84. | Leisure World | 3.1% | 2.1%(+0.975)#84 | 1.9%(+1.17)#3,990 |
| 85. | Glassmanor | 3.1% | 2.1%(+0.970)#85 | 1.9%(+1.17)#4,000 |
| 86. | Aspen Hill | 3.0% | 2.1%(+0.951)#86 | 1.9%(+1.15)#4,046 |
| 87. | Friendly | 3.0% | 2.1%(+0.919)#87 | 1.9%(+1.12)#4,102 |
| 88. | Spring Ridge | 3.0% | 2.1%(+0.917)#88 | 1.9%(+1.12)#4,108 |
| 89. | Cabin John | 3.0% | 2.1%(+0.895)#89 | 1.9%(+1.09)#4,146 |
| 90. | North Kensington | 3.0% | 2.1%(+0.892)#90 | 1.9%(+1.09)#4,157 |
| 91. | Bethesda | 3.0% | 2.1%(+0.886)#91 | 1.9%(+1.08)#4,163 |
| 92. | Somerset | 3.0% | 2.1%(+0.880)#92 | 1.9%(+1.08)#4,172 |
| 93. | Chevy Chase | 3.0% | 2.1%(+0.873)#93 | 1.9%(+1.07)#4,198 |
| 94. | Colmar Manor | 2.9% | 2.1%(+0.816)#94 | 1.9%(+1.01)#4,308 |
| 95. | Mountain Lake Park | 2.9% | 2.1%(+0.813)#95 | 1.9%(+1.01)#4,312 |
| 96. | Laurel | 2.9% | 2.1%(+0.810)#96 | 1.9%(+1.01)#4,315 |
| 97. | Cecilton | 2.9% | 2.1%(+0.805)#97 | 1.9%(+1.00)#4,328 |
| 98. | Burnt Mills | 2.9% | 2.1%(+0.795)#98 | 1.9%(+0.993)#4,348 |
| 99. | Temple Hills | 2.9% | 2.1%(+0.781)#99 | 1.9%(+0.979)#4,383 |
| 100. | Myersville | 2.9% | 2.1%(+0.765)#100 | 1.9%(+0.963)#4,418 |
Common Questions
What are the Top 10 Cities with the Highest Percentage of Population Employed in Real Estate, Rental & Leasing in Maryland?
Top 10 Cities with the Highest Percentage of Population Employed in Real Estate, Rental & Leasing in Maryland are:
#1
29.9%
#2
24.2%
#3
21.4%
#4
13.2%
#5
10.2%
#6
10.0%
#7
9.5%
#8
9.3%
#9
8.8%
#10
8.2%
What city has the Highest Percentage of Population Employed in Real Estate, Rental & Leasing in Maryland?
Worton has the Highest Percentage of Population Employed in Real Estate, Rental & Leasing in Maryland with 29.9%.
What is the Percentage of Population Employed in Real Estate, Rental & Leasing in the State of Maryland?
Percentage of Population Employed in Real Estate, Rental & Leasing in Maryland is 2.1%.
What is the Percentage of Population Employed in Real Estate, Rental & Leasing in the United States?
Percentage of Population Employed in Real Estate, Rental & Leasing in the United States is 1.9%.