Cities with the Highest Percentage of Population Employed in Real Estate, Rental & Leasing in Massachusetts
RELATED REPORTS & OPTIONS
Real Estate, Rental & Leasing
Massachusetts
Compare Cities
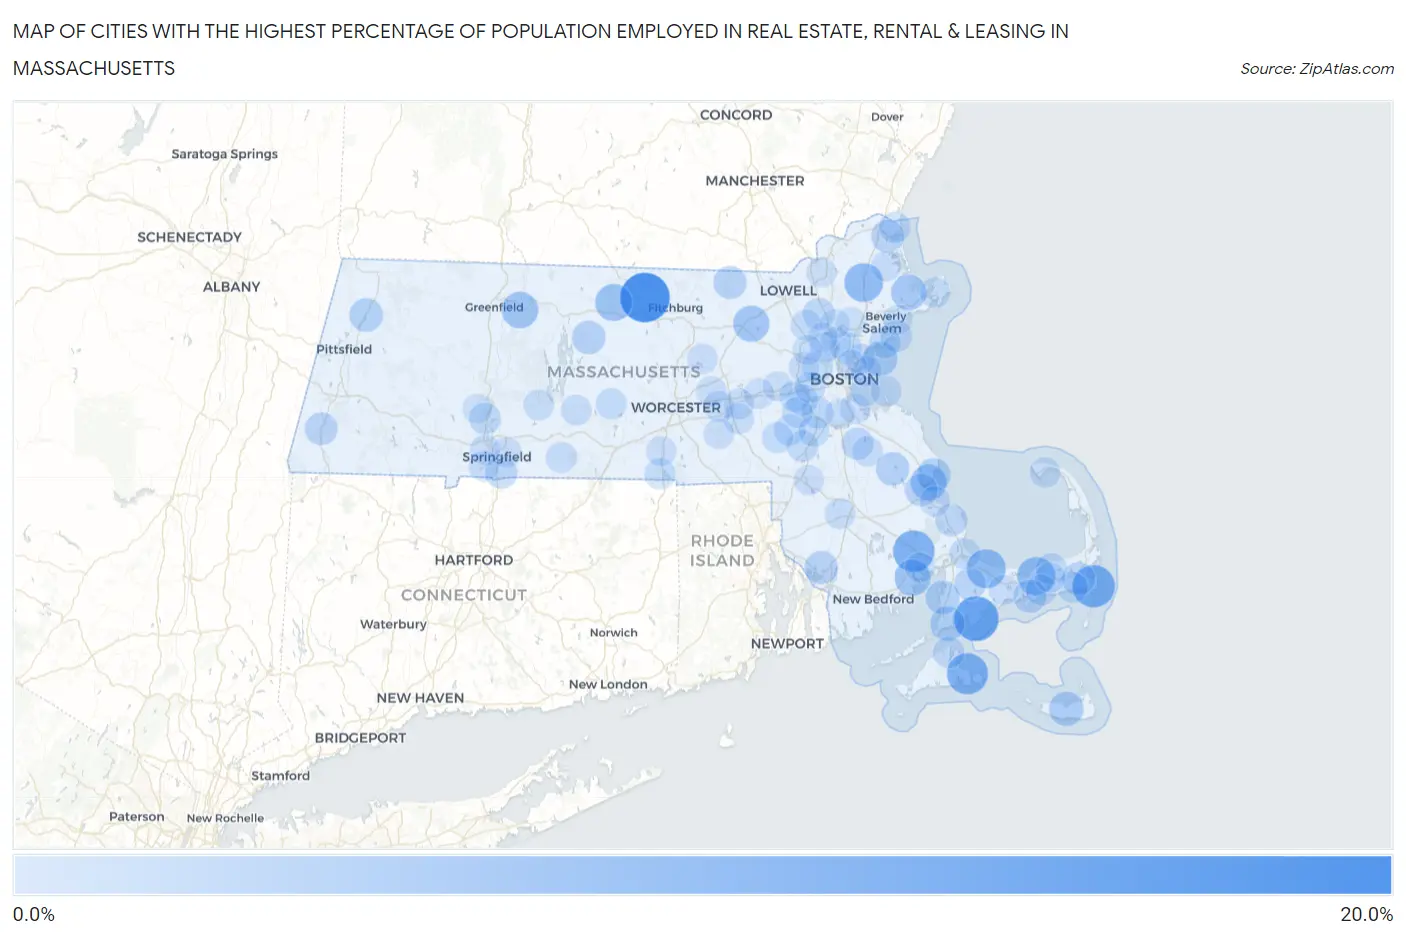
Map of Cities with the Highest Percentage of Population Employed in Real Estate, Rental & Leasing in Massachusetts
0.0%
20.0%
Cities with the Highest Percentage of Population Employed in Real Estate, Rental & Leasing in Massachusetts
| City | % Employed | vs State | vs National | |
| 1. | South Ashburnham | 16.1% | 1.7%(+14.5)#1 | 1.9%(+14.2)#216 |
| 2. | New Seabury | 12.4% | 1.7%(+10.8)#2 | 1.9%(+10.6)#348 |
| 3. | Chatham | 10.7% | 1.7%(+9.04)#3 | 1.9%(+8.81)#473 |
| 4. | West Wareham | 10.1% | 1.7%(+8.45)#4 | 1.9%(+8.22)#521 |
| 5. | Edgartown | 9.8% | 1.7%(+8.14)#5 | 1.9%(+7.91)#558 |
| 6. | East Sandwich | 8.1% | 1.7%(+6.49)#6 | 1.9%(+6.26)#794 |
| 7. | Boxford | 8.0% | 1.7%(+6.30)#7 | 1.9%(+6.07)#834 |
| 8. | Yarmouth Port | 7.7% | 1.7%(+6.00)#8 | 1.9%(+5.76)#892 |
| 9. | Baldwinville | 6.6% | 1.7%(+4.99)#9 | 1.9%(+4.76)#1,135 |
| 10. | Millers Falls | 6.3% | 1.7%(+4.68)#10 | 1.9%(+4.45)#1,237 |
| 11. | Marion Center | 6.2% | 1.7%(+4.53)#11 | 1.9%(+4.29)#1,301 |
| 12. | Littleton Common | 6.0% | 1.7%(+4.37)#12 | 1.9%(+4.14)#1,362 |
| 13. | South Duxbury | 6.0% | 1.7%(+4.31)#13 | 1.9%(+4.07)#1,389 |
| 14. | Essex | 5.5% | 1.7%(+3.81)#14 | 1.9%(+3.58)#1,605 |
| 15. | Nahant | 5.0% | 1.7%(+3.32)#15 | 1.9%(+3.09)#1,873 |
| 16. | Nantucket | 4.8% | 1.7%(+3.15)#16 | 1.9%(+2.92)#1,988 |
| 17. | Falmouth | 4.7% | 1.7%(+3.08)#17 | 1.9%(+2.85)#2,032 |
| 18. | North Falmouth | 4.4% | 1.7%(+2.74)#18 | 1.9%(+2.51)#2,290 |
| 19. | Cheshire | 4.2% | 1.7%(+2.58)#19 | 1.9%(+2.35)#2,413 |
| 20. | Duxbury | 4.2% | 1.7%(+2.55)#20 | 1.9%(+2.32)#2,435 |
| 21. | Petersham | 4.1% | 1.7%(+2.48)#21 | 1.9%(+2.25)#2,506 |
| 22. | Hanson | 4.0% | 1.7%(+2.33)#22 | 1.9%(+2.10)#2,669 |
| 23. | West Yarmouth | 3.9% | 1.7%(+2.22)#23 | 1.9%(+1.99)#2,800 |
| 24. | Somerset | 3.9% | 1.7%(+2.20)#24 | 1.9%(+1.96)#2,822 |
| 25. | East Harwich | 3.8% | 1.7%(+2.13)#25 | 1.9%(+1.90)#2,896 |
| 26. | East Pepperell | 3.7% | 1.7%(+2.06)#26 | 1.9%(+1.83)#2,985 |
| 27. | Great Barrington | 3.6% | 1.7%(+1.99)#27 | 1.9%(+1.76)#3,086 |
| 28. | Newburyport | 3.6% | 1.7%(+1.91)#28 | 1.9%(+1.67)#3,207 |
| 29. | Kingston | 3.5% | 1.7%(+1.89)#29 | 1.9%(+1.65)#3,229 |
| 30. | Longmeadow | 3.1% | 1.7%(+1.48)#30 | 1.9%(+1.25)#3,868 |
| 31. | The Pinehills | 3.1% | 1.7%(+1.47)#31 | 1.9%(+1.24)#3,890 |
| 32. | Forestdale | 3.1% | 1.7%(+1.41)#32 | 1.9%(+1.18)#3,982 |
| 33. | Holbrook | 3.1% | 1.7%(+1.40)#33 | 1.9%(+1.17)#3,991 |
| 34. | Wilmington | 2.9% | 1.7%(+1.24)#34 | 1.9%(+1.01)#4,318 |
| 35. | Dedham | 2.9% | 1.7%(+1.20)#35 | 1.9%(+0.964)#4,415 |
| 36. | Vineyard Haven | 2.8% | 1.7%(+1.14)#36 | 1.9%(+0.905)#4,553 |
| 37. | Marblehead | 2.8% | 1.7%(+1.10)#37 | 1.9%(+0.871)#4,618 |
| 38. | Holyoke | 2.8% | 1.7%(+1.10)#38 | 1.9%(+0.867)#4,636 |
| 39. | Swampscott | 2.7% | 1.7%(+1.03)#39 | 1.9%(+0.795)#4,816 |
| 40. | East Dennis | 2.7% | 1.7%(+0.995)#40 | 1.9%(+0.763)#4,913 |
| 41. | Salisbury | 2.6% | 1.7%(+0.940)#41 | 1.9%(+0.708)#5,064 |
| 42. | Needham | 2.6% | 1.7%(+0.923)#42 | 1.9%(+0.691)#5,108 |
| 43. | Belmont | 2.6% | 1.7%(+0.919)#43 | 1.9%(+0.687)#5,129 |
| 44. | Walpole | 2.5% | 1.7%(+0.864)#44 | 1.9%(+0.631)#5,281 |
| 45. | Medfield | 2.5% | 1.7%(+0.816)#45 | 1.9%(+0.584)#5,400 |
| 46. | Wellesley | 2.5% | 1.7%(+0.813)#46 | 1.9%(+0.581)#5,411 |
| 47. | Pinehurst | 2.4% | 1.7%(+0.777)#47 | 1.9%(+0.544)#5,535 |
| 48. | North Brookfield | 2.4% | 1.7%(+0.737)#48 | 1.9%(+0.505)#5,652 |
| 49. | Harwich Port | 2.4% | 1.7%(+0.731)#49 | 1.9%(+0.498)#5,674 |
| 50. | Millis Clicquot | 2.4% | 1.7%(+0.723)#50 | 1.9%(+0.491)#5,693 |
| 51. | Norwood | 2.4% | 1.7%(+0.711)#51 | 1.9%(+0.479)#5,745 |
| 52. | Sagamore | 2.4% | 1.7%(+0.708)#52 | 1.9%(+0.475)#5,758 |
| 53. | South Yarmouth | 2.3% | 1.7%(+0.672)#53 | 1.9%(+0.440)#5,864 |
| 54. | Melrose | 2.3% | 1.7%(+0.643)#54 | 1.9%(+0.411)#5,957 |
| 55. | Webster | 2.3% | 1.7%(+0.621)#55 | 1.9%(+0.389)#6,020 |
| 56. | Cedar Crest | 2.2% | 1.7%(+0.584)#56 | 1.9%(+0.351)#6,174 |
| 57. | Westborough | 2.2% | 1.7%(+0.532)#57 | 1.9%(+0.300)#6,346 |
| 58. | Monson Center | 2.2% | 1.7%(+0.529)#58 | 1.9%(+0.297)#6,355 |
| 59. | Dover | 2.2% | 1.7%(+0.527)#59 | 1.9%(+0.295)#6,367 |
| 60. | Revere | 2.1% | 1.7%(+0.480)#60 | 1.9%(+0.248)#6,537 |
| 61. | Stoneham | 2.1% | 1.7%(+0.463)#61 | 1.9%(+0.231)#6,602 |
| 62. | Gloucester | 2.1% | 1.7%(+0.446)#62 | 1.9%(+0.214)#6,645 |
| 63. | Provincetown | 2.1% | 1.7%(+0.427)#63 | 1.9%(+0.195)#6,719 |
| 64. | Winthrop Town | 2.1% | 1.7%(+0.410)#64 | 1.9%(+0.178)#6,773 |
| 65. | Ware | 2.1% | 1.7%(+0.400)#65 | 1.9%(+0.168)#6,818 |
| 66. | Taunton | 2.1% | 1.7%(+0.400)#66 | 1.9%(+0.167)#6,821 |
| 67. | Belchertown | 2.0% | 1.7%(+0.368)#67 | 1.9%(+0.136)#6,932 |
| 68. | Cordaville | 2.0% | 1.7%(+0.367)#68 | 1.9%(+0.135)#6,936 |
| 69. | Hopkinton | 2.0% | 1.7%(+0.362)#69 | 1.9%(+0.130)#6,956 |
| 70. | Hull | 2.0% | 1.7%(+0.360)#70 | 1.9%(+0.128)#6,963 |
| 71. | Newton | 2.0% | 1.7%(+0.360)#71 | 1.9%(+0.128)#6,967 |
| 72. | Upton | 2.0% | 1.7%(+0.354)#72 | 1.9%(+0.122)#6,988 |
| 73. | Waltham | 2.0% | 1.7%(+0.354)#73 | 1.9%(+0.122)#6,989 |
| 74. | Chelsea | 2.0% | 1.7%(+0.327)#74 | 1.9%(+0.095)#7,107 |
| 75. | Quincy | 2.0% | 1.7%(+0.317)#75 | 1.9%(+0.085)#7,156 |
| 76. | Abington | 2.0% | 1.7%(+0.311)#76 | 1.9%(+0.079)#7,184 |
| 77. | Plymouth | 2.0% | 1.7%(+0.309)#77 | 1.9%(+0.077)#7,189 |
| 78. | Winchester | 2.0% | 1.7%(+0.308)#78 | 1.9%(+0.076)#7,193 |
| 79. | Framingham | 2.0% | 1.7%(+0.295)#79 | 1.9%(+0.063)#7,244 |
| 80. | Springfield | 1.9% | 1.7%(+0.288)#80 | 1.9%(+0.055)#7,268 |
| 81. | Clinton | 1.9% | 1.7%(+0.271)#81 | 1.9%(+0.039)#7,330 |
| 82. | Agawam Town | 1.9% | 1.7%(+0.222)#82 | 1.9%(-0.010)#7,521 |
| 83. | Rowley | 1.9% | 1.7%(+0.207)#83 | 1.9%(-0.025)#7,579 |
| 84. | Northborough | 1.9% | 1.7%(+0.198)#84 | 1.9%(-0.034)#7,614 |
| 85. | West Springfield Town | 1.9% | 1.7%(+0.195)#85 | 1.9%(-0.037)#7,620 |
| 86. | Milton | 1.9% | 1.7%(+0.195)#86 | 1.9%(-0.037)#7,623 |
| 87. | Mansfield Center | 1.8% | 1.7%(+0.185)#87 | 1.9%(-0.047)#7,657 |
| 88. | South Dennis | 1.8% | 1.7%(+0.184)#88 | 1.9%(-0.048)#7,659 |
| 89. | Boston | 1.8% | 1.7%(+0.164)#89 | 1.9%(-0.068)#7,742 |
| 90. | Barnstable Town | 1.8% | 1.7%(+0.163)#90 | 1.9%(-0.069)#7,751 |
| 91. | Oxford | 1.8% | 1.7%(+0.157)#91 | 1.9%(-0.075)#7,783 |
| 92. | Lynnfield | 1.7% | 1.7%(+0.071)#92 | 1.9%(-0.161)#8,146 |
| 93. | Woburn | 1.7% | 1.7%(+0.053)#93 | 1.9%(-0.180)#8,216 |
| 94. | Lexington | 1.7% | 1.7%(+0.035)#94 | 1.9%(-0.198)#8,317 |
| 95. | Lawrence | 1.7% | 1.7%(+0.034)#95 | 1.9%(-0.198)#8,318 |
| 96. | Weweantic | 1.7% | 1.7%(+0.031)#96 | 1.9%(-0.201)#8,333 |
| 97. | Beverly | 1.7% | 1.7%(+0.029)#97 | 1.9%(-0.203)#8,343 |
| 98. | Reading | 1.7% | 1.7%(+0.023)#98 | 1.9%(-0.209)#8,376 |
| 99. | Easthampton Town | 1.7% | 1.7%(-0.003)#99 | 1.9%(-0.235)#8,501 |
| 100. | Cochituate | 1.7% | 1.7%(-0.003)#100 | 1.9%(-0.235)#8,502 |
Common Questions
What are the Top 10 Cities with the Highest Percentage of Population Employed in Real Estate, Rental & Leasing in Massachusetts?
Top 10 Cities with the Highest Percentage of Population Employed in Real Estate, Rental & Leasing in Massachusetts are:
#1
16.1%
#2
12.4%
#3
10.7%
#4
10.1%
#5
9.8%
#6
8.1%
#7
8.0%
#8
7.7%
#9
6.6%
#10
6.3%
What city has the Highest Percentage of Population Employed in Real Estate, Rental & Leasing in Massachusetts?
South Ashburnham has the Highest Percentage of Population Employed in Real Estate, Rental & Leasing in Massachusetts with 16.1%.
What is the Percentage of Population Employed in Real Estate, Rental & Leasing in the State of Massachusetts?
Percentage of Population Employed in Real Estate, Rental & Leasing in Massachusetts is 1.7%.
What is the Percentage of Population Employed in Real Estate, Rental & Leasing in the United States?
Percentage of Population Employed in Real Estate, Rental & Leasing in the United States is 1.9%.