Zip Codes with the Highest Percentage of Population Employed in Real Estate, Rental & Leasing in San Francisco, CA
RELATED REPORTS & OPTIONS
Real Estate, Rental & Leasing
San Francisco
Compare Zip Codes
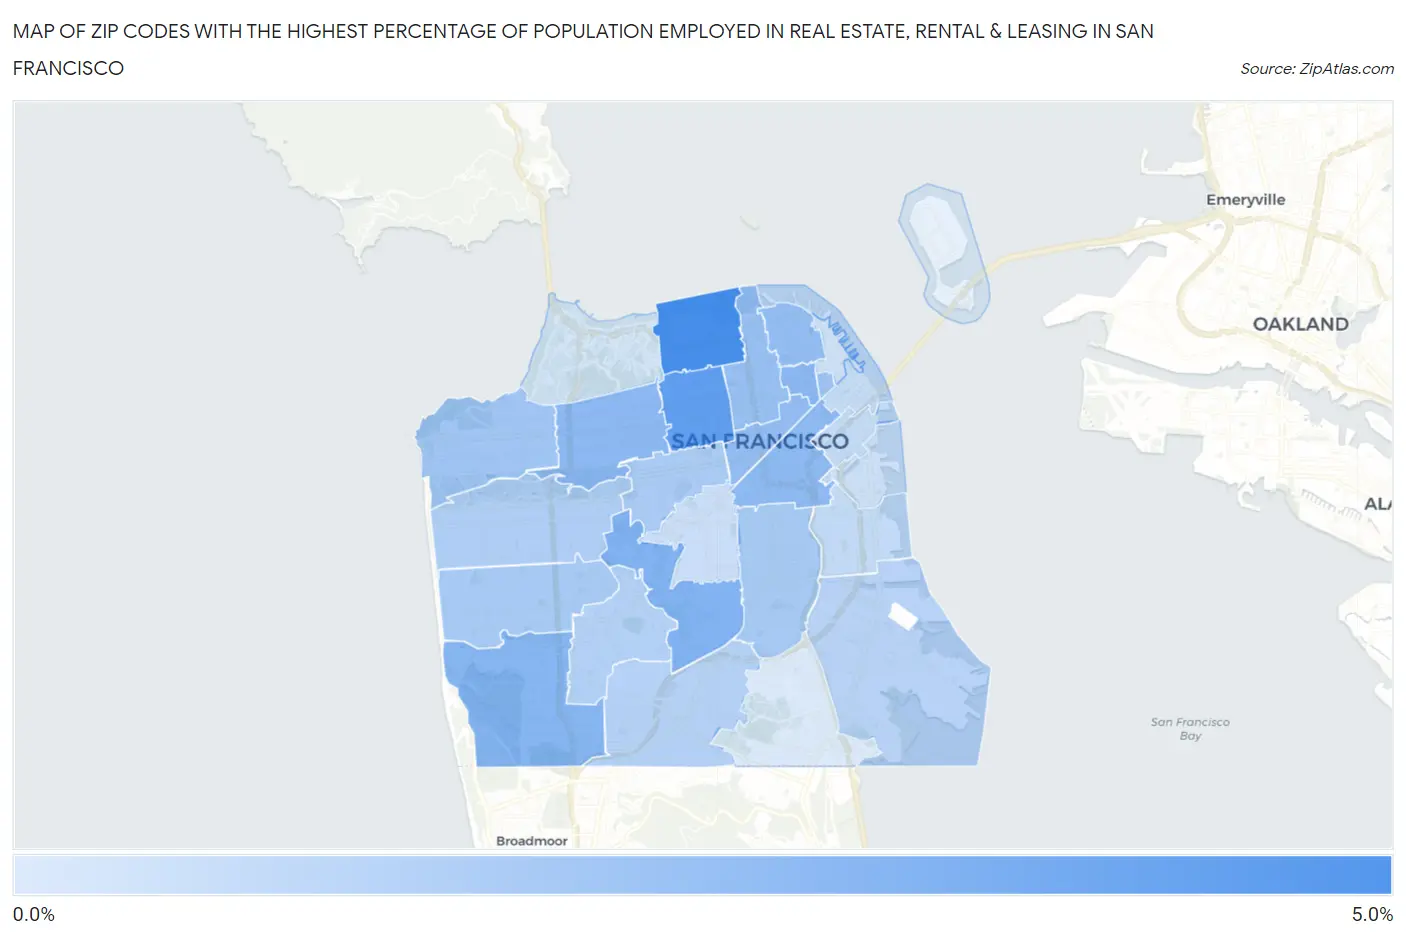
Map of Zip Codes with the Highest Percentage of Population Employed in Real Estate, Rental & Leasing in San Francisco
0.88%
4.9%
Zip Codes with the Highest Percentage of Population Employed in Real Estate, Rental & Leasing in San Francisco, CA
| Zip Code | % Employed | vs State | vs National | |
| 1. | 94123 | 4.9% | 2.1%(+2.82)#125 | 1.9%(+3.05)#1,429 |
| 2. | 94115 | 4.2% | 2.1%(+2.11)#166 | 1.9%(+2.34)#1,930 |
| 3. | 94131 | 3.4% | 2.1%(+1.25)#285 | 1.9%(+1.48)#3,086 |
| 4. | 94132 | 3.2% | 2.1%(+1.08)#317 | 1.9%(+1.31)#3,416 |
| 5. | 94108 | 3.1% | 2.1%(+0.995)#336 | 1.9%(+1.22)#3,594 |
| 6. | 94118 | 3.0% | 2.1%(+0.906)#356 | 1.9%(+1.13)#3,818 |
| 7. | 94103 | 3.0% | 2.1%(+0.833)#374 | 1.9%(+1.06)#4,030 |
| 8. | 94102 | 2.9% | 2.1%(+0.758)#386 | 1.9%(+0.985)#4,234 |
| 9. | 94133 | 2.9% | 2.1%(+0.743)#388 | 1.9%(+0.971)#4,264 |
| 10. | 94109 | 2.7% | 2.1%(+0.615)#423 | 1.9%(+0.843)#4,635 |
| 11. | 94104 | 2.6% | 2.1%(+0.524)#456 | 1.9%(+0.751)#4,954 |
| 12. | 94121 | 2.5% | 2.1%(+0.382)#505 | 1.9%(+0.609)#5,481 |
| 13. | 94110 | 2.3% | 2.1%(+0.197)#571 | 1.9%(+0.424)#6,239 |
| 14. | 94116 | 2.3% | 2.1%(+0.166)#582 | 1.9%(+0.393)#6,372 |
| 15. | 94117 | 2.2% | 2.1%(+0.100)#603 | 1.9%(+0.328)#6,722 |
| 16. | 94122 | 2.1% | 2.1%(-0.026)#655 | 1.9%(+0.202)#7,352 |
| 17. | 94127 | 2.0% | 2.1%(-0.119)#704 | 1.9%(+0.108)#7,836 |
| 18. | 94112 | 1.9% | 2.1%(-0.199)#729 | 1.9%(+0.029)#8,330 |
| 19. | 94124 | 1.9% | 2.1%(-0.266)#768 | 1.9%(-0.039)#8,758 |
| 20. | 94107 | 1.6% | 2.1%(-0.553)#917 | 1.9%(-0.325)#10,665 |
| 21. | 94105 | 1.5% | 2.1%(-0.640)#949 | 1.9%(-0.412)#11,308 |
| 22. | 94114 | 1.4% | 2.1%(-0.732)#996 | 1.9%(-0.505)#12,086 |
| 23. | 94158 | 1.3% | 2.1%(-0.830)#1,043 | 1.9%(-0.602)#12,803 |
| 24. | 94111 | 1.2% | 2.1%(-0.881)#1,073 | 1.9%(-0.653)#13,176 |
| 25. | 94129 | 1.1% | 2.1%(-1.06)#1,140 | 1.9%(-0.829)#14,590 |
| 26. | 94134 | 0.88% | 2.1%(-1.24)#1,207 | 1.9%(-1.01)#16,131 |
1
Common Questions
What are the Top 10 Zip Codes with the Highest Percentage of Population Employed in Real Estate, Rental & Leasing in San Francisco, CA?
Top 10 Zip Codes with the Highest Percentage of Population Employed in Real Estate, Rental & Leasing in San Francisco, CA are:
What zip code has the Highest Percentage of Population Employed in Real Estate, Rental & Leasing in San Francisco, CA?
94123 has the Highest Percentage of Population Employed in Real Estate, Rental & Leasing in San Francisco, CA with 4.9%.
What is the Percentage of Population Employed in Real Estate, Rental & Leasing in San Francisco, CA?
Percentage of Population Employed in Real Estate, Rental & Leasing in San Francisco is 2.4%.
What is the Percentage of Population Employed in Real Estate, Rental & Leasing in California?
Percentage of Population Employed in Real Estate, Rental & Leasing in California is 2.1%.
What is the Percentage of Population Employed in Real Estate, Rental & Leasing in the United States?
Percentage of Population Employed in Real Estate, Rental & Leasing in the United States is 1.9%.