Cities with the Highest Percentage of Population Employed in Real Estate, Rental & Leasing in Minnesota
RELATED REPORTS & OPTIONS
Real Estate, Rental & Leasing
Minnesota
Compare Cities
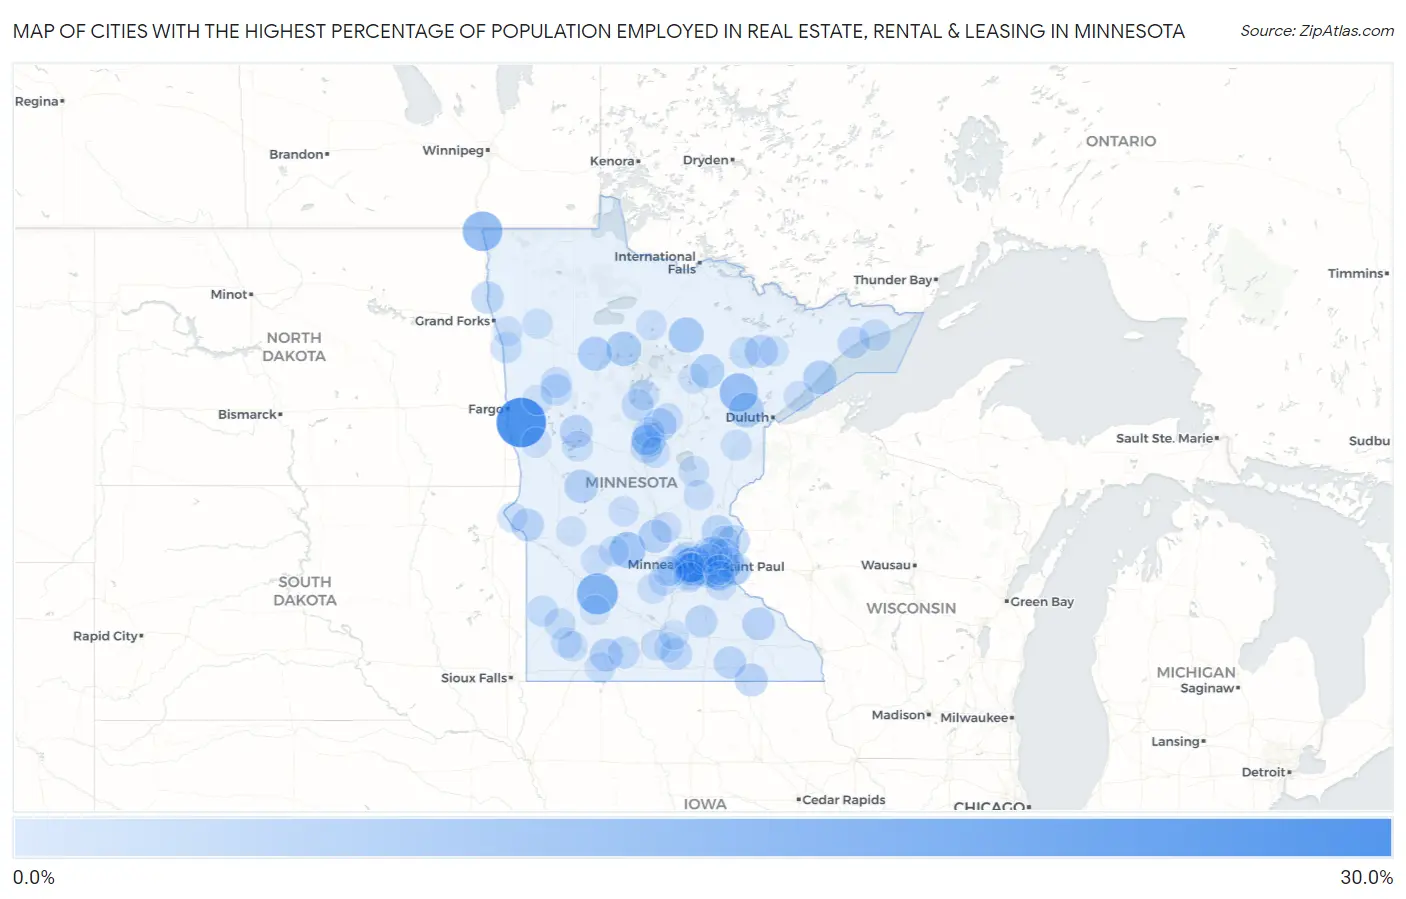
Map of Cities with the Highest Percentage of Population Employed in Real Estate, Rental & Leasing in Minnesota
0.0%
30.0%
Cities with the Highest Percentage of Population Employed in Real Estate, Rental & Leasing in Minnesota
| City | % Employed | vs State | vs National | |
| 1. | Baker | 28.6% | 1.4%(+27.2)#1 | 1.9%(+26.7)#75 |
| 2. | Delhi | 16.7% | 1.4%(+15.3)#2 | 1.9%(+14.8)#205 |
| 3. | St Vincent | 14.8% | 1.4%(+13.4)#3 | 1.9%(+12.9)#255 |
| 4. | Woodland | 13.3% | 1.4%(+11.9)#4 | 1.9%(+11.4)#303 |
| 5. | Meadowlands | 13.0% | 1.4%(+11.6)#5 | 1.9%(+11.1)#316 |
| 6. | Grove City | 10.0% | 1.4%(+8.56)#6 | 1.9%(+8.06)#544 |
| 7. | Bigfork | 8.8% | 1.4%(+7.40)#7 | 1.9%(+6.90)#680 |
| 8. | Brookston | 8.6% | 1.4%(+7.18)#8 | 1.9%(+6.68)#714 |
| 9. | Sunfish Lake | 8.0% | 1.4%(+6.62)#9 | 1.9%(+6.12)#821 |
| 10. | Turtle River | 8.0% | 1.4%(+6.61)#10 | 1.9%(+6.11)#829 |
| 11. | Shevlin | 7.3% | 1.4%(+5.92)#11 | 1.9%(+5.43)#965 |
| 12. | Nisswa | 7.3% | 1.4%(+5.88)#12 | 1.9%(+5.38)#973 |
| 13. | Orono | 7.2% | 1.4%(+5.83)#13 | 1.9%(+5.34)#985 |
| 14. | Calumet | 7.2% | 1.4%(+5.82)#14 | 1.9%(+5.32)#987 |
| 15. | Beaver Bay | 6.9% | 1.4%(+5.50)#15 | 1.9%(+5.00)#1,072 |
| 16. | Garfield | 6.5% | 1.4%(+5.15)#16 | 1.9%(+4.66)#1,176 |
| 17. | Fairhaven | 6.5% | 1.4%(+5.08)#17 | 1.9%(+4.58)#1,199 |
| 18. | Crosslake | 6.1% | 1.4%(+4.70)#18 | 1.9%(+4.20)#1,337 |
| 19. | Tonka Bay | 5.9% | 1.4%(+4.52)#19 | 1.9%(+4.03)#1,412 |
| 20. | Fish Lake | 5.9% | 1.4%(+4.49)#20 | 1.9%(+3.99)#1,426 |
| 21. | Le Roy | 5.8% | 1.4%(+4.45)#21 | 1.9%(+3.95)#1,439 |
| 22. | Biwabik | 5.8% | 1.4%(+4.42)#22 | 1.9%(+3.92)#1,453 |
| 23. | Perham | 5.7% | 1.4%(+4.29)#23 | 1.9%(+3.80)#1,504 |
| 24. | Hammond | 5.7% | 1.4%(+4.29)#24 | 1.9%(+3.79)#1,509 |
| 25. | Clinton | 5.6% | 1.4%(+4.23)#25 | 1.9%(+3.73)#1,535 |
| 26. | Brownsdale | 5.2% | 1.4%(+3.76)#26 | 1.9%(+3.27)#1,775 |
| 27. | Oslo | 5.1% | 1.4%(+3.75)#27 | 1.9%(+3.26)#1,782 |
| 28. | Scandia | 4.9% | 1.4%(+3.55)#28 | 1.9%(+3.05)#1,894 |
| 29. | Warsaw | 4.8% | 1.4%(+3.36)#29 | 1.9%(+2.86)#2,020 |
| 30. | Mendota Heights | 4.7% | 1.4%(+3.35)#30 | 1.9%(+2.85)#2,028 |
| 31. | Martin Lake | 4.6% | 1.4%(+3.25)#31 | 1.9%(+2.75)#2,106 |
| 32. | Odin | 4.6% | 1.4%(+3.22)#32 | 1.9%(+2.72)#2,130 |
| 33. | Lutsen | 4.6% | 1.4%(+3.19)#33 | 1.9%(+2.69)#2,152 |
| 34. | East Gull Lake | 4.5% | 1.4%(+3.12)#34 | 1.9%(+2.63)#2,196 |
| 35. | Hackensack | 4.5% | 1.4%(+3.12)#35 | 1.9%(+2.62)#2,202 |
| 36. | Minnesota Lake | 4.5% | 1.4%(+3.08)#36 | 1.9%(+2.59)#2,226 |
| 37. | Landfall | 4.3% | 1.4%(+2.86)#37 | 1.9%(+2.36)#2,402 |
| 38. | Ogema | 4.2% | 1.4%(+2.84)#38 | 1.9%(+2.35)#2,414 |
| 39. | St Marys Point | 4.1% | 1.4%(+2.68)#39 | 1.9%(+2.18)#2,582 |
| 40. | Grand Marais | 4.0% | 1.4%(+2.65)#40 | 1.9%(+2.15)#2,612 |
| 41. | Mountain Iron | 4.0% | 1.4%(+2.57)#41 | 1.9%(+2.07)#2,707 |
| 42. | Climax | 3.8% | 1.4%(+2.40)#42 | 1.9%(+1.91)#2,887 |
| 43. | Pequot Lakes | 3.8% | 1.4%(+2.39)#43 | 1.9%(+1.89)#2,903 |
| 44. | Loretto | 3.7% | 1.4%(+2.33)#44 | 1.9%(+1.83)#2,980 |
| 45. | Spring Lake Park | 3.7% | 1.4%(+2.29)#45 | 1.9%(+1.79)#3,038 |
| 46. | Edina | 3.7% | 1.4%(+2.29)#46 | 1.9%(+1.79)#3,041 |
| 47. | Balaton | 3.6% | 1.4%(+2.18)#47 | 1.9%(+1.68)#3,189 |
| 48. | Plato | 3.4% | 1.4%(+2.02)#48 | 1.9%(+1.53)#3,396 |
| 49. | Forest Lake | 3.3% | 1.4%(+1.94)#49 | 1.9%(+1.44)#3,509 |
| 50. | Arco | 3.3% | 1.4%(+1.94)#50 | 1.9%(+1.44)#3,526 |
| 51. | Waubun | 3.3% | 1.4%(+1.92)#51 | 1.9%(+1.42)#3,564 |
| 52. | Emily | 3.3% | 1.4%(+1.86)#52 | 1.9%(+1.36)#3,660 |
| 53. | Moose Lake | 3.2% | 1.4%(+1.80)#53 | 1.9%(+1.31)#3,773 |
| 54. | Afton | 3.1% | 1.4%(+1.73)#54 | 1.9%(+1.24)#3,887 |
| 55. | Dellwood | 3.1% | 1.4%(+1.70)#55 | 1.9%(+1.20)#3,939 |
| 56. | Ottertail | 3.1% | 1.4%(+1.68)#56 | 1.9%(+1.19)#3,972 |
| 57. | Vernon Center | 3.1% | 1.4%(+1.66)#57 | 1.9%(+1.17)#4,008 |
| 58. | Whipholt | 3.0% | 1.4%(+1.64)#58 | 1.9%(+1.14)#4,075 |
| 59. | Slayton | 3.0% | 1.4%(+1.61)#59 | 1.9%(+1.11)#4,121 |
| 60. | Wahkon | 3.0% | 1.4%(+1.61)#60 | 1.9%(+1.11)#4,123 |
| 61. | Brainerd | 3.0% | 1.4%(+1.58)#61 | 1.9%(+1.08)#4,176 |
| 62. | Richfield | 2.9% | 1.4%(+1.55)#62 | 1.9%(+1.05)#4,245 |
| 63. | Greenwood | 2.9% | 1.4%(+1.54)#63 | 1.9%(+1.04)#4,255 |
| 64. | Raymond | 2.9% | 1.4%(+1.48)#64 | 1.9%(+0.980)#4,379 |
| 65. | Lake Elmo | 2.9% | 1.4%(+1.46)#65 | 1.9%(+0.963)#4,417 |
| 66. | Independence | 2.8% | 1.4%(+1.43)#66 | 1.9%(+0.931)#4,492 |
| 67. | Northome | 2.8% | 1.4%(+1.41)#67 | 1.9%(+0.912)#4,542 |
| 68. | Lakefield | 2.8% | 1.4%(+1.39)#68 | 1.9%(+0.889)#4,579 |
| 69. | Ogilvie | 2.7% | 1.4%(+1.32)#69 | 1.9%(+0.823)#4,745 |
| 70. | Coates | 2.7% | 1.4%(+1.31)#70 | 1.9%(+0.811)#4,787 |
| 71. | Chanhassen | 2.7% | 1.4%(+1.31)#71 | 1.9%(+0.809)#4,791 |
| 72. | North Oaks | 2.7% | 1.4%(+1.30)#72 | 1.9%(+0.800)#4,806 |
| 73. | Two Harbors | 2.7% | 1.4%(+1.30)#73 | 1.9%(+0.798)#4,811 |
| 74. | New Munich | 2.7% | 1.4%(+1.29)#74 | 1.9%(+0.793)#4,821 |
| 75. | Mayer | 2.7% | 1.4%(+1.27)#75 | 1.9%(+0.774)#4,878 |
| 76. | Crystal | 2.6% | 1.4%(+1.25)#76 | 1.9%(+0.757)#4,931 |
| 77. | Clear Lake | 2.6% | 1.4%(+1.25)#77 | 1.9%(+0.753)#4,941 |
| 78. | Lake Shore | 2.6% | 1.4%(+1.23)#78 | 1.9%(+0.735)#4,988 |
| 79. | Lexington | 2.6% | 1.4%(+1.22)#79 | 1.9%(+0.727)#5,014 |
| 80. | Deephaven | 2.6% | 1.4%(+1.22)#80 | 1.9%(+0.718)#5,037 |
| 81. | Kandiyohi | 2.5% | 1.4%(+1.13)#81 | 1.9%(+0.635)#5,273 |
| 82. | Minnetonka Beach | 2.5% | 1.4%(+1.11)#82 | 1.9%(+0.608)#5,340 |
| 83. | Beardsley | 2.5% | 1.4%(+1.07)#83 | 1.9%(+0.567)#5,451 |
| 84. | Red Lake Falls | 2.4% | 1.4%(+1.05)#84 | 1.9%(+0.555)#5,488 |
| 85. | Avoca | 2.4% | 1.4%(+1.05)#85 | 1.9%(+0.547)#5,529 |
| 86. | Columbia Heights | 2.4% | 1.4%(+1.00)#86 | 1.9%(+0.507)#5,642 |
| 87. | Rothsay | 2.4% | 1.4%(+0.987)#87 | 1.9%(+0.489)#5,707 |
| 88. | Inver Grove Heights | 2.4% | 1.4%(+0.980)#88 | 1.9%(+0.482)#5,734 |
| 89. | Grand Rapids | 2.4% | 1.4%(+0.980)#89 | 1.9%(+0.482)#5,735 |
| 90. | Hitterdal | 2.4% | 1.4%(+0.968)#90 | 1.9%(+0.470)#5,778 |
| 91. | Chaska | 2.3% | 1.4%(+0.954)#91 | 1.9%(+0.456)#5,818 |
| 92. | New Auburn | 2.3% | 1.4%(+0.950)#92 | 1.9%(+0.452)#5,833 |
| 93. | Fisher | 2.3% | 1.4%(+0.910)#93 | 1.9%(+0.412)#5,951 |
| 94. | Mapleton | 2.3% | 1.4%(+0.901)#94 | 1.9%(+0.403)#5,976 |
| 95. | Wabasso | 2.3% | 1.4%(+0.887)#95 | 1.9%(+0.390)#6,017 |
| 96. | West St Paul | 2.3% | 1.4%(+0.883)#96 | 1.9%(+0.386)#6,033 |
| 97. | Clontarf | 2.3% | 1.4%(+0.879)#97 | 1.9%(+0.381)#6,065 |
| 98. | New Germany | 2.3% | 1.4%(+0.872)#98 | 1.9%(+0.375)#6,080 |
| 99. | St Clair | 2.2% | 1.4%(+0.828)#99 | 1.9%(+0.331)#6,231 |
| 100. | Hoyt Lakes | 2.2% | 1.4%(+0.823)#100 | 1.9%(+0.325)#6,253 |
Common Questions
What are the Top 10 Cities with the Highest Percentage of Population Employed in Real Estate, Rental & Leasing in Minnesota?
Top 10 Cities with the Highest Percentage of Population Employed in Real Estate, Rental & Leasing in Minnesota are:
#1
28.6%
#2
16.7%
#3
14.8%
#4
13.3%
#5
13.0%
#6
10.0%
#7
8.8%
#8
8.6%
#9
8.0%
#10
8.0%
What city has the Highest Percentage of Population Employed in Real Estate, Rental & Leasing in Minnesota?
Baker has the Highest Percentage of Population Employed in Real Estate, Rental & Leasing in Minnesota with 28.6%.
What is the Percentage of Population Employed in Real Estate, Rental & Leasing in the State of Minnesota?
Percentage of Population Employed in Real Estate, Rental & Leasing in Minnesota is 1.4%.
What is the Percentage of Population Employed in Real Estate, Rental & Leasing in the United States?
Percentage of Population Employed in Real Estate, Rental & Leasing in the United States is 1.9%.