East Quincy, CA Map & Demographics
East Quincy Map
East Quincy Overview
$36,560
PER CAPITA INCOME
$89,766
AVG FAMILY INCOME
$71,654
AVG HOUSEHOLD INCOME
36.8%
WAGE / INCOME GAP [ % ]
63.2¢/ $1
WAGE / INCOME GAP [ $ ]
0.43
INEQUALITY / GINI INDEX
2,399
TOTAL POPULATION
1,303
MALE POPULATION
1,096
FEMALE POPULATION
118.89
MALES / 100 FEMALES
84.11
FEMALES / 100 MALES
41.1
MEDIAN AGE
3.1
AVG FAMILY SIZE
2.9
AVG HOUSEHOLD SIZE
1,241
LABOR FORCE [ PEOPLE ]
65.5%
PERCENT IN LABOR FORCE
1.2%
UNEMPLOYMENT RATE
Income in East Quincy
Income Overview in East Quincy
Per Capita Income in East Quincy is $36,560, while median incomes of families and households are $89,766 and $71,654 respectively.
| Characteristic | Number | Measure |
| Per Capita Income | 2,399 | $36,560 |
| Median Family Income | 593 | $89,766 |
| Mean Family Income | 593 | $102,191 |
| Median Household Income | 829 | $71,654 |
| Mean Household Income | 829 | $90,014 |
| Income Deficit | 593 | $0 |
| Wage / Income Gap (%) | 2,399 | 36.80% |
| Wage / Income Gap ($) | 2,399 | 63.20¢ per $1 |
| Gini / Inequality Index | 2,399 | 0.43 |
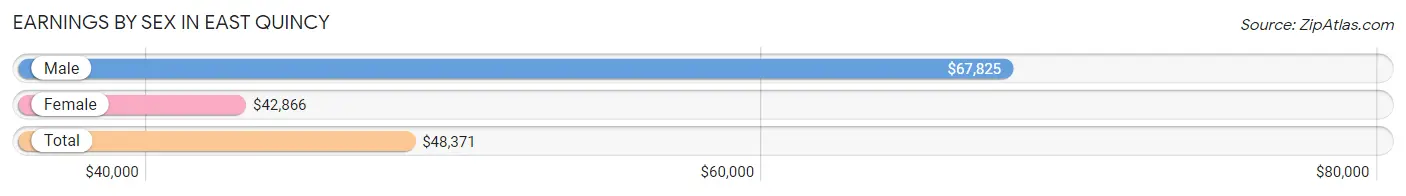
Earnings by Sex in East Quincy
Average Earnings in East Quincy are $48,371, $67,825 for men and $42,866 for women, a difference of 36.8%.
| Sex | Number | Average Earnings |
| Male | 585 (45.6%) | $67,825 |
| Female | 698 (54.4%) | $42,866 |
| Total | 1,283 (100.0%) | $48,371 |
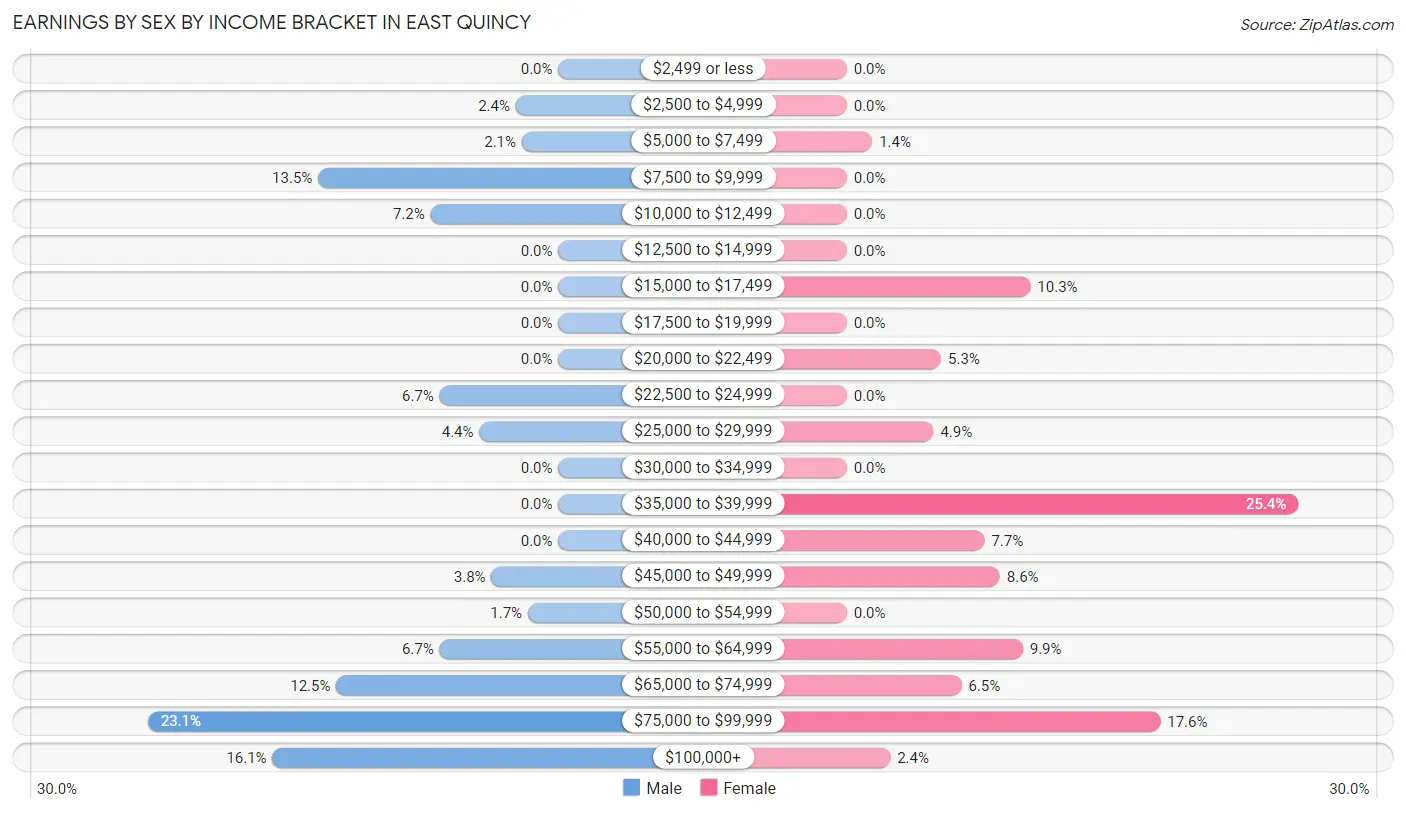
Earnings by Sex by Income Bracket in East Quincy
The most common earnings brackets in East Quincy are $75,000 to $99,999 for men (135 | 23.1%) and $35,000 to $39,999 for women (177 | 25.4%).
| Income | Male | Female |
| $2,499 or less | 0 (0.0%) | 0 (0.0%) |
| $2,500 to $4,999 | 14 (2.4%) | 0 (0.0%) |
| $5,000 to $7,499 | 12 (2.1%) | 10 (1.4%) |
| $7,500 to $9,999 | 79 (13.5%) | 0 (0.0%) |
| $10,000 to $12,499 | 42 (7.2%) | 0 (0.0%) |
| $12,500 to $14,999 | 0 (0.0%) | 0 (0.0%) |
| $15,000 to $17,499 | 0 (0.0%) | 72 (10.3%) |
| $17,500 to $19,999 | 0 (0.0%) | 0 (0.0%) |
| $20,000 to $22,499 | 0 (0.0%) | 37 (5.3%) |
| $22,500 to $24,999 | 39 (6.7%) | 0 (0.0%) |
| $25,000 to $29,999 | 26 (4.4%) | 34 (4.9%) |
| $30,000 to $34,999 | 0 (0.0%) | 0 (0.0%) |
| $35,000 to $39,999 | 0 (0.0%) | 177 (25.4%) |
| $40,000 to $44,999 | 0 (0.0%) | 54 (7.7%) |
| $45,000 to $49,999 | 22 (3.8%) | 60 (8.6%) |
| $50,000 to $54,999 | 10 (1.7%) | 0 (0.0%) |
| $55,000 to $64,999 | 39 (6.7%) | 69 (9.9%) |
| $65,000 to $74,999 | 73 (12.5%) | 45 (6.5%) |
| $75,000 to $99,999 | 135 (23.1%) | 123 (17.6%) |
| $100,000+ | 94 (16.1%) | 17 (2.4%) |
| Total | 585 (100.0%) | 698 (100.0%) |
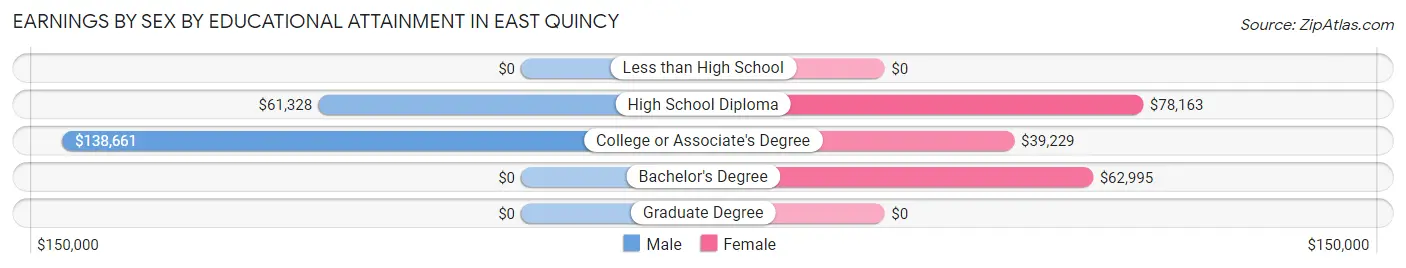
Earnings by Sex by Educational Attainment in East Quincy
Average earnings in East Quincy are $58,804 for men and $48,036 for women, a difference of 18.3%. Men with an educational attainment of college or associate's degree enjoy the highest average annual earnings of $138,661, while those with high school diploma education earn the least with $61,328. Women with an educational attainment of high school diploma earn the most with the average annual earnings of $78,163, while those with college or associate's degree education have the smallest earnings of $39,229.
| Educational Attainment | Male Income | Female Income |
| Less than High School | - | - |
| High School Diploma | $61,328 | $78,163 |
| College or Associate's Degree | $138,661 | $39,229 |
| Bachelor's Degree | - | - |
| Graduate Degree | - | - |
| Total | $58,804 | $48,036 |
Family Income in East Quincy
Family Income Brackets in East Quincy
According to the East Quincy family income data, there are 134 families falling into the $50,000 to $74,999 income range, which is the most common income bracket and makes up 22.6% of all families.
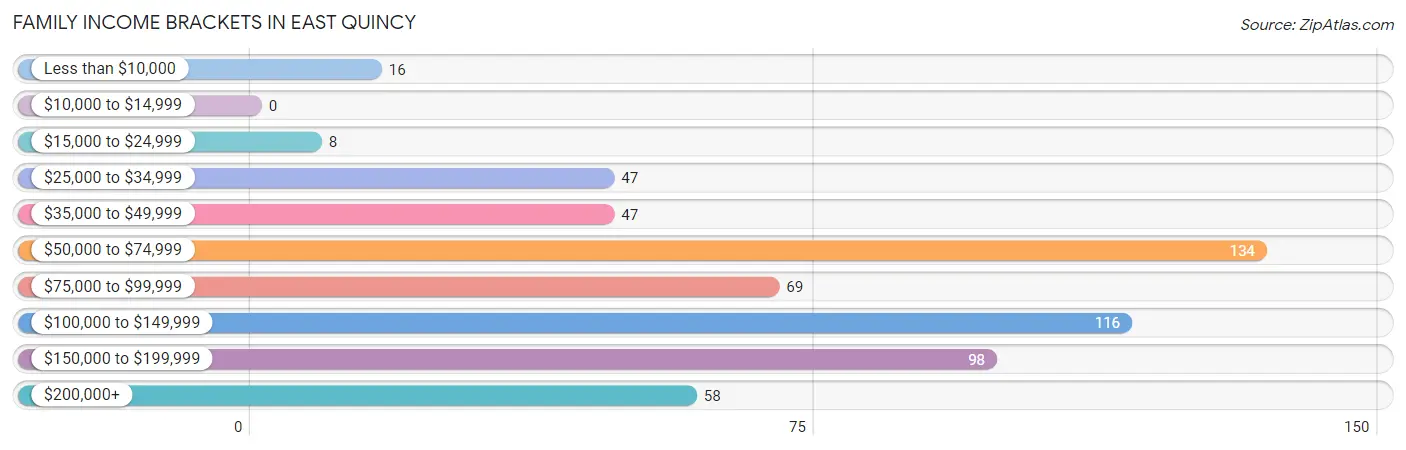
| Income Bracket | # Families | % Families |
| Less than $10,000 | 16 | 2.7% |
| $10,000 to $14,999 | 0 | 0.0% |
| $15,000 to $24,999 | 8 | 1.3% |
| $25,000 to $34,999 | 47 | 7.9% |
| $35,000 to $49,999 | 47 | 7.9% |
| $50,000 to $74,999 | 134 | 22.6% |
| $75,000 to $99,999 | 69 | 11.6% |
| $100,000 to $149,999 | 116 | 19.6% |
| $150,000 to $199,999 | 98 | 16.5% |
| $200,000+ | 58 | 9.8% |
Family Income by Famaliy Size in East Quincy
3-person families (201 | 33.9%) account for the highest median family income in East Quincy with $157,386 per family, while 3-person families (201 | 33.9%) have the highest median income of $52,462 per family member.
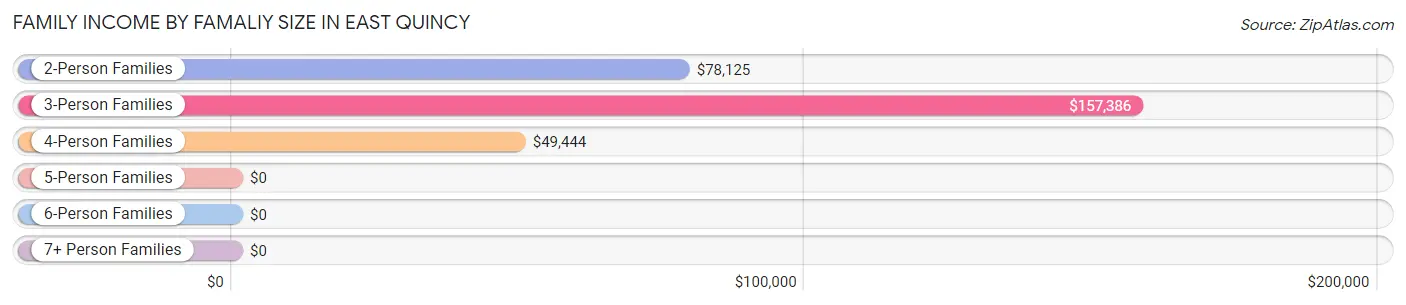
| Income Bracket | # Families | Median Income |
| 2-Person Families | 256 (43.2%) | $78,125 |
| 3-Person Families | 201 (33.9%) | $157,386 |
| 4-Person Families | 136 (22.9%) | $49,444 |
| 5-Person Families | 0 (0.0%) | $0 |
| 6-Person Families | 0 (0.0%) | $0 |
| 7+ Person Families | 0 (0.0%) | $0 |
| Total | 593 (100.0%) | $89,766 |
Family Income by Number of Earners in East Quincy
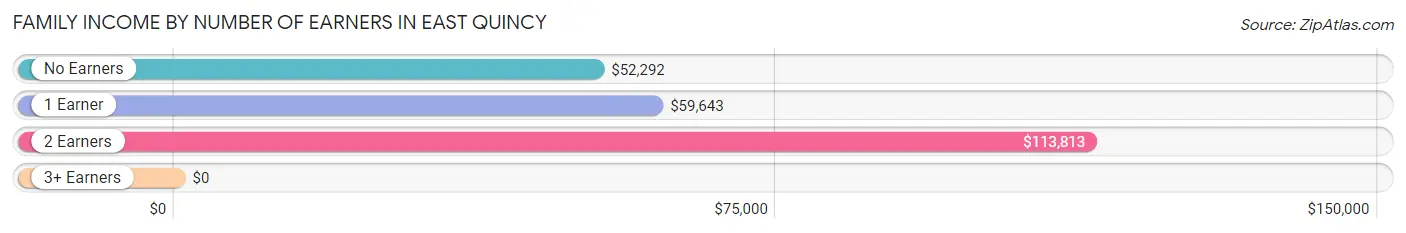
| Number of Earners | # Families | Median Income |
| No Earners | 153 (25.8%) | $52,292 |
| 1 Earner | 130 (21.9%) | $59,643 |
| 2 Earners | 266 (44.9%) | $113,813 |
| 3+ Earners | 44 (7.4%) | $0 |
| Total | 593 (100.0%) | $89,766 |
Household Income in East Quincy
Household Income Brackets in East Quincy
With 173 households falling in the category, the $50,000 to $74,999 income range is the most frequent in East Quincy, accounting for 20.9% of all households.
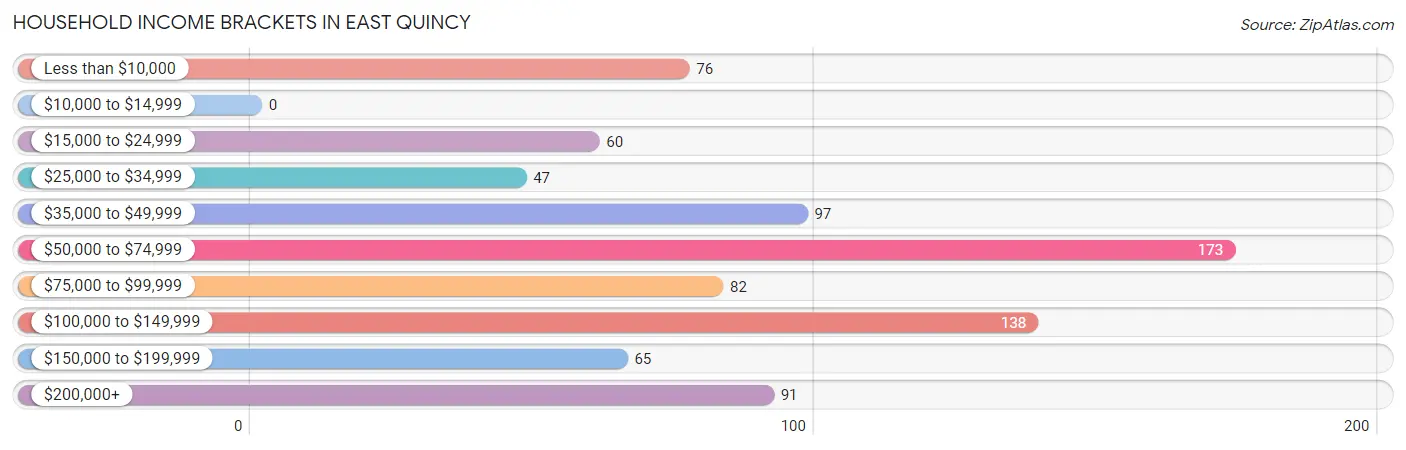
| Income Bracket | # Households | % Households |
| Less than $10,000 | 76 | 9.2% |
| $10,000 to $14,999 | 0 | 0.0% |
| $15,000 to $24,999 | 60 | 7.2% |
| $25,000 to $34,999 | 47 | 5.7% |
| $35,000 to $49,999 | 97 | 11.7% |
| $50,000 to $74,999 | 173 | 20.9% |
| $75,000 to $99,999 | 82 | 9.9% |
| $100,000 to $149,999 | 138 | 16.6% |
| $150,000 to $199,999 | 65 | 7.8% |
| $200,000+ | 91 | 11.0% |
Household Income by Householder Age in East Quincy
The median household income in East Quincy is $71,654, with the highest median household income of $99,722 found in the 45 to 64 years age bracket for the primary householder. A total of 376 households (45.4%) fall into this category. Meanwhile, the 15 to 24 years age bracket for the primary householder has the lowest median household income of $0, with 30 households (3.6%) in this group.
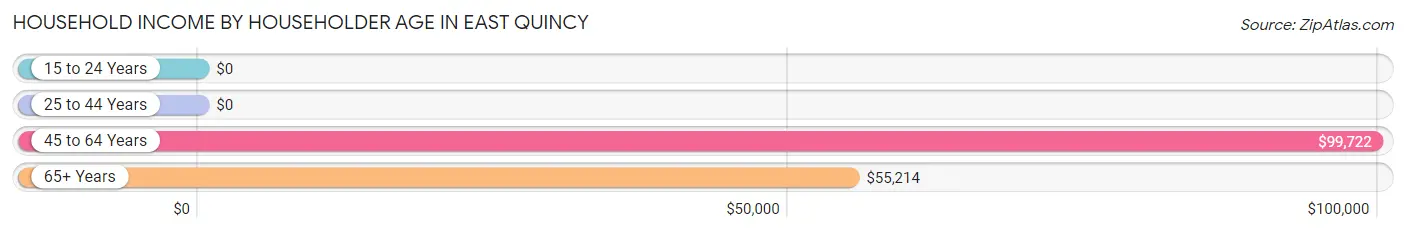
| Income Bracket | # Households | Median Income |
| 15 to 24 Years | 30 (3.6%) | $0 |
| 25 to 44 Years | 169 (20.4%) | $0 |
| 45 to 64 Years | 376 (45.4%) | $99,722 |
| 65+ Years | 254 (30.6%) | $55,214 |
| Total | 829 (100.0%) | $71,654 |
Poverty in East Quincy
Income Below Poverty by Sex and Age in East Quincy
With 18.0% poverty level for males and 10.3% for females among the residents of East Quincy, 5 year old males and 55 to 64 year old females are the most vulnerable to poverty, with 42 males (100.0%) and 60 females (27.4%) in their respective age groups living below the poverty level.
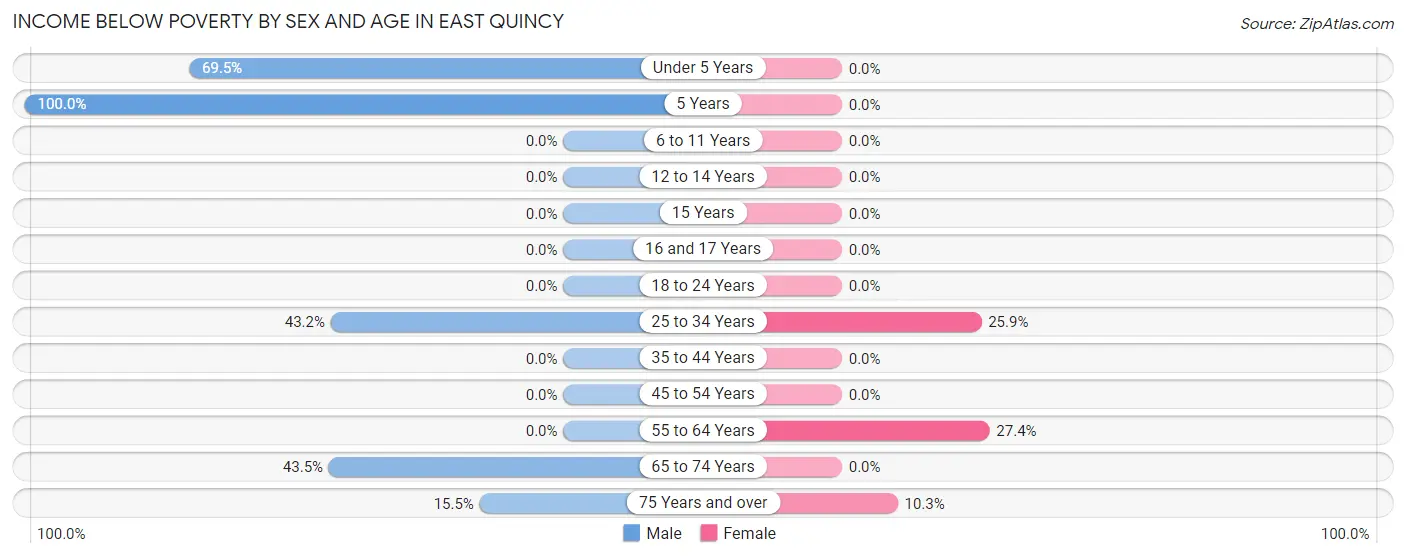
| Age Bracket | Male | Female |
| Under 5 Years | 41 (69.5%) | 0 (0.0%) |
| 5 Years | 42 (100.0%) | 0 (0.0%) |
| 6 to 11 Years | 0 (0.0%) | 0 (0.0%) |
| 12 to 14 Years | 0 (0.0%) | 0 (0.0%) |
| 15 Years | 0 (0.0%) | 0 (0.0%) |
| 16 and 17 Years | 0 (0.0%) | 0 (0.0%) |
| 18 to 24 Years | 0 (0.0%) | 0 (0.0%) |
| 25 to 34 Years | 79 (43.2%) | 44 (25.9%) |
| 35 to 44 Years | 0 (0.0%) | 0 (0.0%) |
| 45 to 54 Years | 0 (0.0%) | 0 (0.0%) |
| 55 to 64 Years | 0 (0.0%) | 60 (27.4%) |
| 65 to 74 Years | 47 (43.5%) | 0 (0.0%) |
| 75 Years and over | 16 (15.5%) | 9 (10.3%) |
| Total | 225 (18.0%) | 113 (10.3%) |
Income Above Poverty by Sex and Age in East Quincy
According to the poverty statistics in East Quincy, males aged 6 to 11 years and females aged 6 to 11 years are the age groups that are most secure financially, with 100.0% of males and 100.0% of females in these age groups living above the poverty line.
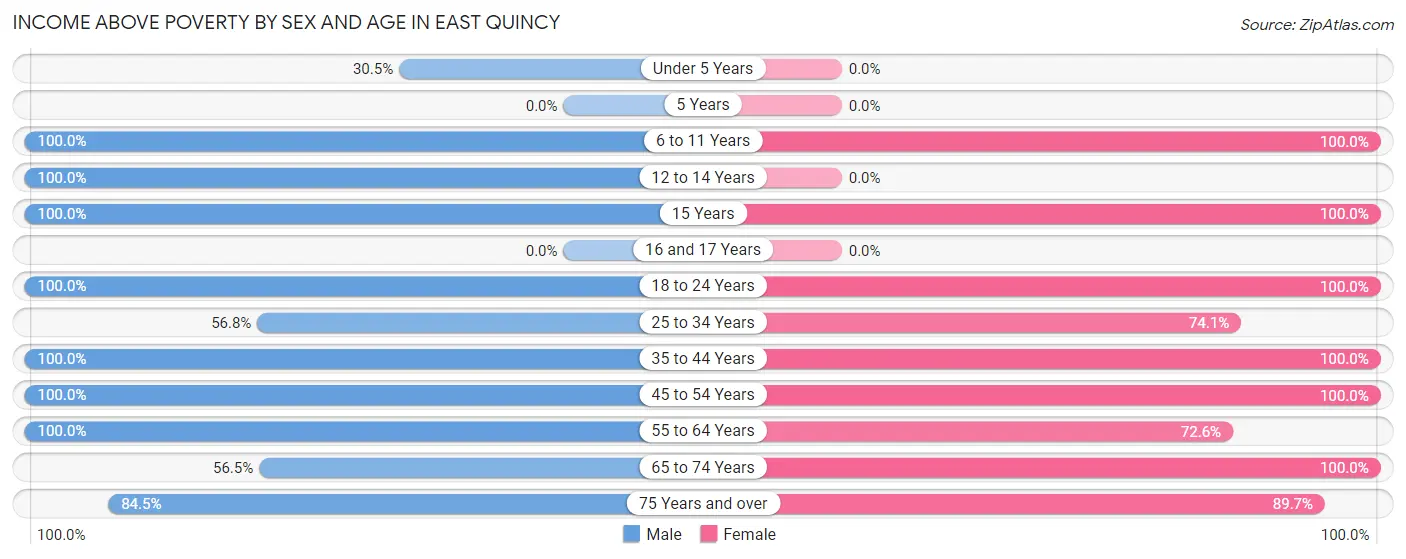
| Age Bracket | Male | Female |
| Under 5 Years | 18 (30.5%) | 0 (0.0%) |
| 5 Years | 0 (0.0%) | 0 (0.0%) |
| 6 to 11 Years | 95 (100.0%) | 32 (100.0%) |
| 12 to 14 Years | 83 (100.0%) | 0 (0.0%) |
| 15 Years | 135 (100.0%) | 35 (100.0%) |
| 16 and 17 Years | 0 (0.0%) | 0 (0.0%) |
| 18 to 24 Years | 73 (100.0%) | 102 (100.0%) |
| 25 to 34 Years | 104 (56.8%) | 126 (74.1%) |
| 35 to 44 Years | 170 (100.0%) | 158 (100.0%) |
| 45 to 54 Years | 35 (100.0%) | 200 (100.0%) |
| 55 to 64 Years | 161 (100.0%) | 159 (72.6%) |
| 65 to 74 Years | 61 (56.5%) | 93 (100.0%) |
| 75 Years and over | 87 (84.5%) | 78 (89.7%) |
| Total | 1,022 (82.0%) | 983 (89.7%) |
Income Below Poverty Among Married-Couple Families in East Quincy
The poverty statistics for married-couple families in East Quincy show that 3.5% or 16 of the total 455 families live below the poverty line. Families with no children have the highest poverty rate of 5.6%, comprising of 16 families. On the other hand, families with 1 or 2 children have the lowest poverty rate of 0.0%, which includes 0 families.
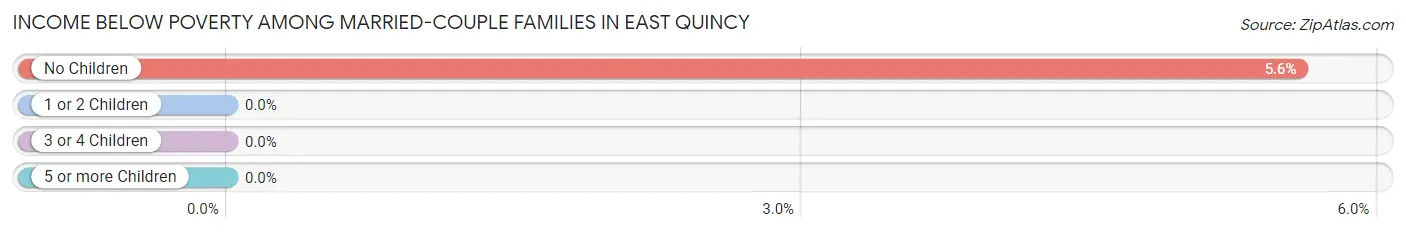
| Children | Above Poverty | Below Poverty |
| No Children | 270 (94.4%) | 16 (5.6%) |
| 1 or 2 Children | 169 (100.0%) | 0 (0.0%) |
| 3 or 4 Children | 0 (0.0%) | 0 (0.0%) |
| 5 or more Children | 0 (0.0%) | 0 (0.0%) |
| Total | 439 (96.5%) | 16 (3.5%) |
Income Below Poverty Among Single-Parent Households in East Quincy
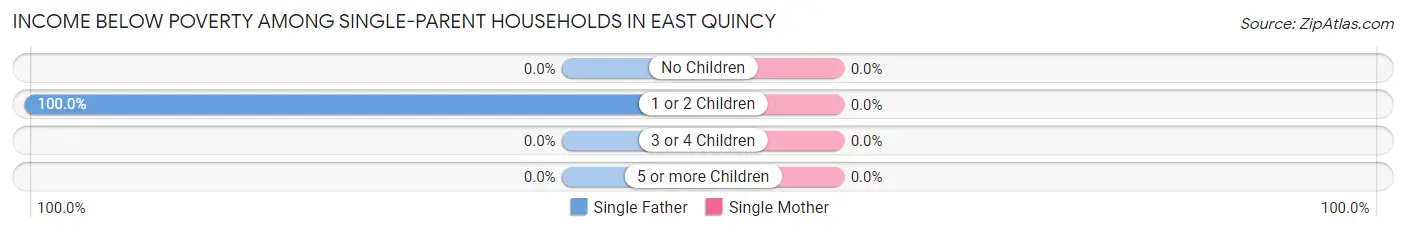
| Children | Single Father | Single Mother |
| No Children | 0 (0.0%) | 0 (0.0%) |
| 1 or 2 Children | 47 (100.0%) | 0 (0.0%) |
| 3 or 4 Children | 0 (0.0%) | 0 (0.0%) |
| 5 or more Children | 0 (0.0%) | 0 (0.0%) |
| Total | 47 (100.0%) | 0 (0.0%) |
Income Below Poverty Among Married-Couple vs Single-Parent Households in East Quincy
The poverty data for East Quincy shows that 16 of the married-couple family households (3.5%) and 47 of the single-parent households (34.1%) are living below the poverty level. Within the married-couple family households, those with no children have the highest poverty rate, with 16 households (5.6%) falling below the poverty line. Among the single-parent households, those with 1 or 2 children have the highest poverty rate, with 47 household (70.2%) living below poverty.
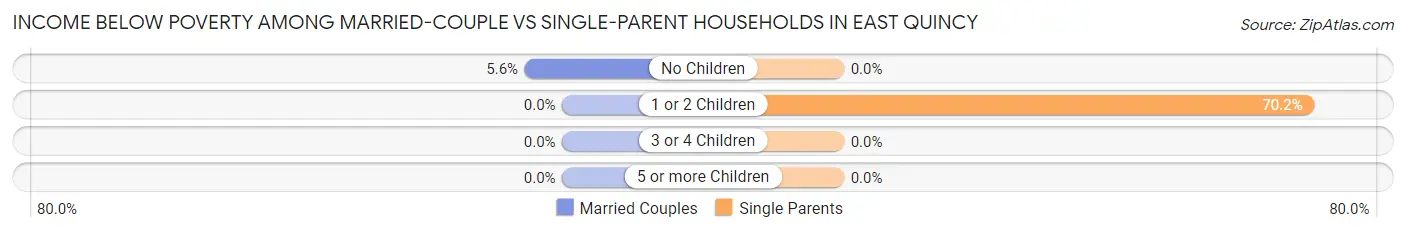
| Children | Married-Couple Families | Single-Parent Households |
| No Children | 16 (5.6%) | 0 (0.0%) |
| 1 or 2 Children | 0 (0.0%) | 47 (70.2%) |
| 3 or 4 Children | 0 (0.0%) | 0 (0.0%) |
| 5 or more Children | 0 (0.0%) | 0 (0.0%) |
| Total | 16 (3.5%) | 47 (34.1%) |
Race in East Quincy
The most populous races in East Quincy are White / Caucasian (1,907 | 79.5%), Two or more Races (328 | 13.7%), and Hispanic or Latino (155 | 6.5%).
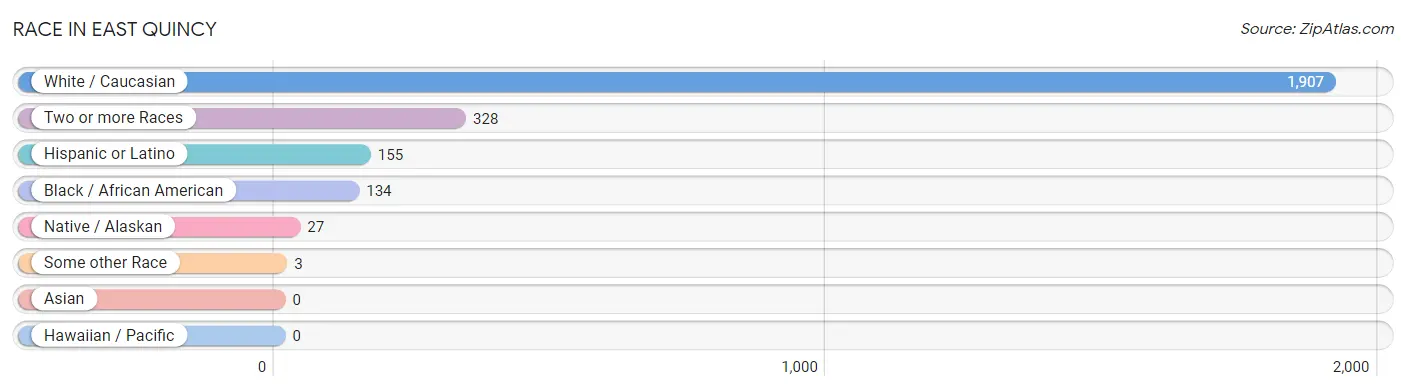
| Race | # Population | % Population |
| Asian | 0 | 0.0% |
| Black / African American | 134 | 5.6% |
| Hawaiian / Pacific | 0 | 0.0% |
| Hispanic or Latino | 155 | 6.5% |
| Native / Alaskan | 27 | 1.1% |
| White / Caucasian | 1,907 | 79.5% |
| Two or more Races | 328 | 13.7% |
| Some other Race | 3 | 0.1% |
| Total | 2,399 | 100.0% |
Ancestry in East Quincy
The most populous ancestries reported in East Quincy are German (626 | 26.1%), English (383 | 16.0%), Irish (175 | 7.3%), Italian (156 | 6.5%), and Mexican (109 | 4.5%), together accounting for 60.4% of all East Quincy residents.
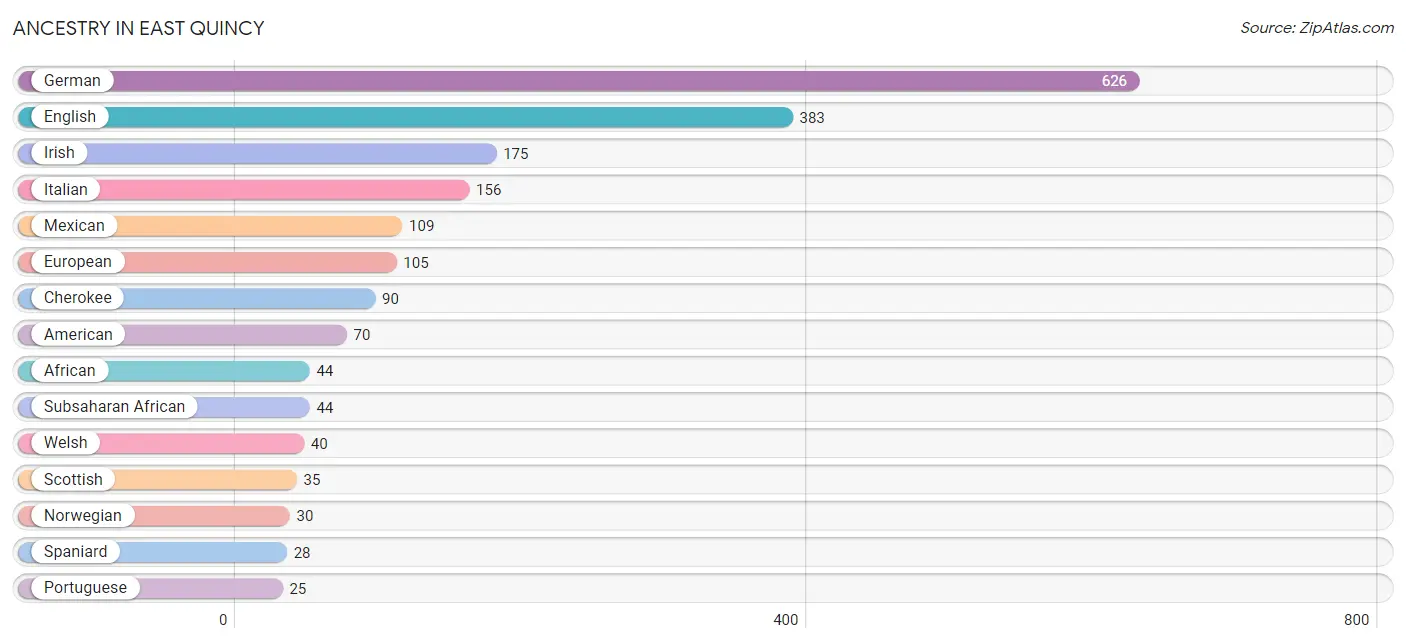
| Ancestry | # Population | % Population |
| African | 44 | 1.8% |
| American | 70 | 2.9% |
| Armenian | 4 | 0.2% |
| Canadian | 9 | 0.4% |
| Cherokee | 90 | 3.7% |
| Czech | 15 | 0.6% |
| Dutch | 14 | 0.6% |
| English | 383 | 16.0% |
| European | 105 | 4.4% |
| French Canadian | 12 | 0.5% |
| German | 626 | 26.1% |
| Irish | 175 | 7.3% |
| Italian | 156 | 6.5% |
| Latvian | 12 | 0.5% |
| Mexican | 109 | 4.5% |
| Norwegian | 30 | 1.3% |
| Portuguese | 25 | 1.0% |
| Russian | 4 | 0.2% |
| Scottish | 35 | 1.5% |
| South American | 18 | 0.7% |
| Spaniard | 28 | 1.2% |
| Subsaharan African | 44 | 1.8% |
| Swedish | 21 | 0.9% |
| Venezuelan | 18 | 0.7% |
| Welsh | 40 | 1.7% | View All 25 Rows |
Immigrants in East Quincy
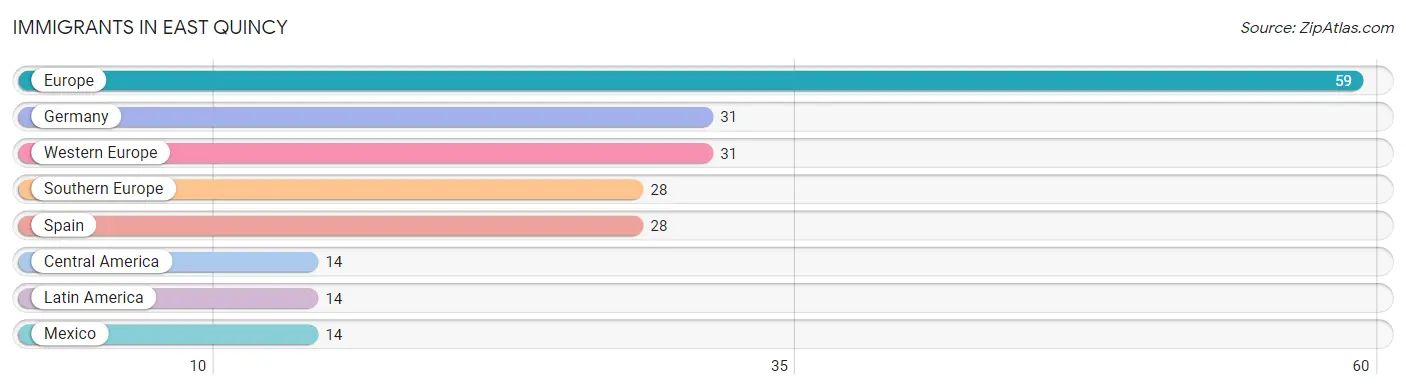
The most numerous immigrant groups reported in East Quincy came from Europe (59 | 2.5%), Germany (31 | 1.3%), Western Europe (31 | 1.3%), Southern Europe (28 | 1.2%), and Spain (28 | 1.2%), together accounting for 7.4% of all East Quincy residents.
| Immigration Origin | # Population | % Population |
| Central America | 14 | 0.6% |
| Europe | 59 | 2.5% |
| Germany | 31 | 1.3% |
| Latin America | 14 | 0.6% |
| Mexico | 14 | 0.6% |
| Southern Europe | 28 | 1.2% |
| Spain | 28 | 1.2% |
| Western Europe | 31 | 1.3% | View All 8 Rows |
Sex and Age in East Quincy
Sex and Age in East Quincy
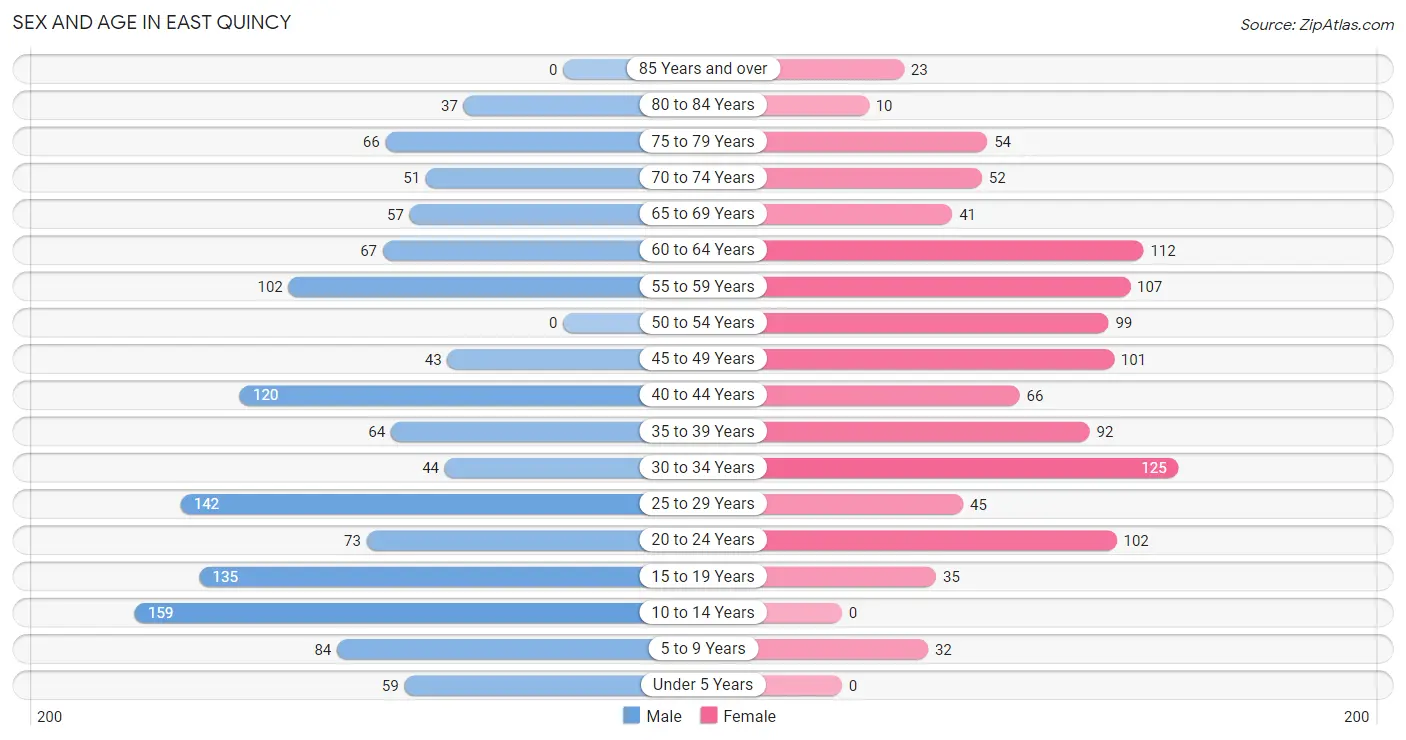
The most populous age groups in East Quincy are 10 to 14 Years (159 | 12.2%) for men and 30 to 34 Years (125 | 11.4%) for women.
| Age Bracket | Male | Female |
| Under 5 Years | 59 (4.5%) | 0 (0.0%) |
| 5 to 9 Years | 84 (6.5%) | 32 (2.9%) |
| 10 to 14 Years | 159 (12.2%) | 0 (0.0%) |
| 15 to 19 Years | 135 (10.4%) | 35 (3.2%) |
| 20 to 24 Years | 73 (5.6%) | 102 (9.3%) |
| 25 to 29 Years | 142 (10.9%) | 45 (4.1%) |
| 30 to 34 Years | 44 (3.4%) | 125 (11.4%) |
| 35 to 39 Years | 64 (4.9%) | 92 (8.4%) |
| 40 to 44 Years | 120 (9.2%) | 66 (6.0%) |
| 45 to 49 Years | 43 (3.3%) | 101 (9.2%) |
| 50 to 54 Years | 0 (0.0%) | 99 (9.0%) |
| 55 to 59 Years | 102 (7.8%) | 107 (9.8%) |
| 60 to 64 Years | 67 (5.1%) | 112 (10.2%) |
| 65 to 69 Years | 57 (4.4%) | 41 (3.7%) |
| 70 to 74 Years | 51 (3.9%) | 52 (4.7%) |
| 75 to 79 Years | 66 (5.1%) | 54 (4.9%) |
| 80 to 84 Years | 37 (2.8%) | 10 (0.9%) |
| 85 Years and over | 0 (0.0%) | 23 (2.1%) |
| Total | 1,303 (100.0%) | 1,096 (100.0%) |
Families and Households in East Quincy
Median Family Size in East Quincy
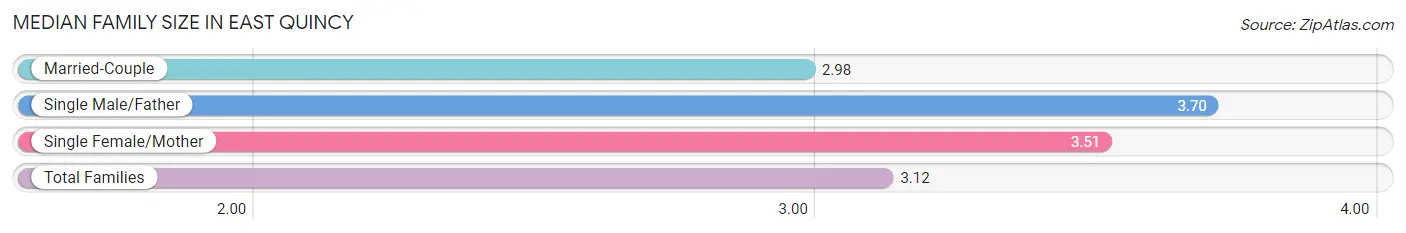
The median family size in East Quincy is 3.12 persons per family, with single male/father families (47 | 7.9%) accounting for the largest median family size of 3.7 persons per family. On the other hand, married-couple families (455 | 76.7%) represent the smallest median family size with 2.98 persons per family.
| Family Type | # Families | Family Size |
| Married-Couple | 455 (76.7%) | 2.98 |
| Single Male/Father | 47 (7.9%) | 3.70 |
| Single Female/Mother | 91 (15.3%) | 3.51 |
| Total Families | 593 (100.0%) | 3.12 |
Median Household Size in East Quincy
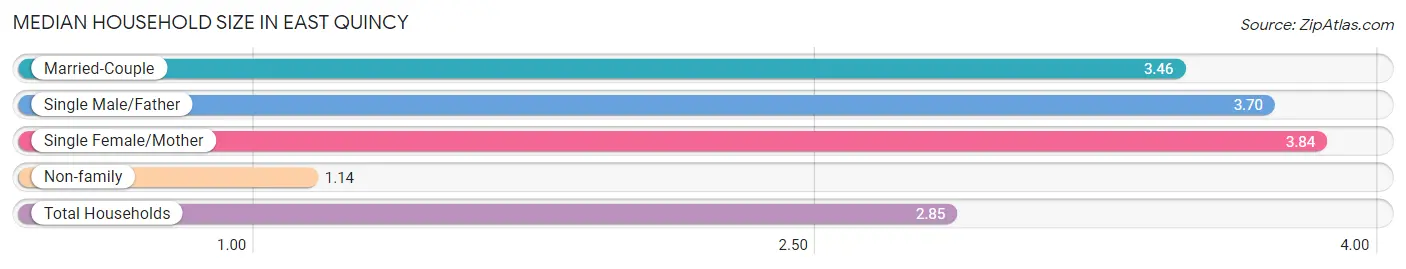
The median household size in East Quincy is 2.85 persons per household, with single female/mother households (91 | 11.0%) accounting for the largest median household size of 3.84 persons per household. non-family households (236 | 28.5%) represent the smallest median household size with 1.14 persons per household.
| Household Type | # Households | Household Size |
| Married-Couple | 455 (54.9%) | 3.46 |
| Single Male/Father | 47 (5.7%) | 3.70 |
| Single Female/Mother | 91 (11.0%) | 3.84 |
| Non-family | 236 (28.5%) | 1.14 |
| Total Households | 829 (100.0%) | 2.85 |
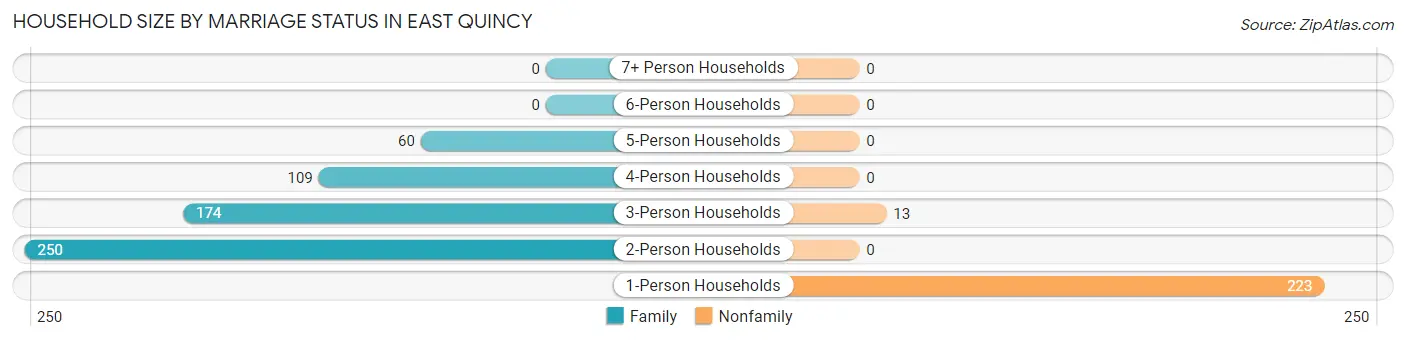
Household Size by Marriage Status in East Quincy
Out of a total of 829 households in East Quincy, 593 (71.5%) are family households, while 236 (28.5%) are nonfamily households. The most numerous type of family households are 2-person households, comprising 250, and the most common type of nonfamily households are 1-person households, comprising 223.
| Household Size | Family Households | Nonfamily Households |
| 1-Person Households | - | 223 (26.9%) |
| 2-Person Households | 250 (30.2%) | 0 (0.0%) |
| 3-Person Households | 174 (21.0%) | 13 (1.6%) |
| 4-Person Households | 109 (13.2%) | 0 (0.0%) |
| 5-Person Households | 60 (7.2%) | 0 (0.0%) |
| 6-Person Households | 0 (0.0%) | 0 (0.0%) |
| 7+ Person Households | 0 (0.0%) | 0 (0.0%) |
| Total | 593 (71.5%) | 236 (28.5%) |
Female Fertility in East Quincy
Fertility by Age in East Quincy
| Age Bracket | Women with Births | Births / 1,000 Women |
| 15 to 19 years | 0 (0.0%) | 0.0 |
| 20 to 34 years | 0 (0.0%) | 0.0 |
| 35 to 50 years | 0 (0.0%) | 0.0 |
| Total | 0 (0.0%) | 0.0 |
Fertility by Age by Marriage Status in East Quincy
| Age Bracket | Married | Unmarried |
| 15 to 19 years | 0 (0.0%) | 0 (0.0%) |
| 20 to 34 years | 0 (0.0%) | 0 (0.0%) |
| 35 to 50 years | 0 (0.0%) | 0 (0.0%) |
| Total | 0 (0.0%) | 0 (0.0%) |
Fertility by Education in East Quincy
| Educational Attainment | Women with Births | Births / 1,000 Women |
| Less than High School | 0 (0.0%) | 0.0 |
| High School Diploma | 0 (0.0%) | 0.0 |
| College or Associate's Degree | 0 (0.0%) | 0.0 |
| Bachelor's Degree | 0 (0.0%) | 0.0 |
| Graduate Degree | 0 (0.0%) | 0.0 |
| Total | 0 (0.0%) | 0.0 |
Fertility by Education by Marriage Status in East Quincy
| Educational Attainment | Married | Unmarried |
| Less than High School | 0 (0.0%) | 0 (0.0%) |
| High School Diploma | 0 (0.0%) | 0 (0.0%) |
| College or Associate's Degree | 0 (0.0%) | 0 (0.0%) |
| Bachelor's Degree | 0 (0.0%) | 0 (0.0%) |
| Graduate Degree | 0 (0.0%) | 0 (0.0%) |
| Total | 0 (0.0%) | 0 (0.0%) |
Employment Characteristics in East Quincy
Employment by Class of Employer in East Quincy
Among the 1,214 employed individuals in East Quincy, private company employees (458 | 37.7%), local government employees (342 | 28.2%), and federal government employees (121 | 10.0%) make up the most common classes of employment.
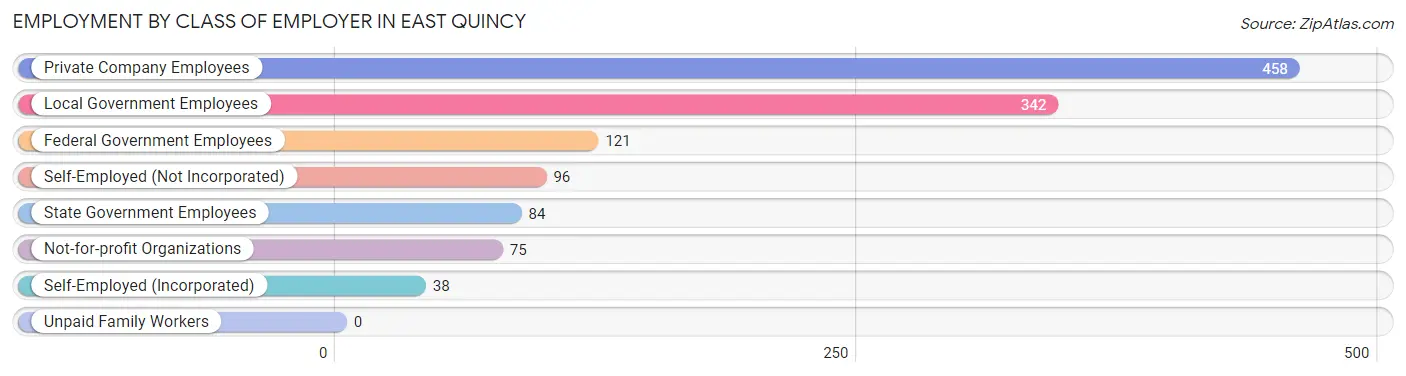
| Employer Class | # Employees | % Employees |
| Private Company Employees | 458 | 37.7% |
| Self-Employed (Incorporated) | 38 | 3.1% |
| Self-Employed (Not Incorporated) | 96 | 7.9% |
| Not-for-profit Organizations | 75 | 6.2% |
| Local Government Employees | 342 | 28.2% |
| State Government Employees | 84 | 6.9% |
| Federal Government Employees | 121 | 10.0% |
| Unpaid Family Workers | 0 | 0.0% |
| Total | 1,214 | 100.0% |
Employment Status by Age in East Quincy
According to the labor force statistics for East Quincy, out of the total population over 16 years of age (1,895), 65.5% or 1,241 individuals are in the labor force, with 1.2% or 15 of them unemployed. The age group with the highest labor force participation rate is 20 to 24 years, with 100.0% or 175 individuals in the labor force. Within the labor force, the 65 to 74 years age range has the highest percentage of unemployed individuals, with 34.9% or 15 of them being unemployed.
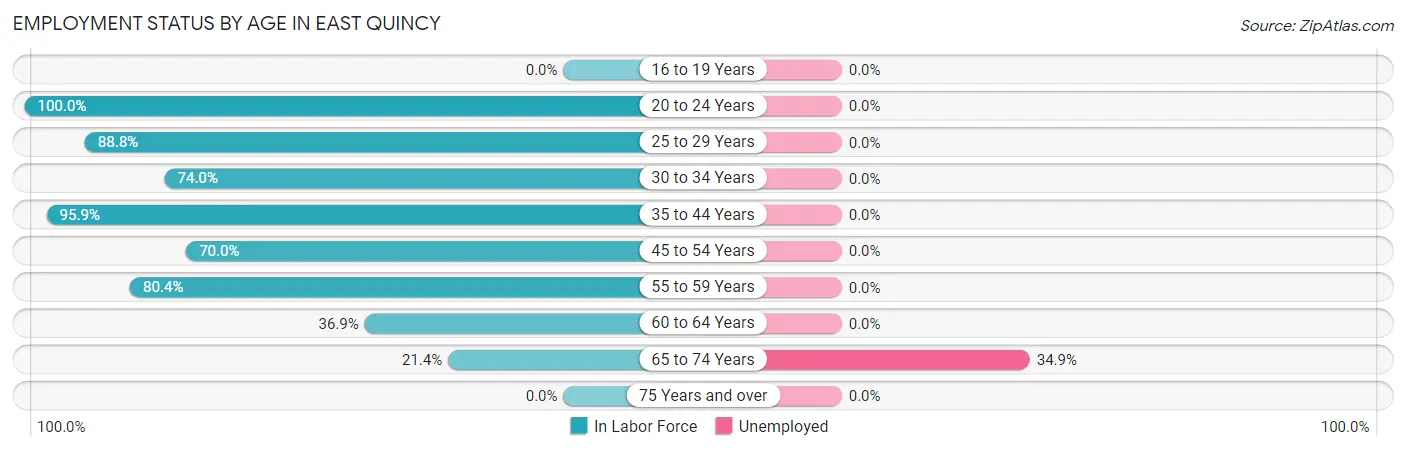
| Age Bracket | In Labor Force | Unemployed |
| 16 to 19 Years | 0 (0.0%) | 0 (0.0%) |
| 20 to 24 Years | 175 (100.0%) | 0 (0.0%) |
| 25 to 29 Years | 166 (88.8%) | 0 (0.0%) |
| 30 to 34 Years | 125 (74.0%) | 0 (0.0%) |
| 35 to 44 Years | 328 (95.9%) | 0 (0.0%) |
| 45 to 54 Years | 170 (70.0%) | 0 (0.0%) |
| 55 to 59 Years | 168 (80.4%) | 0 (0.0%) |
| 60 to 64 Years | 66 (36.9%) | 0 (0.0%) |
| 65 to 74 Years | 43 (21.4%) | 15 (34.9%) |
| 75 Years and over | 0 (0.0%) | 0 (0.0%) |
| Total | 1,241 (65.5%) | 15 (1.2%) |
Employment Status by Educational Attainment in East Quincy
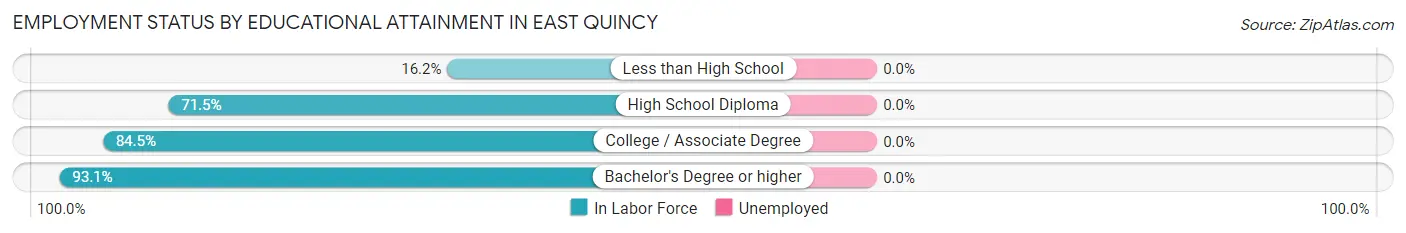
| Educational Attainment | In Labor Force | Unemployed |
| Less than High School | 17 (16.2%) | 0 (0.0%) |
| High School Diploma | 306 (71.5%) | 0 (0.0%) |
| College / Associate Degree | 404 (84.5%) | 0 (0.0%) |
| Bachelor's Degree or higher | 296 (93.1%) | 0 (0.0%) |
| Total | 1,023 (77.0%) | 0 (0.0%) |
Employment Occupations by Sex in East Quincy
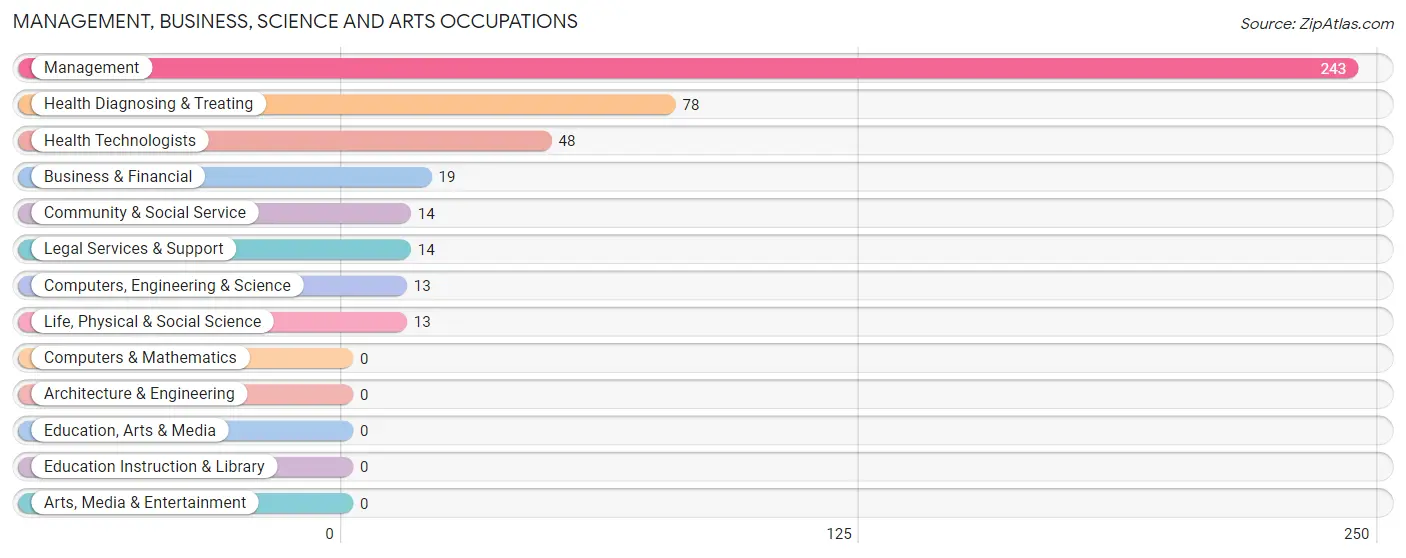
Management, Business, Science and Arts Occupations
The most common Management, Business, Science and Arts occupations in East Quincy are Management (243 | 20.2%), Health Diagnosing & Treating (78 | 6.5%), Health Technologists (48 | 4.0%), Business & Financial (19 | 1.6%), and Community & Social Service (14 | 1.2%).
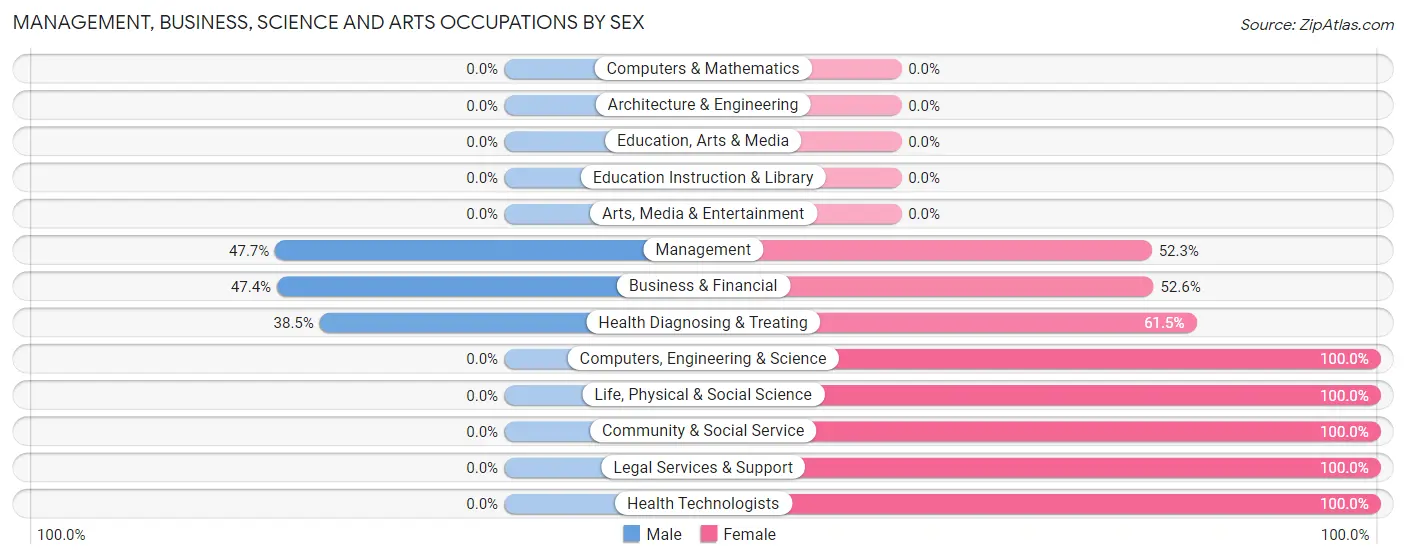
Management, Business, Science and Arts Occupations by Sex
Within the Management, Business, Science and Arts occupations in East Quincy, the most male-oriented occupations are Management (47.7%), Business & Financial (47.4%), and Health Diagnosing & Treating (38.5%), while the most female-oriented occupations are Computers, Engineering & Science (100.0%), Life, Physical & Social Science (100.0%), and Community & Social Service (100.0%).
| Occupation | Male | Female |
| Management | 116 (47.7%) | 127 (52.3%) |
| Business & Financial | 9 (47.4%) | 10 (52.6%) |
| Computers, Engineering & Science | 0 (0.0%) | 13 (100.0%) |
| Computers & Mathematics | 0 (0.0%) | 0 (0.0%) |
| Architecture & Engineering | 0 (0.0%) | 0 (0.0%) |
| Life, Physical & Social Science | 0 (0.0%) | 13 (100.0%) |
| Community & Social Service | 0 (0.0%) | 14 (100.0%) |
| Education, Arts & Media | 0 (0.0%) | 0 (0.0%) |
| Legal Services & Support | 0 (0.0%) | 14 (100.0%) |
| Education Instruction & Library | 0 (0.0%) | 0 (0.0%) |
| Arts, Media & Entertainment | 0 (0.0%) | 0 (0.0%) |
| Health Diagnosing & Treating | 30 (38.5%) | 48 (61.5%) |
| Health Technologists | 0 (0.0%) | 48 (100.0%) |
| Total (Category) | 155 (42.2%) | 212 (57.8%) |
| Total (Overall) | 554 (46.0%) | 650 (54.0%) |
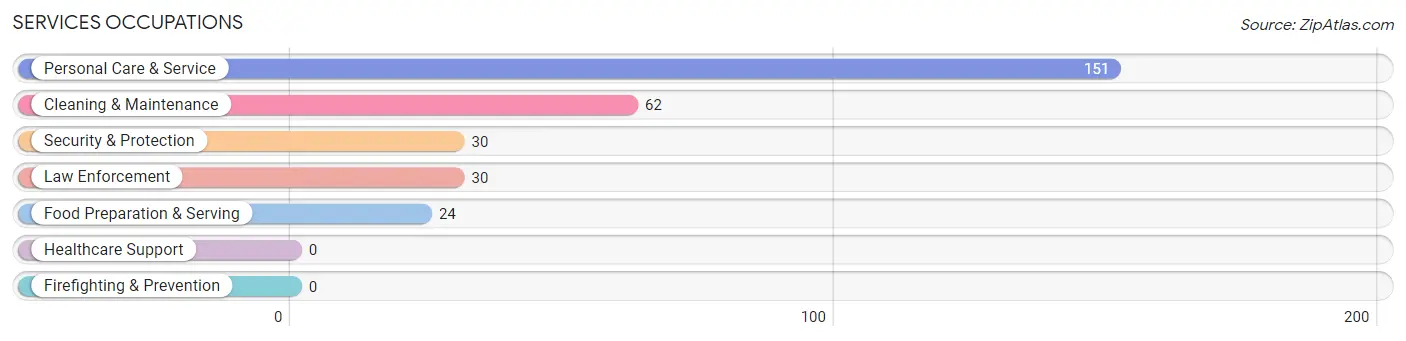
Services Occupations
The most common Services occupations in East Quincy are Personal Care & Service (151 | 12.5%), Cleaning & Maintenance (62 | 5.1%), Security & Protection (30 | 2.5%), Law Enforcement (30 | 2.5%), and Food Preparation & Serving (24 | 2.0%).
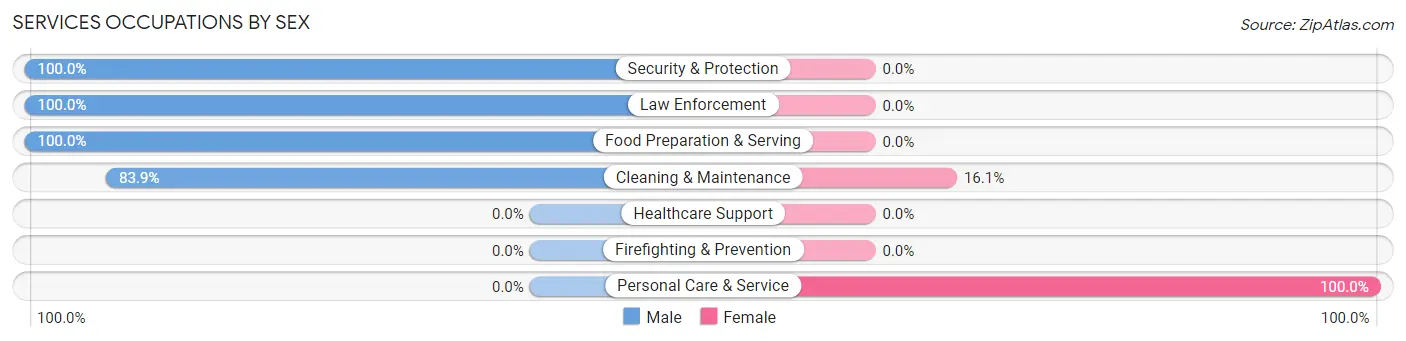
Services Occupations by Sex
Within the Services occupations in East Quincy, the most male-oriented occupations are Security & Protection (100.0%), Law Enforcement (100.0%), and Food Preparation & Serving (100.0%), while the most female-oriented occupations are Personal Care & Service (100.0%), and Cleaning & Maintenance (16.1%).
| Occupation | Male | Female |
| Healthcare Support | 0 (0.0%) | 0 (0.0%) |
| Security & Protection | 30 (100.0%) | 0 (0.0%) |
| Firefighting & Prevention | 0 (0.0%) | 0 (0.0%) |
| Law Enforcement | 30 (100.0%) | 0 (0.0%) |
| Food Preparation & Serving | 24 (100.0%) | 0 (0.0%) |
| Cleaning & Maintenance | 52 (83.9%) | 10 (16.1%) |
| Personal Care & Service | 0 (0.0%) | 151 (100.0%) |
| Total (Category) | 106 (39.7%) | 161 (60.3%) |
| Total (Overall) | 554 (46.0%) | 650 (54.0%) |
Sales and Office Occupations
The most common Sales and Office occupations in East Quincy are Office & Administration (230 | 19.1%), and Sales & Related (87 | 7.2%).
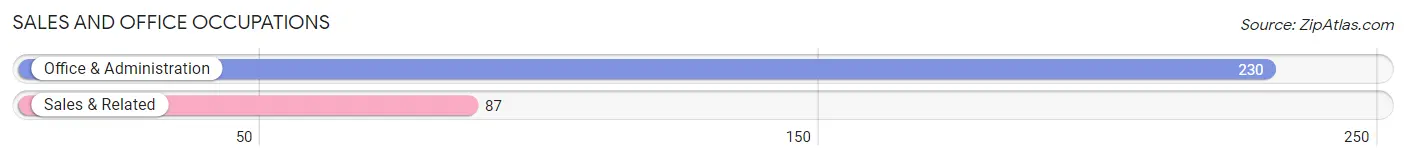
Sales and Office Occupations by Sex
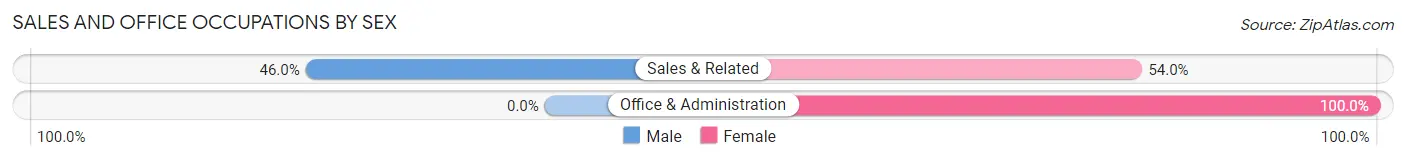
| Occupation | Male | Female |
| Sales & Related | 40 (46.0%) | 47 (54.0%) |
| Office & Administration | 0 (0.0%) | 230 (100.0%) |
| Total (Category) | 40 (12.6%) | 277 (87.4%) |
| Total (Overall) | 554 (46.0%) | 650 (54.0%) |
Natural Resources, Construction and Maintenance Occupations
The most common Natural Resources, Construction and Maintenance occupations in East Quincy are , and Construction & Extraction (73 | 6.1%).
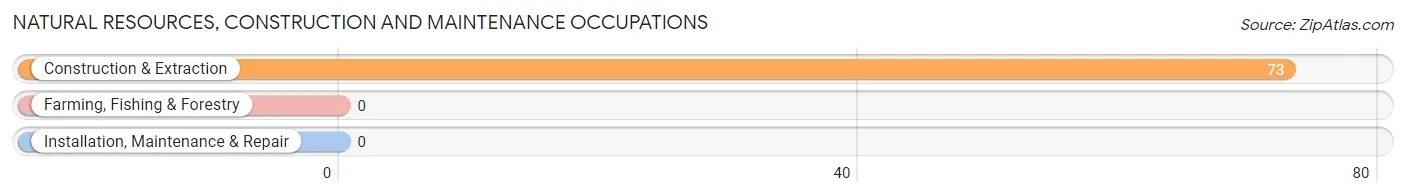
Natural Resources, Construction and Maintenance Occupations by Sex
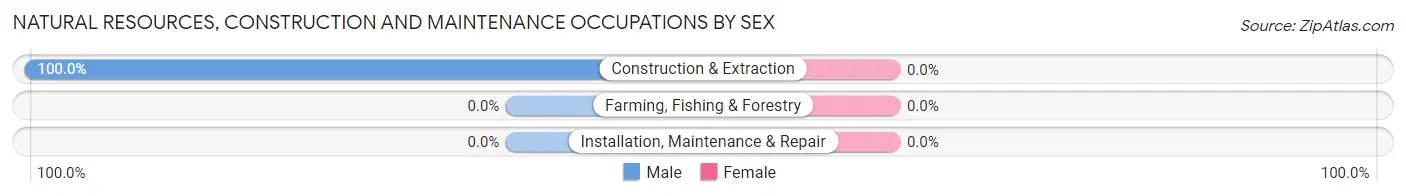
| Occupation | Male | Female |
| Farming, Fishing & Forestry | 0 (0.0%) | 0 (0.0%) |
| Construction & Extraction | 73 (100.0%) | 0 (0.0%) |
| Installation, Maintenance & Repair | 0 (0.0%) | 0 (0.0%) |
| Total (Category) | 73 (100.0%) | 0 (0.0%) |
| Total (Overall) | 554 (46.0%) | 650 (54.0%) |
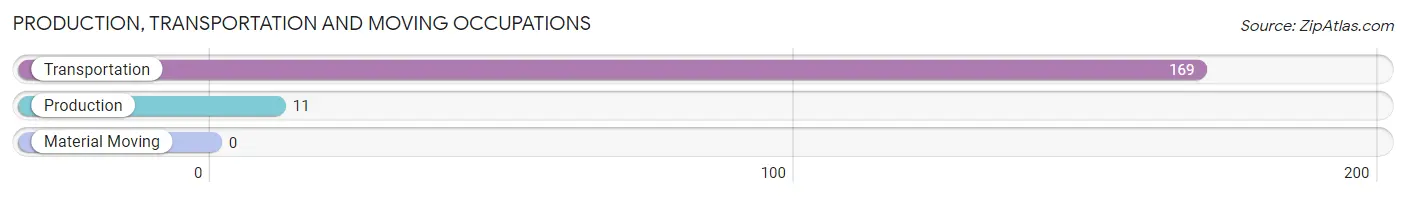
Production, Transportation and Moving Occupations
The most common Production, Transportation and Moving occupations in East Quincy are Transportation (169 | 14.0%), and Production (11 | 0.9%).
Production, Transportation and Moving Occupations by Sex
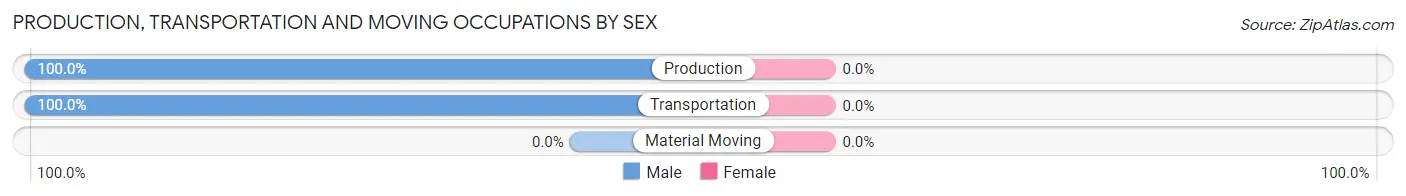
| Occupation | Male | Female |
| Production | 11 (100.0%) | 0 (0.0%) |
| Transportation | 169 (100.0%) | 0 (0.0%) |
| Material Moving | 0 (0.0%) | 0 (0.0%) |
| Total (Category) | 180 (100.0%) | 0 (0.0%) |
| Total (Overall) | 554 (46.0%) | 650 (54.0%) |
Employment Industries by Sex in East Quincy
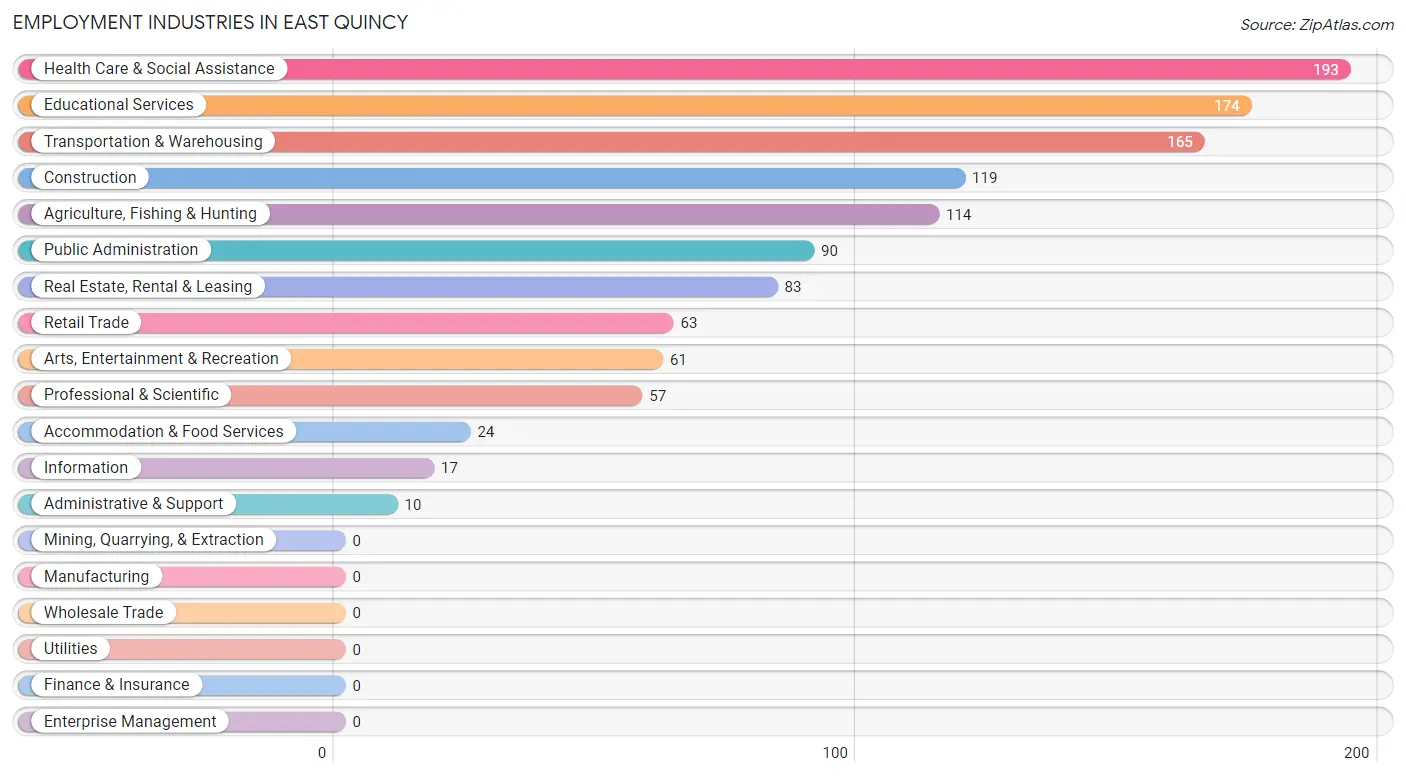
Employment Industries in East Quincy
The major employment industries in East Quincy include Health Care & Social Assistance (193 | 16.0%), Educational Services (174 | 14.4%), Transportation & Warehousing (165 | 13.7%), Construction (119 | 9.9%), and Agriculture, Fishing & Hunting (114 | 9.5%).
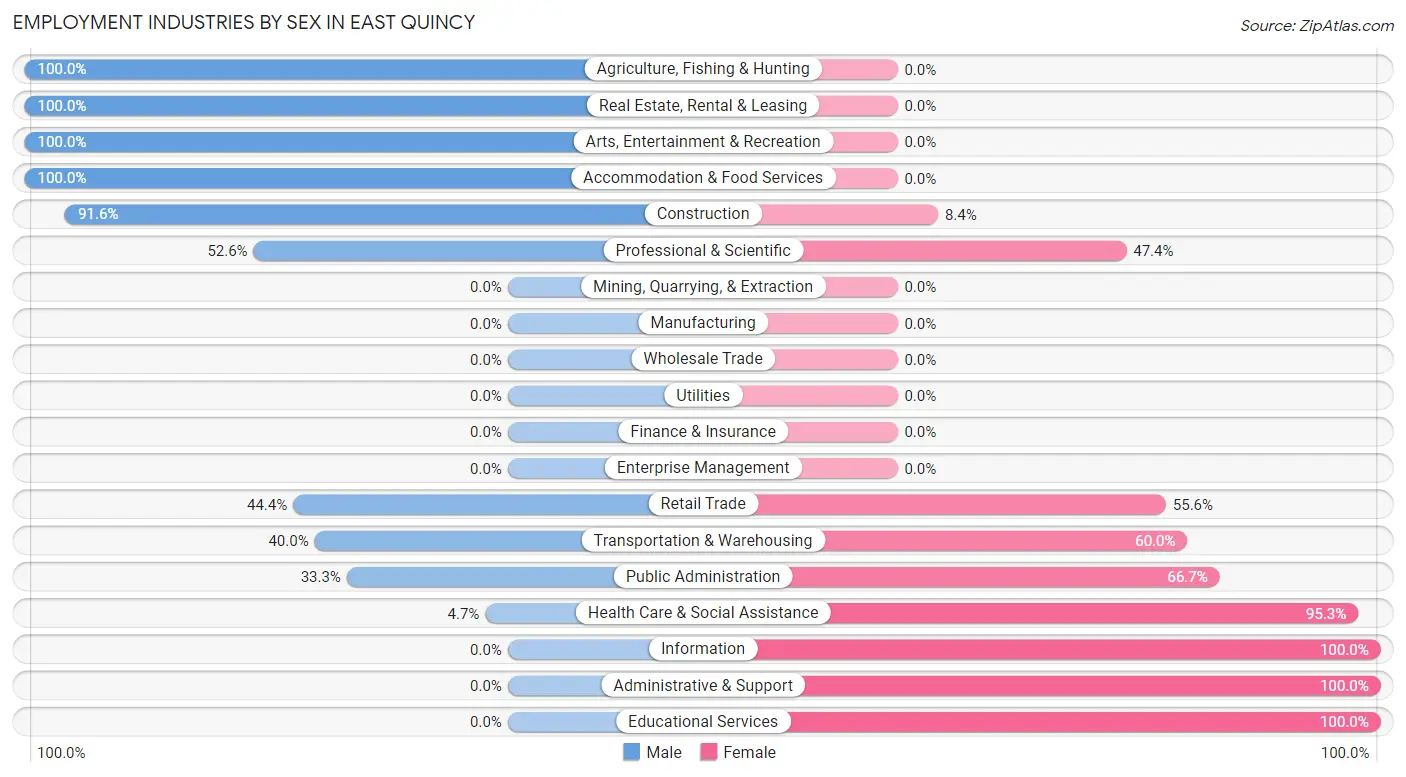
Employment Industries by Sex in East Quincy
The East Quincy industries that see more men than women are Agriculture, Fishing & Hunting (100.0%), Real Estate, Rental & Leasing (100.0%), and Arts, Entertainment & Recreation (100.0%), whereas the industries that tend to have a higher number of women are Information (100.0%), Administrative & Support (100.0%), and Educational Services (100.0%).
| Industry | Male | Female |
| Agriculture, Fishing & Hunting | 114 (100.0%) | 0 (0.0%) |
| Mining, Quarrying, & Extraction | 0 (0.0%) | 0 (0.0%) |
| Construction | 109 (91.6%) | 10 (8.4%) |
| Manufacturing | 0 (0.0%) | 0 (0.0%) |
| Wholesale Trade | 0 (0.0%) | 0 (0.0%) |
| Retail Trade | 28 (44.4%) | 35 (55.6%) |
| Transportation & Warehousing | 66 (40.0%) | 99 (60.0%) |
| Utilities | 0 (0.0%) | 0 (0.0%) |
| Information | 0 (0.0%) | 17 (100.0%) |
| Finance & Insurance | 0 (0.0%) | 0 (0.0%) |
| Real Estate, Rental & Leasing | 83 (100.0%) | 0 (0.0%) |
| Professional & Scientific | 30 (52.6%) | 27 (47.4%) |
| Enterprise Management | 0 (0.0%) | 0 (0.0%) |
| Administrative & Support | 0 (0.0%) | 10 (100.0%) |
| Educational Services | 0 (0.0%) | 174 (100.0%) |
| Health Care & Social Assistance | 9 (4.7%) | 184 (95.3%) |
| Arts, Entertainment & Recreation | 61 (100.0%) | 0 (0.0%) |
| Accommodation & Food Services | 24 (100.0%) | 0 (0.0%) |
| Public Administration | 30 (33.3%) | 60 (66.7%) |
| Total | 554 (46.0%) | 650 (54.0%) |
Education in East Quincy
School Enrollment in East Quincy
The most common levels of schooling among the 640 students in East Quincy are middle school (224 | 35.0%), college / undergraduate (167 | 26.1%), and elementary school (99 | 15.5%).
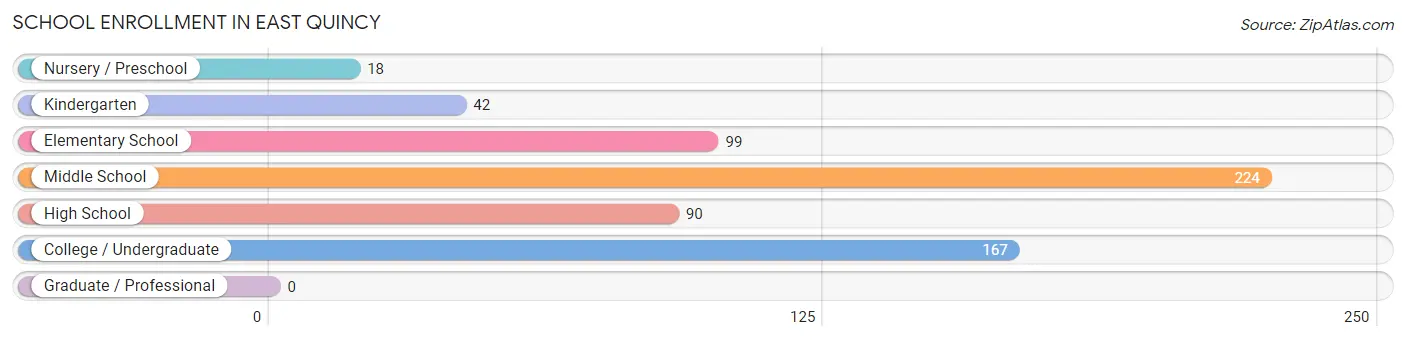
| School Level | # Students | % Students |
| Nursery / Preschool | 18 | 2.8% |
| Kindergarten | 42 | 6.6% |
| Elementary School | 99 | 15.5% |
| Middle School | 224 | 35.0% |
| High School | 90 | 14.1% |
| College / Undergraduate | 167 | 26.1% |
| Graduate / Professional | 0 | 0.0% |
| Total | 640 | 100.0% |
School Enrollment by Age by Funding Source in East Quincy
Out of a total of 640 students who are enrolled in schools in East Quincy, 18 (2.8%) attend a private institution, while the remaining 622 (97.2%) are enrolled in public schools. The age group of 3 to 4 year olds has the highest likelihood of being enrolled in private schools, with 18 (100.0% in the age bracket) enrolled. Conversely, the age group of 5 to 9 year old has the lowest likelihood of being enrolled in a private school, with 116 (100.0% in the age bracket) attending a public institution.
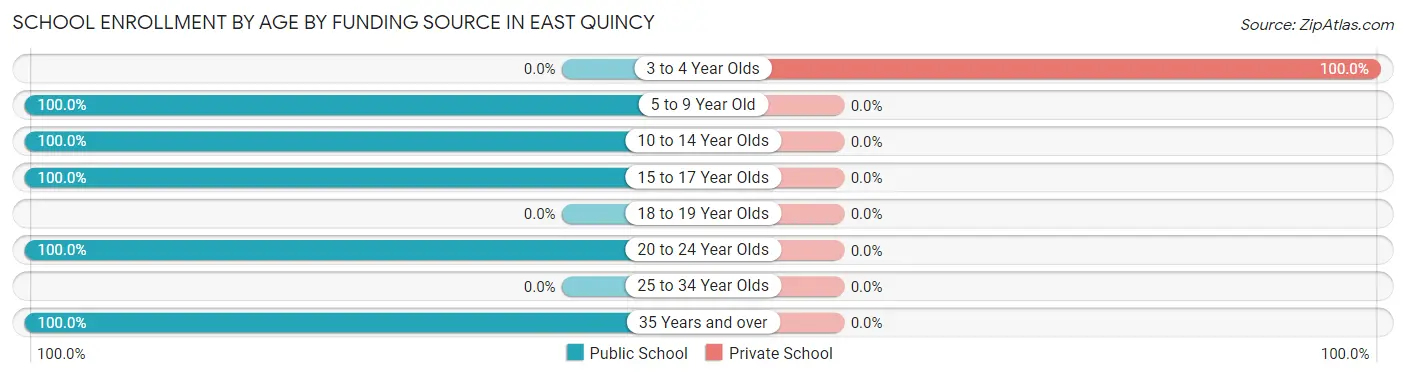
| Age Bracket | Public School | Private School |
| 3 to 4 Year Olds | 0 (0.0%) | 18 (100.0%) |
| 5 to 9 Year Old | 116 (100.0%) | 0 (0.0%) |
| 10 to 14 Year Olds | 159 (100.0%) | 0 (0.0%) |
| 15 to 17 Year Olds | 170 (100.0%) | 0 (0.0%) |
| 18 to 19 Year Olds | 0 (0.0%) | 0 (0.0%) |
| 20 to 24 Year Olds | 145 (100.0%) | 0 (0.0%) |
| 25 to 34 Year Olds | 0 (0.0%) | 0 (0.0%) |
| 35 Years and over | 32 (100.0%) | 0 (0.0%) |
| Total | 622 (97.2%) | 18 (2.8%) |
Educational Attainment by Field of Study in East Quincy
Computers & mathematics (101 | 24.6%), education (80 | 19.5%), bio, nature & agricultural (65 | 15.9%), business (60 | 14.6%), and engineering (58 | 14.1%) are the most common fields of study among 410 individuals in East Quincy who have obtained a bachelor's degree or higher.
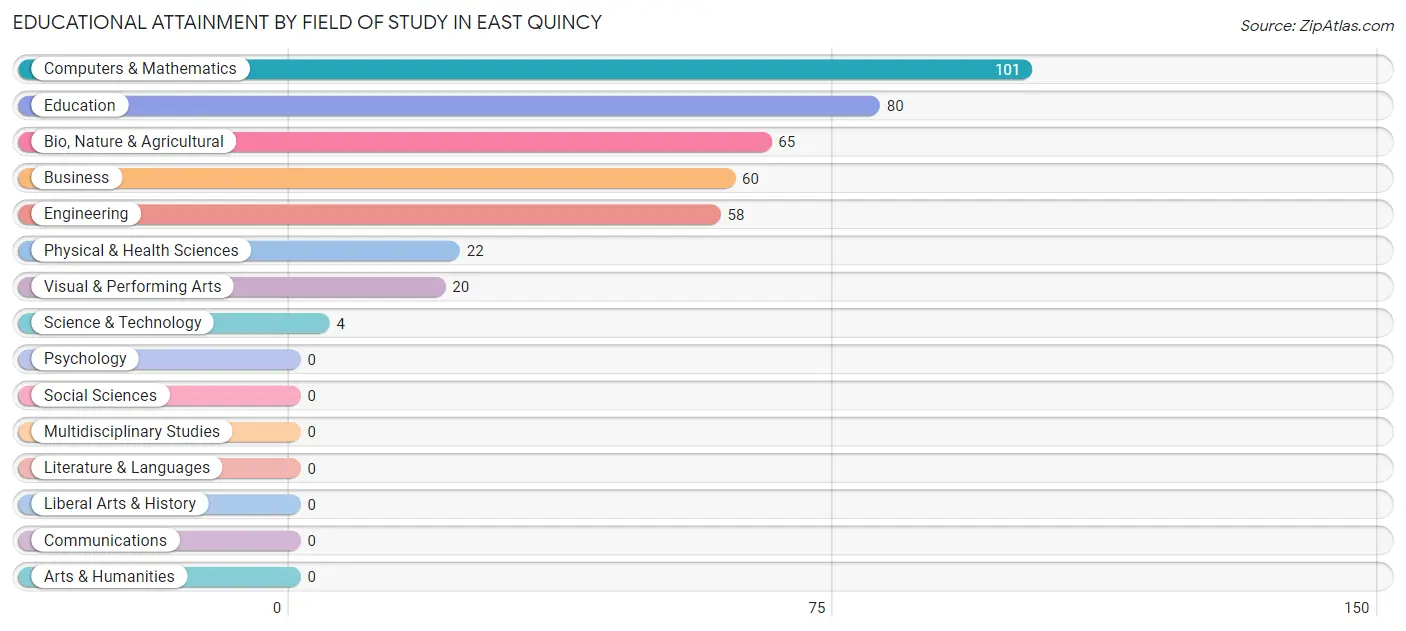
| Field of Study | # Graduates | % Graduates |
| Computers & Mathematics | 101 | 24.6% |
| Bio, Nature & Agricultural | 65 | 15.9% |
| Physical & Health Sciences | 22 | 5.4% |
| Psychology | 0 | 0.0% |
| Social Sciences | 0 | 0.0% |
| Engineering | 58 | 14.1% |
| Multidisciplinary Studies | 0 | 0.0% |
| Science & Technology | 4 | 1.0% |
| Business | 60 | 14.6% |
| Education | 80 | 19.5% |
| Literature & Languages | 0 | 0.0% |
| Liberal Arts & History | 0 | 0.0% |
| Visual & Performing Arts | 20 | 4.9% |
| Communications | 0 | 0.0% |
| Arts & Humanities | 0 | 0.0% |
| Total | 410 | 100.0% |
Transportation & Commute in East Quincy
Vehicle Availability by Sex in East Quincy
The most prevalent vehicle ownership categories in East Quincy are males with 2 vehicles (187, accounting for 33.2%) and females with 2 vehicles (249, making up 28.8%).
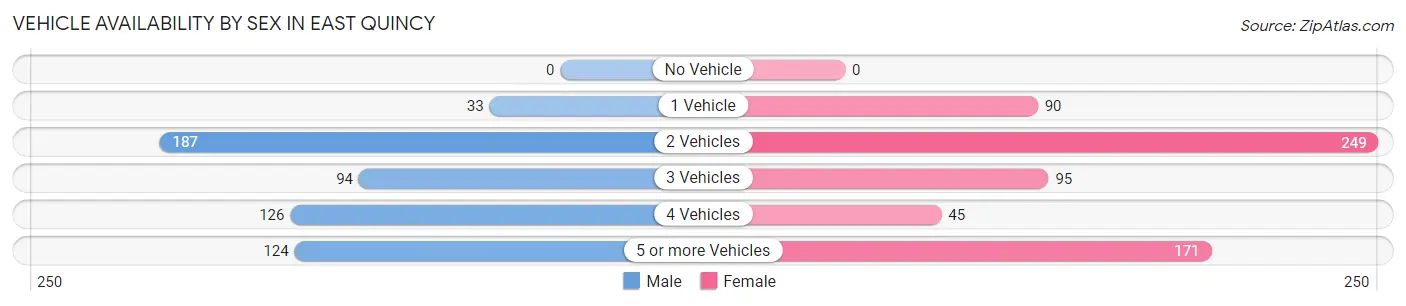
| Vehicles Available | Male | Female |
| No Vehicle | 0 (0.0%) | 0 (0.0%) |
| 1 Vehicle | 33 (5.9%) | 90 (13.9%) |
| 2 Vehicles | 187 (33.2%) | 249 (38.3%) |
| 3 Vehicles | 94 (16.7%) | 95 (14.6%) |
| 4 Vehicles | 126 (22.3%) | 45 (6.9%) |
| 5 or more Vehicles | 124 (22.0%) | 171 (26.3%) |
| Total | 564 (100.0%) | 650 (100.0%) |
Commute Time in East Quincy
The most frequently occuring commute durations in East Quincy are 5 to 9 minutes (473 commuters, 40.8%), 10 to 14 minutes (344 commuters, 29.7%), and less than 5 minutes (113 commuters, 9.8%).
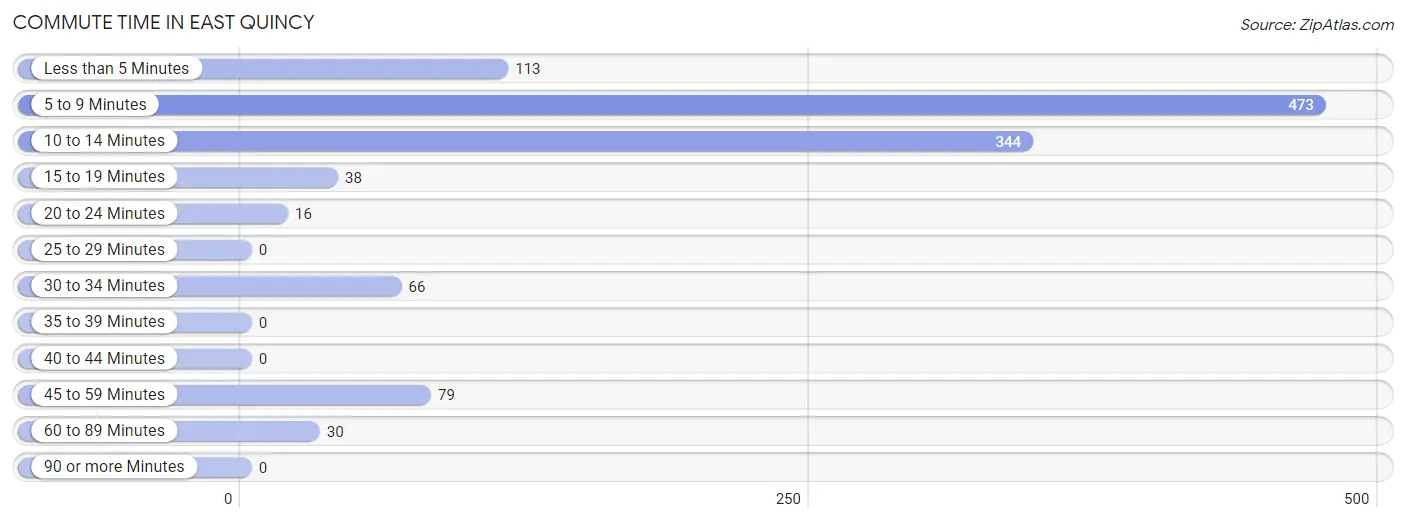
| Commute Time | # Commuters | % Commuters |
| Less than 5 Minutes | 113 | 9.8% |
| 5 to 9 Minutes | 473 | 40.8% |
| 10 to 14 Minutes | 344 | 29.7% |
| 15 to 19 Minutes | 38 | 3.3% |
| 20 to 24 Minutes | 16 | 1.4% |
| 25 to 29 Minutes | 0 | 0.0% |
| 30 to 34 Minutes | 66 | 5.7% |
| 35 to 39 Minutes | 0 | 0.0% |
| 40 to 44 Minutes | 0 | 0.0% |
| 45 to 59 Minutes | 79 | 6.8% |
| 60 to 89 Minutes | 30 | 2.6% |
| 90 or more Minutes | 0 | 0.0% |
Commute Time by Sex in East Quincy
The most common commute times in East Quincy are 5 to 9 minutes (273 commuters, 49.3%) for males and 10 to 14 minutes (269 commuters, 44.5%) for females.
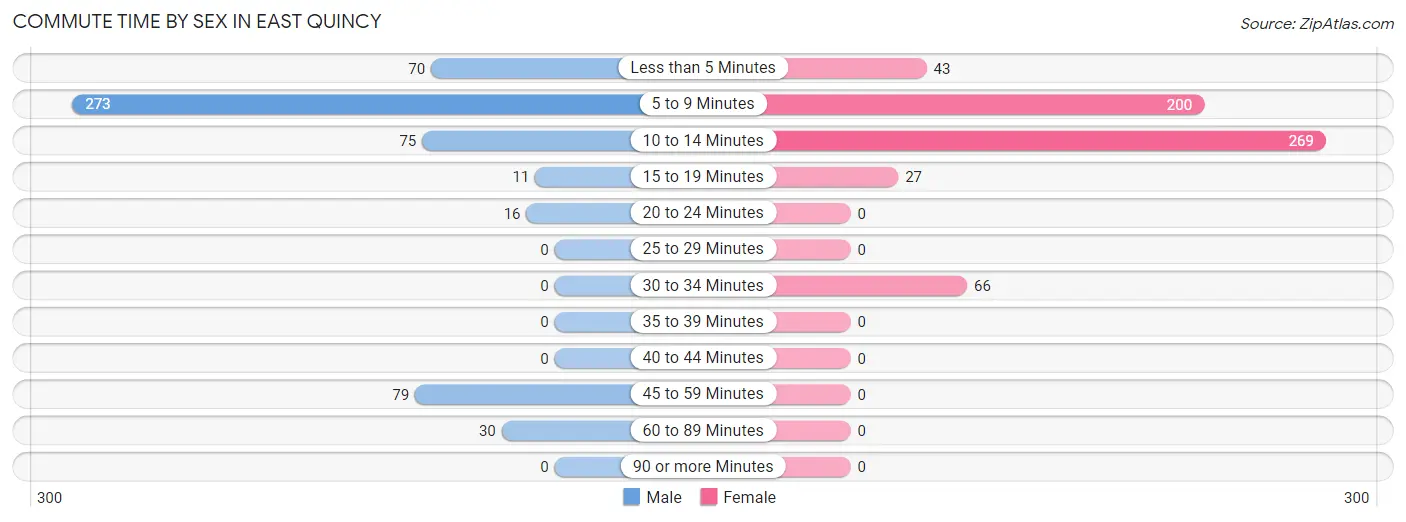
| Commute Time | Male | Female |
| Less than 5 Minutes | 70 (12.6%) | 43 (7.1%) |
| 5 to 9 Minutes | 273 (49.3%) | 200 (33.1%) |
| 10 to 14 Minutes | 75 (13.5%) | 269 (44.5%) |
| 15 to 19 Minutes | 11 (2.0%) | 27 (4.5%) |
| 20 to 24 Minutes | 16 (2.9%) | 0 (0.0%) |
| 25 to 29 Minutes | 0 (0.0%) | 0 (0.0%) |
| 30 to 34 Minutes | 0 (0.0%) | 66 (10.9%) |
| 35 to 39 Minutes | 0 (0.0%) | 0 (0.0%) |
| 40 to 44 Minutes | 0 (0.0%) | 0 (0.0%) |
| 45 to 59 Minutes | 79 (14.3%) | 0 (0.0%) |
| 60 to 89 Minutes | 30 (5.4%) | 0 (0.0%) |
| 90 or more Minutes | 0 (0.0%) | 0 (0.0%) |
Time of Departure to Work by Sex in East Quincy
The most frequent times of departure to work in East Quincy are 7:00 AM to 7:29 AM (141, 25.5%) for males and 7:30 AM to 7:59 AM (280, 46.3%) for females.
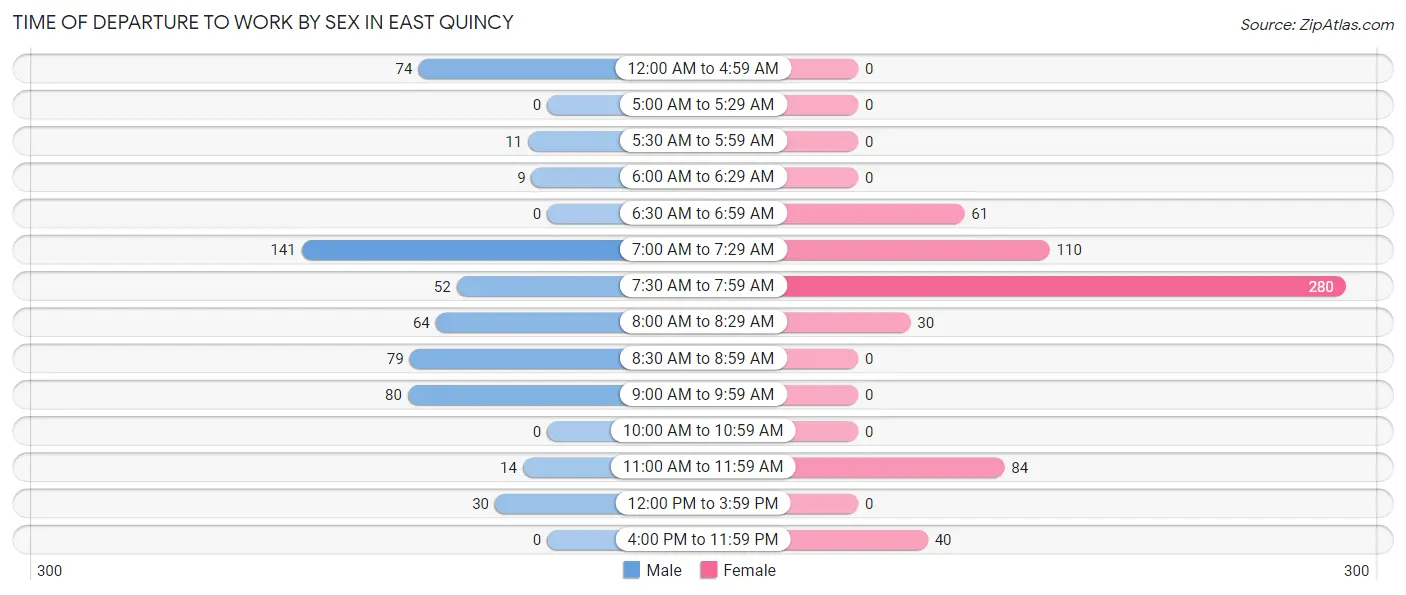
| Time of Departure | Male | Female |
| 12:00 AM to 4:59 AM | 74 (13.4%) | 0 (0.0%) |
| 5:00 AM to 5:29 AM | 0 (0.0%) | 0 (0.0%) |
| 5:30 AM to 5:59 AM | 11 (2.0%) | 0 (0.0%) |
| 6:00 AM to 6:29 AM | 9 (1.6%) | 0 (0.0%) |
| 6:30 AM to 6:59 AM | 0 (0.0%) | 61 (10.1%) |
| 7:00 AM to 7:29 AM | 141 (25.5%) | 110 (18.2%) |
| 7:30 AM to 7:59 AM | 52 (9.4%) | 280 (46.3%) |
| 8:00 AM to 8:29 AM | 64 (11.6%) | 30 (5.0%) |
| 8:30 AM to 8:59 AM | 79 (14.3%) | 0 (0.0%) |
| 9:00 AM to 9:59 AM | 80 (14.4%) | 0 (0.0%) |
| 10:00 AM to 10:59 AM | 0 (0.0%) | 0 (0.0%) |
| 11:00 AM to 11:59 AM | 14 (2.5%) | 84 (13.9%) |
| 12:00 PM to 3:59 PM | 30 (5.4%) | 0 (0.0%) |
| 4:00 PM to 11:59 PM | 0 (0.0%) | 40 (6.6%) |
| Total | 554 (100.0%) | 605 (100.0%) |
Housing Occupancy in East Quincy
Occupancy by Ownership in East Quincy
Of the total 829 dwellings in East Quincy, owner-occupied units account for 533 (64.3%), while renter-occupied units make up 296 (35.7%).
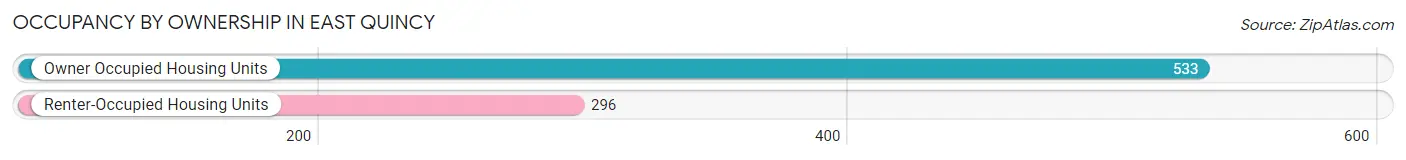
| Occupancy | # Housing Units | % Housing Units |
| Owner Occupied Housing Units | 533 | 64.3% |
| Renter-Occupied Housing Units | 296 | 35.7% |
| Total Occupied Housing Units | 829 | 100.0% |
Occupancy by Household Size in East Quincy
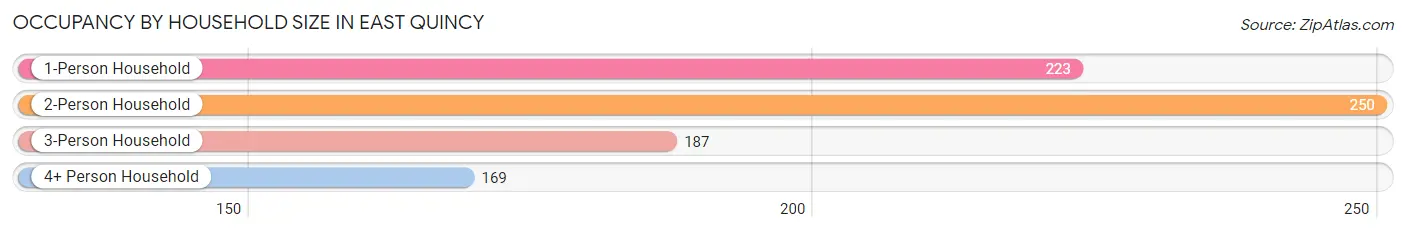
| Household Size | # Housing Units | % Housing Units |
| 1-Person Household | 223 | 26.9% |
| 2-Person Household | 250 | 30.2% |
| 3-Person Household | 187 | 22.6% |
| 4+ Person Household | 169 | 20.4% |
| Total Housing Units | 829 | 100.0% |
Occupancy by Ownership by Household Size in East Quincy
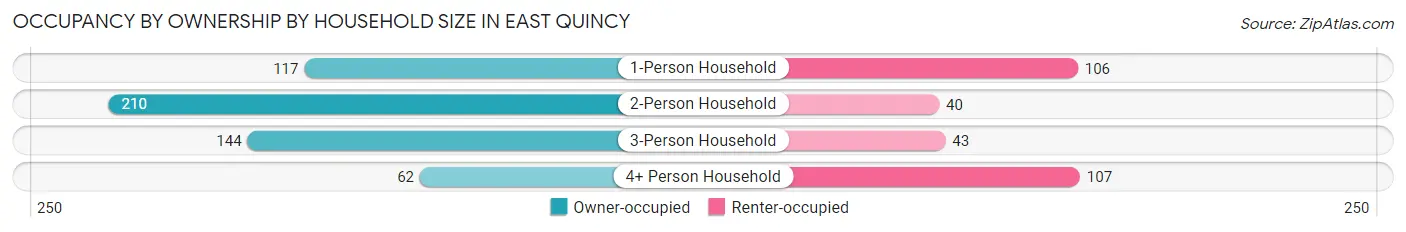
| Household Size | Owner-occupied | Renter-occupied |
| 1-Person Household | 117 (52.5%) | 106 (47.5%) |
| 2-Person Household | 210 (84.0%) | 40 (16.0%) |
| 3-Person Household | 144 (77.0%) | 43 (23.0%) |
| 4+ Person Household | 62 (36.7%) | 107 (63.3%) |
| Total Housing Units | 533 (64.3%) | 296 (35.7%) |
Occupancy by Educational Attainment in East Quincy
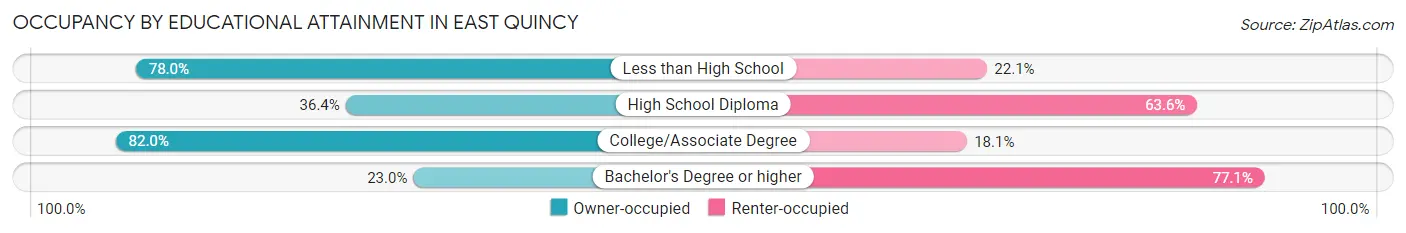
| Household Size | Owner-occupied | Renter-occupied |
| Less than High School | 99 (77.9%) | 28 (22.1%) |
| High School Diploma | 84 (36.4%) | 147 (63.6%) |
| College/Associate Degree | 336 (82.0%) | 74 (18.0%) |
| Bachelor's Degree or higher | 14 (23.0%) | 47 (77.0%) |
Occupancy by Age of Householder in East Quincy
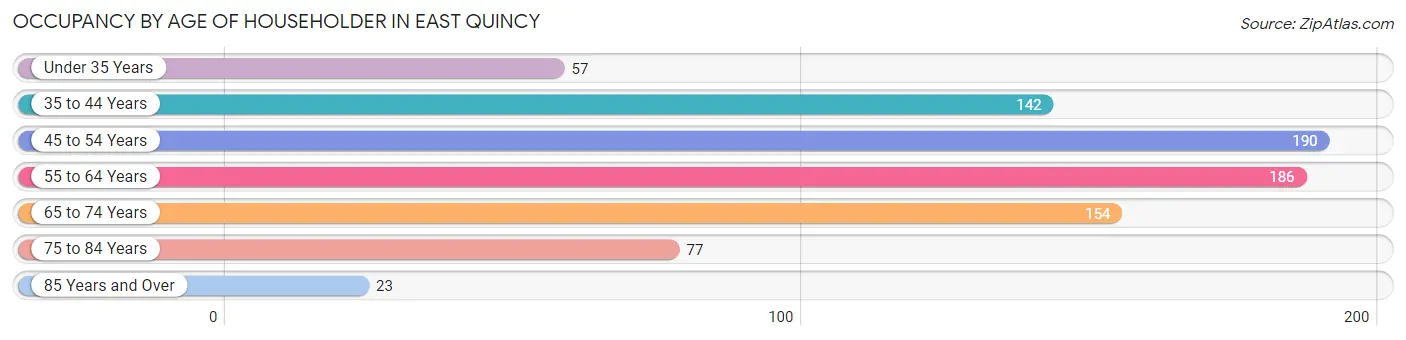
| Age Bracket | # Households | % Households |
| Under 35 Years | 57 | 6.9% |
| 35 to 44 Years | 142 | 17.1% |
| 45 to 54 Years | 190 | 22.9% |
| 55 to 64 Years | 186 | 22.4% |
| 65 to 74 Years | 154 | 18.6% |
| 75 to 84 Years | 77 | 9.3% |
| 85 Years and Over | 23 | 2.8% |
| Total | 829 | 100.0% |
Housing Finances in East Quincy
Median Income by Occupancy in East Quincy
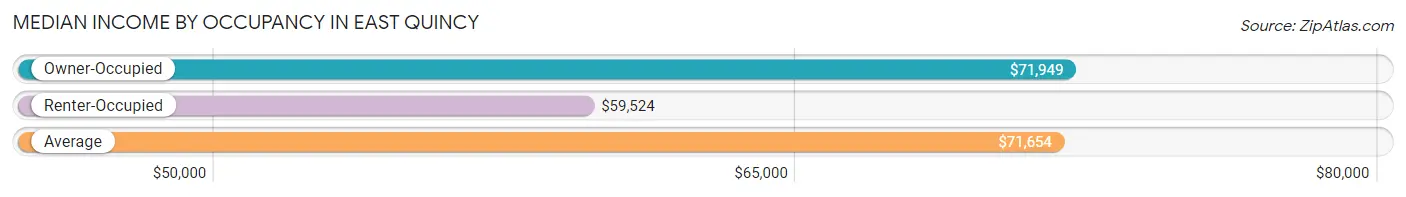
| Occupancy Type | # Households | Median Income |
| Owner-Occupied | 533 (64.3%) | $71,949 |
| Renter-Occupied | 296 (35.7%) | $59,524 |
| Average | 829 (100.0%) | $71,654 |
Occupancy by Householder Income Bracket in East Quincy
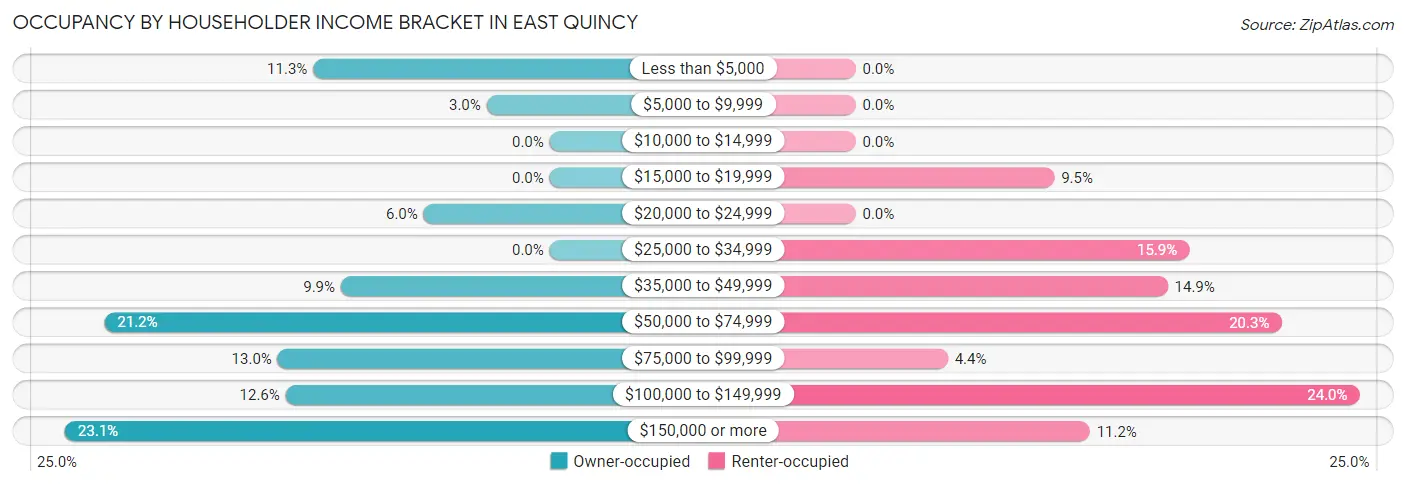
| Income Bracket | Owner-occupied | Renter-occupied |
| Less than $5,000 | 60 (11.3%) | 0 (0.0%) |
| $5,000 to $9,999 | 16 (3.0%) | 0 (0.0%) |
| $10,000 to $14,999 | 0 (0.0%) | 0 (0.0%) |
| $15,000 to $19,999 | 0 (0.0%) | 28 (9.5%) |
| $20,000 to $24,999 | 32 (6.0%) | 0 (0.0%) |
| $25,000 to $34,999 | 0 (0.0%) | 47 (15.9%) |
| $35,000 to $49,999 | 53 (9.9%) | 44 (14.9%) |
| $50,000 to $74,999 | 113 (21.2%) | 60 (20.3%) |
| $75,000 to $99,999 | 69 (13.0%) | 13 (4.4%) |
| $100,000 to $149,999 | 67 (12.6%) | 71 (24.0%) |
| $150,000 or more | 123 (23.1%) | 33 (11.2%) |
| Total | 533 (100.0%) | 296 (100.0%) |
Monthly Housing Cost Tiers in East Quincy
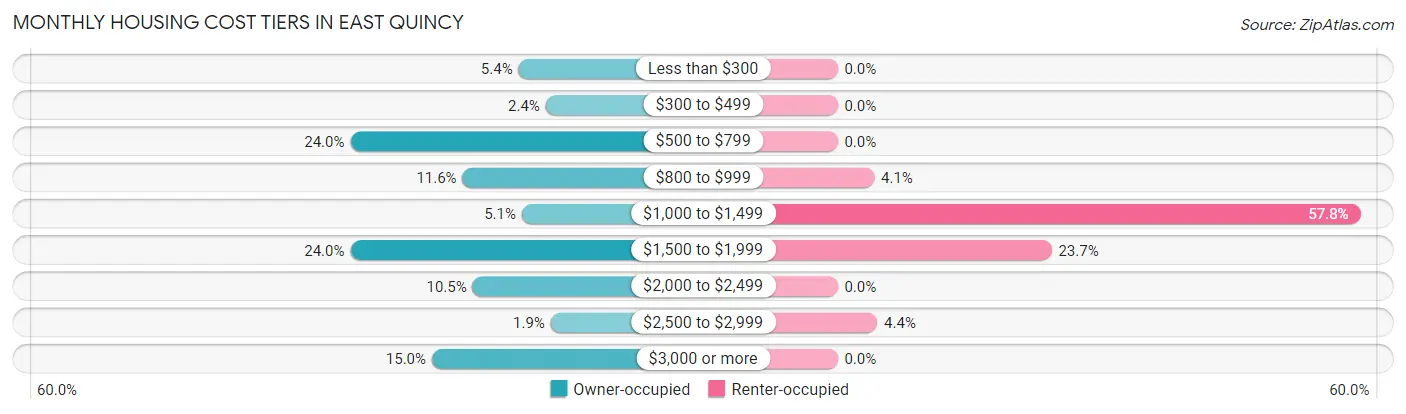
| Monthly Cost | Owner-occupied | Renter-occupied |
| Less than $300 | 29 (5.4%) | 0 (0.0%) |
| $300 to $499 | 13 (2.4%) | 0 (0.0%) |
| $500 to $799 | 128 (24.0%) | 0 (0.0%) |
| $800 to $999 | 62 (11.6%) | 12 (4.1%) |
| $1,000 to $1,499 | 27 (5.1%) | 171 (57.8%) |
| $1,500 to $1,999 | 128 (24.0%) | 70 (23.6%) |
| $2,000 to $2,499 | 56 (10.5%) | 0 (0.0%) |
| $2,500 to $2,999 | 10 (1.9%) | 13 (4.4%) |
| $3,000 or more | 80 (15.0%) | 0 (0.0%) |
| Total | 533 (100.0%) | 296 (100.0%) |
Physical Housing Characteristics in East Quincy
Housing Structures in East Quincy
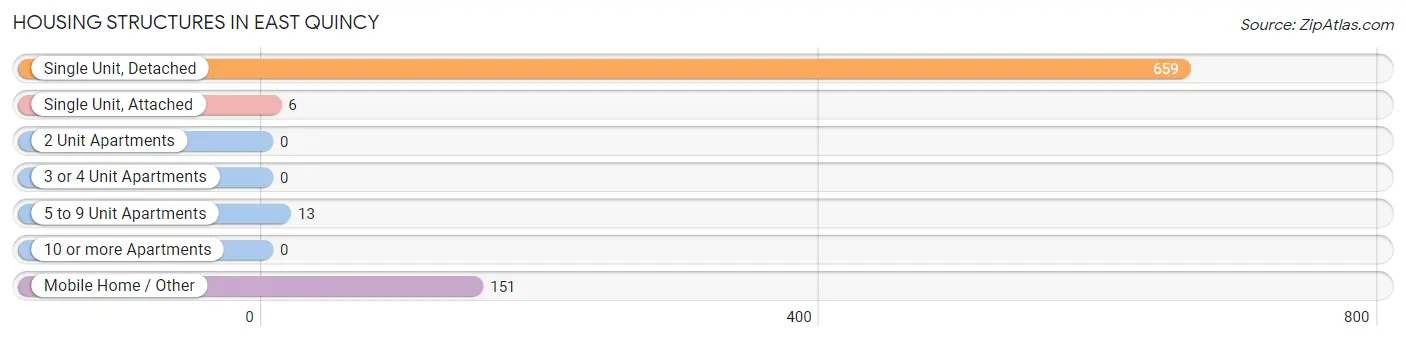
| Structure Type | # Housing Units | % Housing Units |
| Single Unit, Detached | 659 | 79.5% |
| Single Unit, Attached | 6 | 0.7% |
| 2 Unit Apartments | 0 | 0.0% |
| 3 or 4 Unit Apartments | 0 | 0.0% |
| 5 to 9 Unit Apartments | 13 | 1.6% |
| 10 or more Apartments | 0 | 0.0% |
| Mobile Home / Other | 151 | 18.2% |
| Total | 829 | 100.0% |
Housing Structures by Occupancy in East Quincy
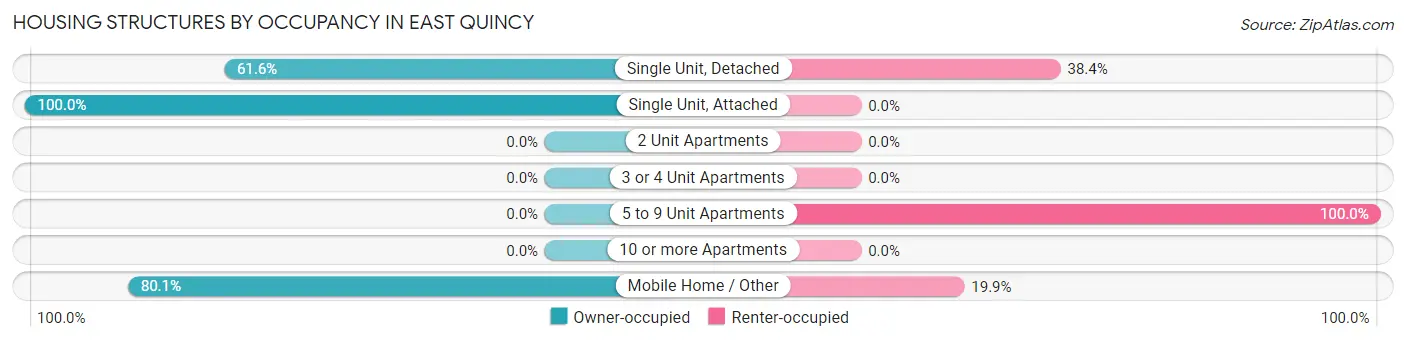
| Structure Type | Owner-occupied | Renter-occupied |
| Single Unit, Detached | 406 (61.6%) | 253 (38.4%) |
| Single Unit, Attached | 6 (100.0%) | 0 (0.0%) |
| 2 Unit Apartments | 0 (0.0%) | 0 (0.0%) |
| 3 or 4 Unit Apartments | 0 (0.0%) | 0 (0.0%) |
| 5 to 9 Unit Apartments | 0 (0.0%) | 13 (100.0%) |
| 10 or more Apartments | 0 (0.0%) | 0 (0.0%) |
| Mobile Home / Other | 121 (80.1%) | 30 (19.9%) |
| Total | 533 (64.3%) | 296 (35.7%) |
Housing Structures by Number of Rooms in East Quincy
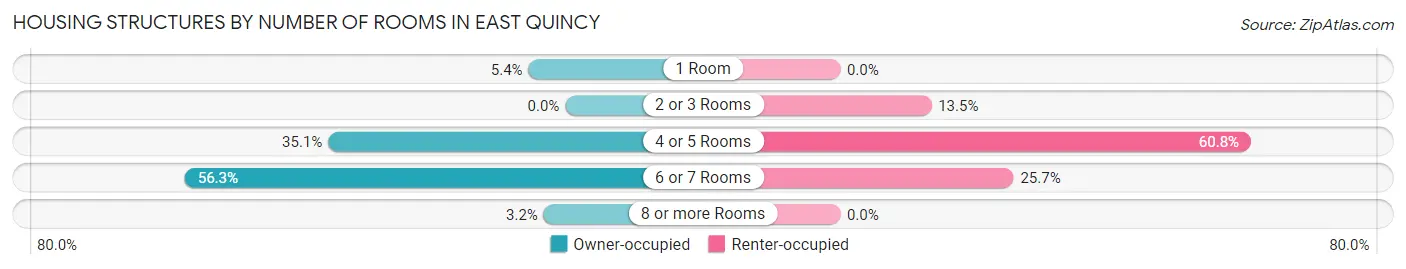
| Number of Rooms | Owner-occupied | Renter-occupied |
| 1 Room | 29 (5.4%) | 0 (0.0%) |
| 2 or 3 Rooms | 0 (0.0%) | 40 (13.5%) |
| 4 or 5 Rooms | 187 (35.1%) | 180 (60.8%) |
| 6 or 7 Rooms | 300 (56.3%) | 76 (25.7%) |
| 8 or more Rooms | 17 (3.2%) | 0 (0.0%) |
| Total | 533 (100.0%) | 296 (100.0%) |
Housing Structure by Heating Type in East Quincy
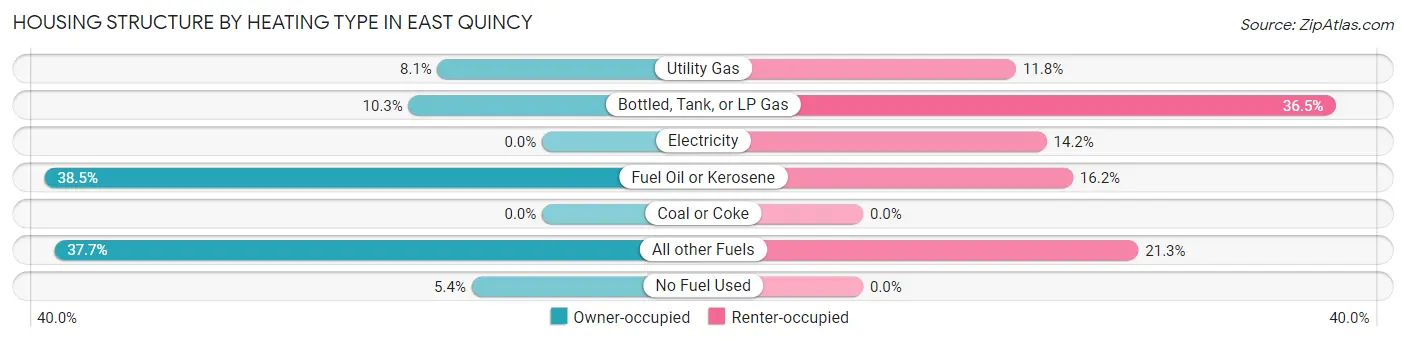
| Heating Type | Owner-occupied | Renter-occupied |
| Utility Gas | 43 (8.1%) | 35 (11.8%) |
| Bottled, Tank, or LP Gas | 55 (10.3%) | 108 (36.5%) |
| Electricity | 0 (0.0%) | 42 (14.2%) |
| Fuel Oil or Kerosene | 205 (38.5%) | 48 (16.2%) |
| Coal or Coke | 0 (0.0%) | 0 (0.0%) |
| All other Fuels | 201 (37.7%) | 63 (21.3%) |
| No Fuel Used | 29 (5.4%) | 0 (0.0%) |
| Total | 533 (100.0%) | 296 (100.0%) |
Household Vehicle Usage in East Quincy
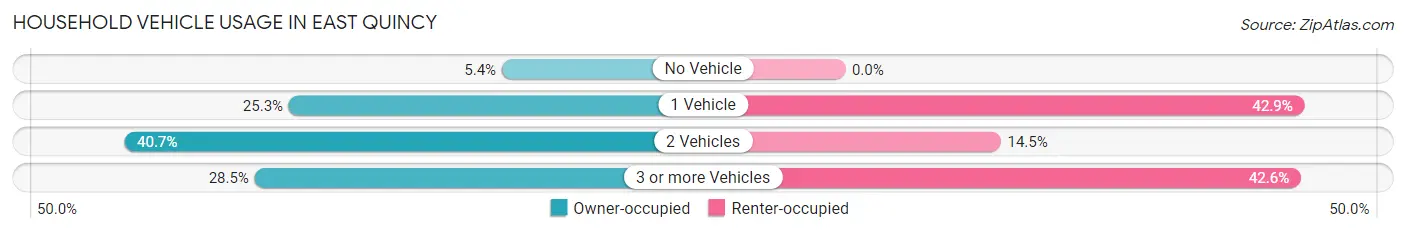
| Vehicles per Household | Owner-occupied | Renter-occupied |
| No Vehicle | 29 (5.4%) | 0 (0.0%) |
| 1 Vehicle | 135 (25.3%) | 127 (42.9%) |
| 2 Vehicles | 217 (40.7%) | 43 (14.5%) |
| 3 or more Vehicles | 152 (28.5%) | 126 (42.6%) |
| Total | 533 (100.0%) | 296 (100.0%) |
Real Estate & Mortgages in East Quincy
Real Estate and Mortgage Overview in East Quincy
| Characteristic | Without Mortgage | With Mortgage |
| Housing Units | 233 | 300 |
| Median Property Value | $248,400 | $279,400 |
| Median Household Income | - | - |
| Monthly Housing Costs | $664 | $64 |
| Real Estate Taxes | $1,385 | $0 |
Property Value by Mortgage Status in East Quincy
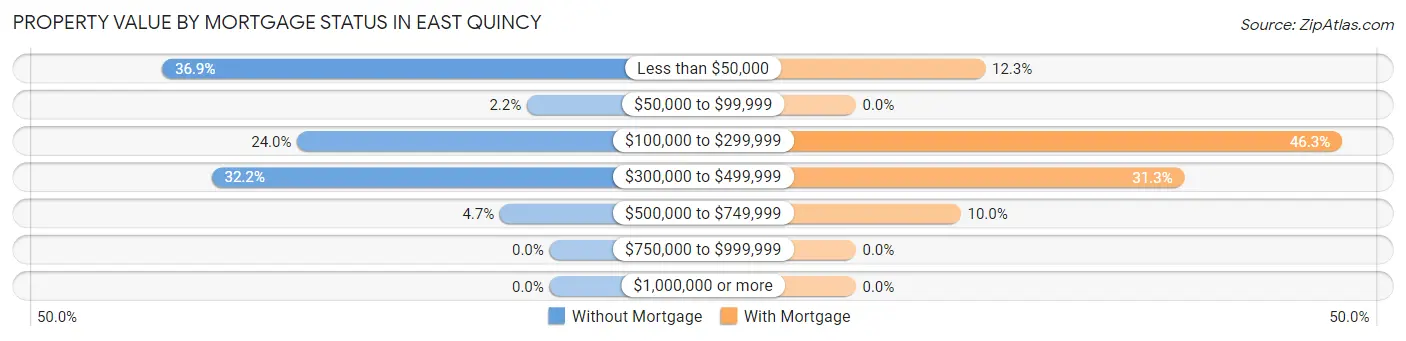
| Property Value | Without Mortgage | With Mortgage |
| Less than $50,000 | 86 (36.9%) | 37 (12.3%) |
| $50,000 to $99,999 | 5 (2.1%) | 0 (0.0%) |
| $100,000 to $299,999 | 56 (24.0%) | 139 (46.3%) |
| $300,000 to $499,999 | 75 (32.2%) | 94 (31.3%) |
| $500,000 to $749,999 | 11 (4.7%) | 30 (10.0%) |
| $750,000 to $999,999 | 0 (0.0%) | 0 (0.0%) |
| $1,000,000 or more | 0 (0.0%) | 0 (0.0%) |
| Total | 233 (100.0%) | 300 (100.0%) |
Household Income by Mortgage Status in East Quincy
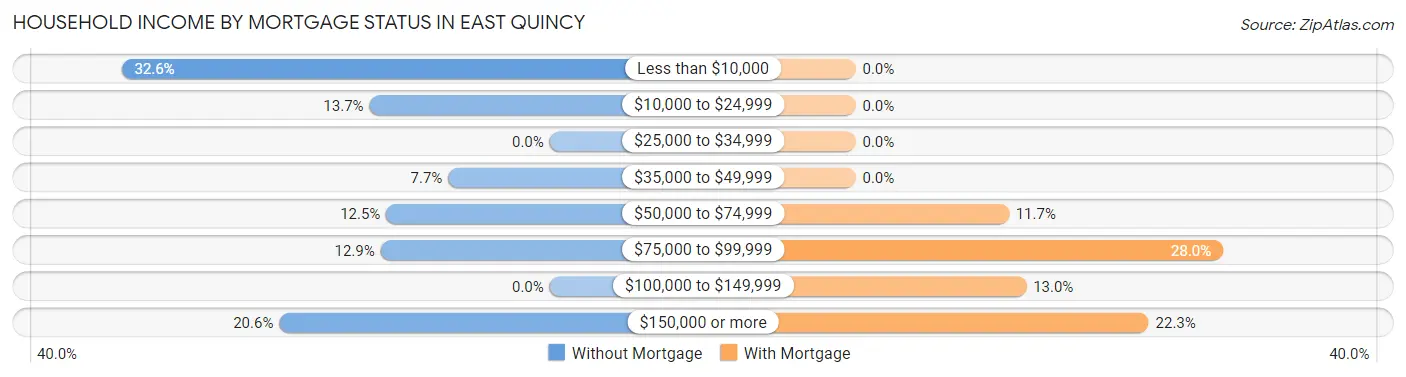
| Household Income | Without Mortgage | With Mortgage |
| Less than $10,000 | 76 (32.6%) | 0 (0.0%) |
| $10,000 to $24,999 | 32 (13.7%) | 0 (0.0%) |
| $25,000 to $34,999 | 0 (0.0%) | 0 (0.0%) |
| $35,000 to $49,999 | 18 (7.7%) | 0 (0.0%) |
| $50,000 to $74,999 | 29 (12.4%) | 35 (11.7%) |
| $75,000 to $99,999 | 30 (12.9%) | 84 (28.0%) |
| $100,000 to $149,999 | 0 (0.0%) | 39 (13.0%) |
| $150,000 or more | 48 (20.6%) | 67 (22.3%) |
| Total | 233 (100.0%) | 300 (100.0%) |
Property Value to Household Income Ratio in East Quincy
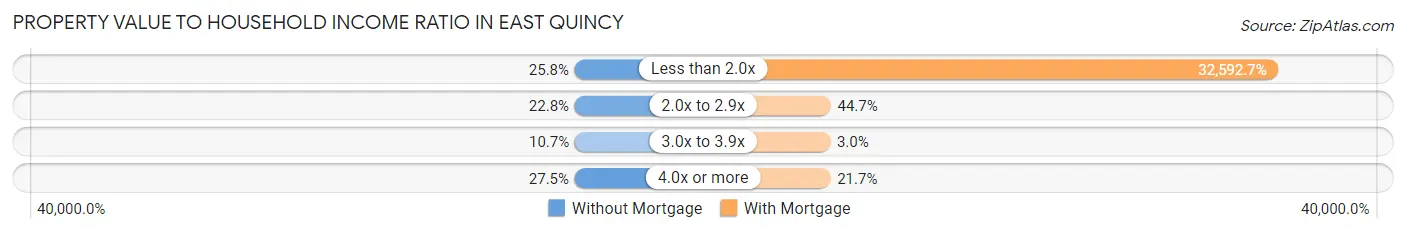
| Value-to-Income Ratio | Without Mortgage | With Mortgage |
| Less than 2.0x | 60 (25.8%) | 97,778 (32,592.7%) |
| 2.0x to 2.9x | 53 (22.8%) | 134 (44.7%) |
| 3.0x to 3.9x | 25 (10.7%) | 9 (3.0%) |
| 4.0x or more | 64 (27.5%) | 65 (21.7%) |
| Total | 233 (100.0%) | 300 (100.0%) |
Real Estate Taxes by Mortgage Status in East Quincy
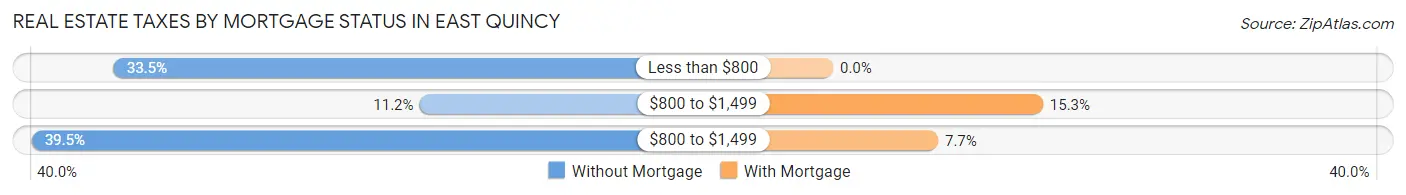
| Property Taxes | Without Mortgage | With Mortgage |
| Less than $800 | 78 (33.5%) | 0 (0.0%) |
| $800 to $1,499 | 26 (11.2%) | 46 (15.3%) |
| $800 to $1,499 | 92 (39.5%) | 23 (7.7%) |
| Total | 233 (100.0%) | 300 (100.0%) |
Health & Disability in East Quincy
Health Insurance Coverage by Age in East Quincy
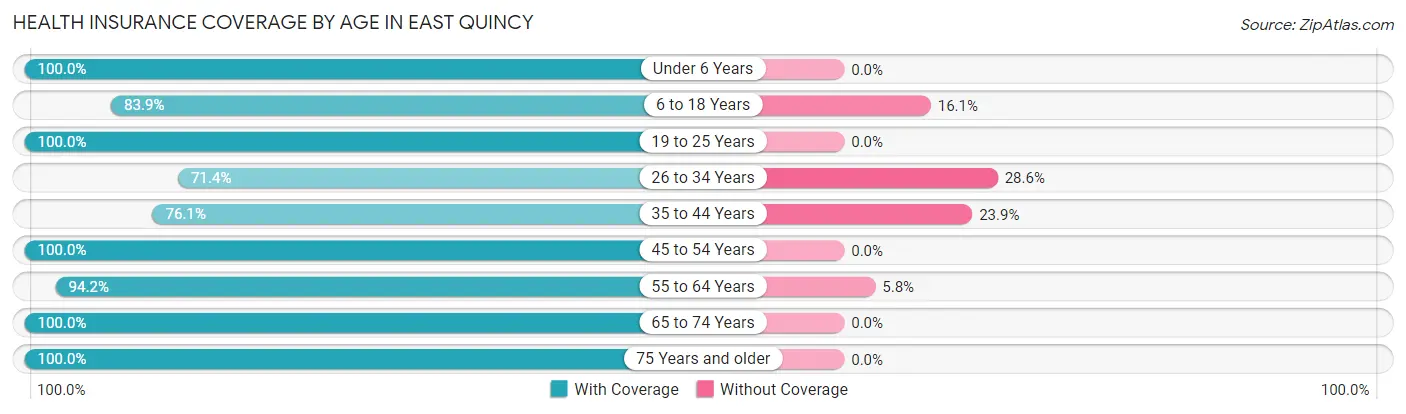
| Age Bracket | With Coverage | Without Coverage |
| Under 6 Years | 101 (100.0%) | 0 (0.0%) |
| 6 to 18 Years | 338 (83.9%) | 65 (16.1%) |
| 19 to 25 Years | 175 (100.0%) | 0 (0.0%) |
| 26 to 34 Years | 252 (71.4%) | 101 (28.6%) |
| 35 to 44 Years | 233 (76.1%) | 73 (23.9%) |
| 45 to 54 Years | 235 (100.0%) | 0 (0.0%) |
| 55 to 64 Years | 358 (94.2%) | 22 (5.8%) |
| 65 to 74 Years | 201 (100.0%) | 0 (0.0%) |
| 75 Years and older | 190 (100.0%) | 0 (0.0%) |
| Total | 2,083 (88.9%) | 261 (11.1%) |
Health Insurance Coverage by Citizenship Status in East Quincy
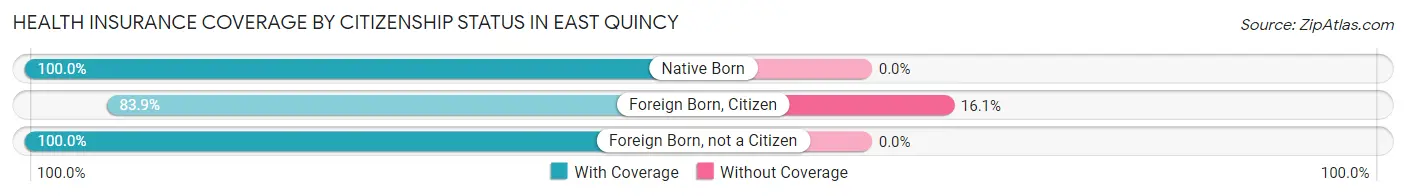
| Citizenship Status | With Coverage | Without Coverage |
| Native Born | 101 (100.0%) | 0 (0.0%) |
| Foreign Born, Citizen | 338 (83.9%) | 65 (16.1%) |
| Foreign Born, not a Citizen | 175 (100.0%) | 0 (0.0%) |
Health Insurance Coverage by Household Income in East Quincy
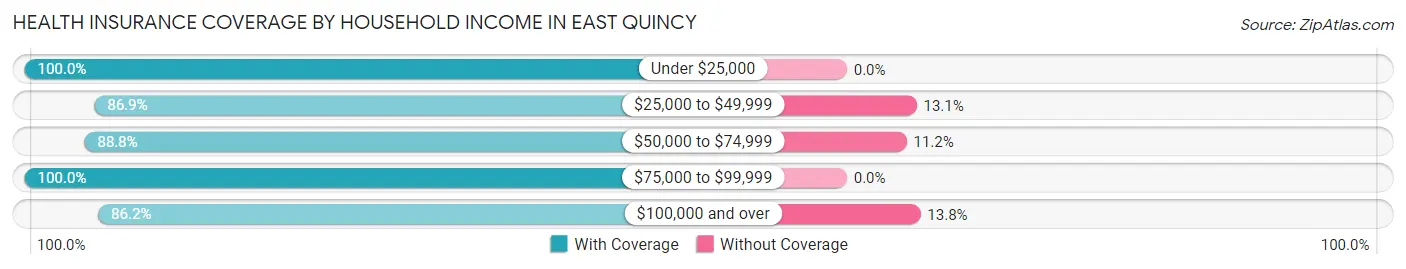
| Household Income | With Coverage | Without Coverage |
| Under $25,000 | 158 (100.0%) | 0 (0.0%) |
| $25,000 to $49,999 | 293 (86.9%) | 44 (13.1%) |
| $50,000 to $74,999 | 452 (88.8%) | 57 (11.2%) |
| $75,000 to $99,999 | 180 (100.0%) | 0 (0.0%) |
| $100,000 and over | 1,000 (86.2%) | 160 (13.8%) |
Public vs Private Health Insurance Coverage by Age in East Quincy
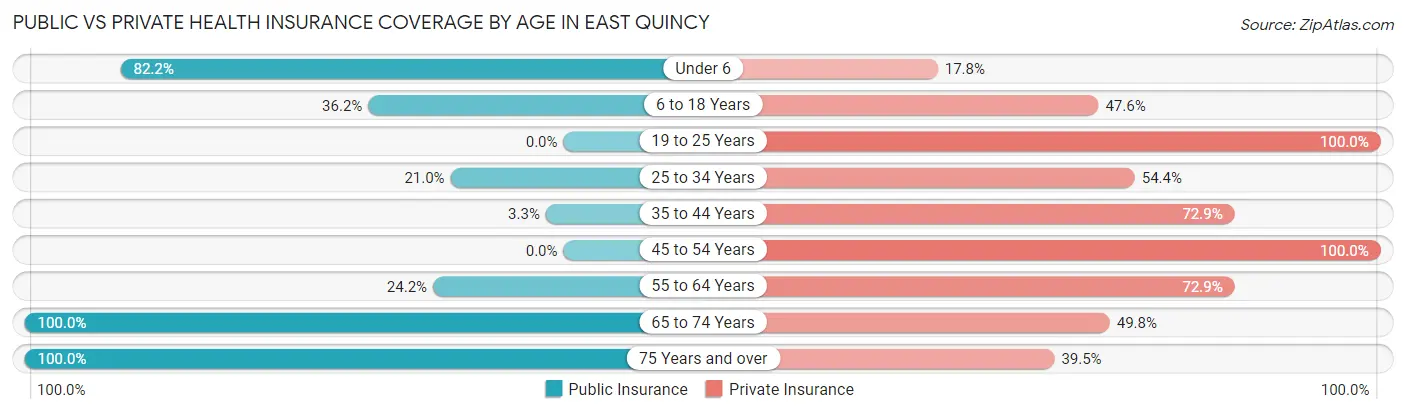
| Age Bracket | Public Insurance | Private Insurance |
| Under 6 | 83 (82.2%) | 18 (17.8%) |
| 6 to 18 Years | 146 (36.2%) | 192 (47.6%) |
| 19 to 25 Years | 0 (0.0%) | 175 (100.0%) |
| 25 to 34 Years | 74 (21.0%) | 192 (54.4%) |
| 35 to 44 Years | 10 (3.3%) | 223 (72.9%) |
| 45 to 54 Years | 0 (0.0%) | 235 (100.0%) |
| 55 to 64 Years | 92 (24.2%) | 277 (72.9%) |
| 65 to 74 Years | 201 (100.0%) | 100 (49.7%) |
| 75 Years and over | 190 (100.0%) | 75 (39.5%) |
| Total | 796 (34.0%) | 1,487 (63.4%) |
Disability Status by Sex by Age in East Quincy
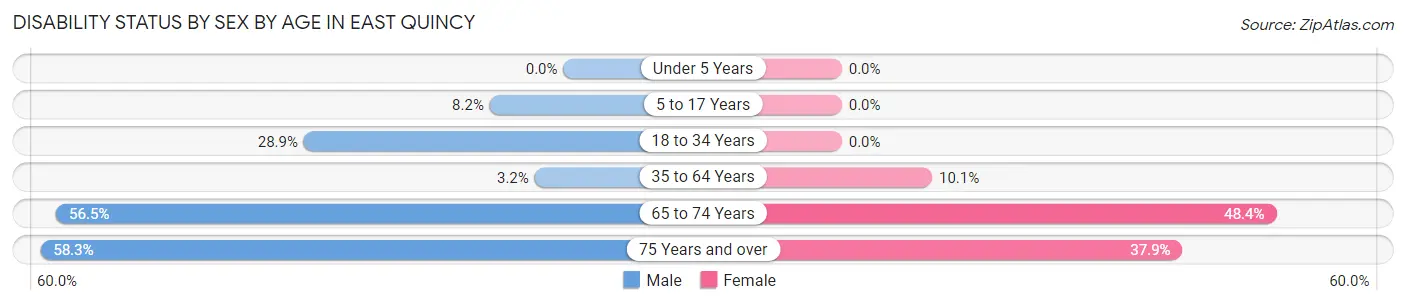
| Age Bracket | Male | Female |
| Under 5 Years | 0 (0.0%) | 0 (0.0%) |
| 5 to 17 Years | 31 (8.2%) | 0 (0.0%) |
| 18 to 34 Years | 74 (28.9%) | 0 (0.0%) |
| 35 to 64 Years | 11 (3.2%) | 58 (10.1%) |
| 65 to 74 Years | 61 (56.5%) | 45 (48.4%) |
| 75 Years and over | 60 (58.3%) | 33 (37.9%) |
Disability Class by Sex by Age in East Quincy
Disability Class: Hearing Difficulty
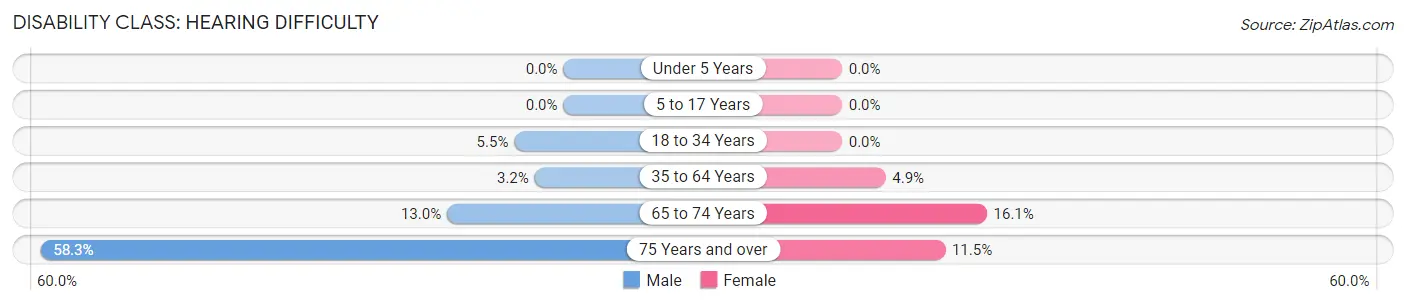
| Age Bracket | Male | Female |
| Under 5 Years | 0 (0.0%) | 0 (0.0%) |
| 5 to 17 Years | 0 (0.0%) | 0 (0.0%) |
| 18 to 34 Years | 14 (5.5%) | 0 (0.0%) |
| 35 to 64 Years | 11 (3.2%) | 28 (4.9%) |
| 65 to 74 Years | 14 (13.0%) | 15 (16.1%) |
| 75 Years and over | 60 (58.3%) | 10 (11.5%) |
Disability Class: Vision Difficulty
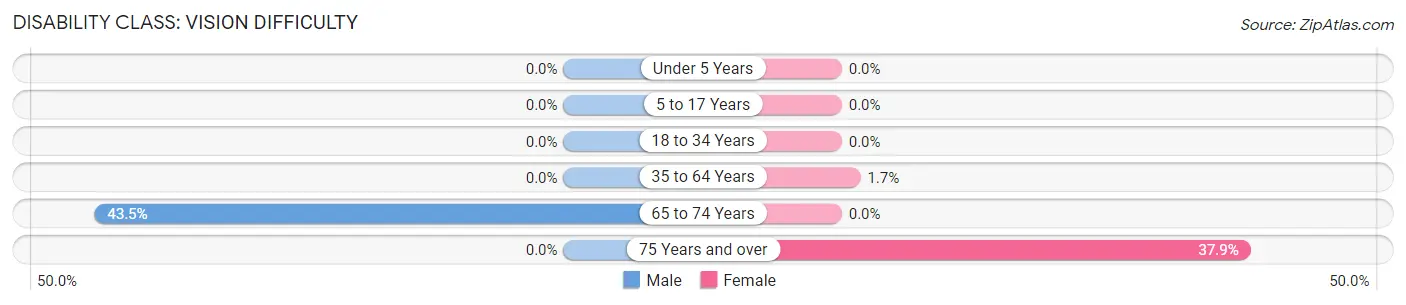
| Age Bracket | Male | Female |
| Under 5 Years | 0 (0.0%) | 0 (0.0%) |
| 5 to 17 Years | 0 (0.0%) | 0 (0.0%) |
| 18 to 34 Years | 0 (0.0%) | 0 (0.0%) |
| 35 to 64 Years | 0 (0.0%) | 10 (1.7%) |
| 65 to 74 Years | 47 (43.5%) | 0 (0.0%) |
| 75 Years and over | 0 (0.0%) | 33 (37.9%) |
Disability Class: Cognitive Difficulty
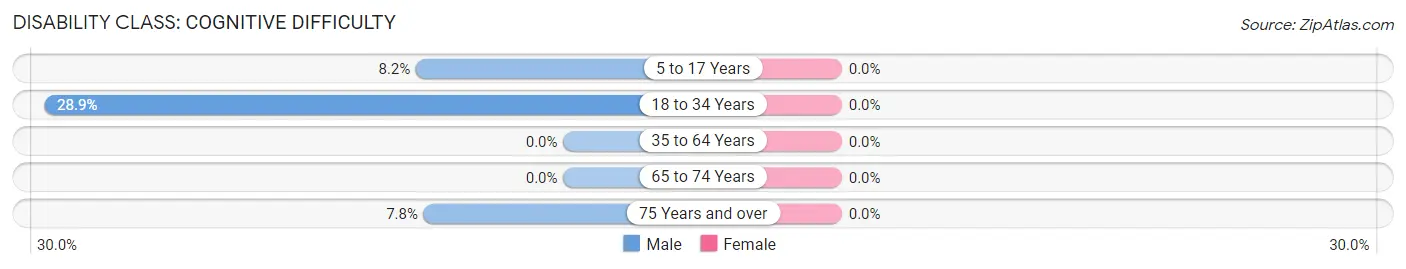
| Age Bracket | Male | Female |
| 5 to 17 Years | 31 (8.2%) | 0 (0.0%) |
| 18 to 34 Years | 74 (28.9%) | 0 (0.0%) |
| 35 to 64 Years | 0 (0.0%) | 0 (0.0%) |
| 65 to 74 Years | 0 (0.0%) | 0 (0.0%) |
| 75 Years and over | 8 (7.8%) | 0 (0.0%) |
Disability Class: Ambulatory Difficulty
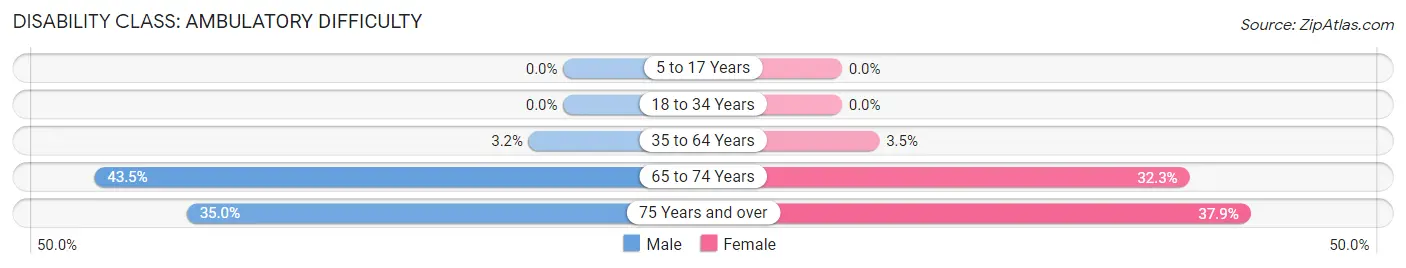
| Age Bracket | Male | Female |
| 5 to 17 Years | 0 (0.0%) | 0 (0.0%) |
| 18 to 34 Years | 0 (0.0%) | 0 (0.0%) |
| 35 to 64 Years | 11 (3.2%) | 20 (3.5%) |
| 65 to 74 Years | 47 (43.5%) | 30 (32.3%) |
| 75 Years and over | 36 (34.9%) | 33 (37.9%) |
Disability Class: Self-Care Difficulty
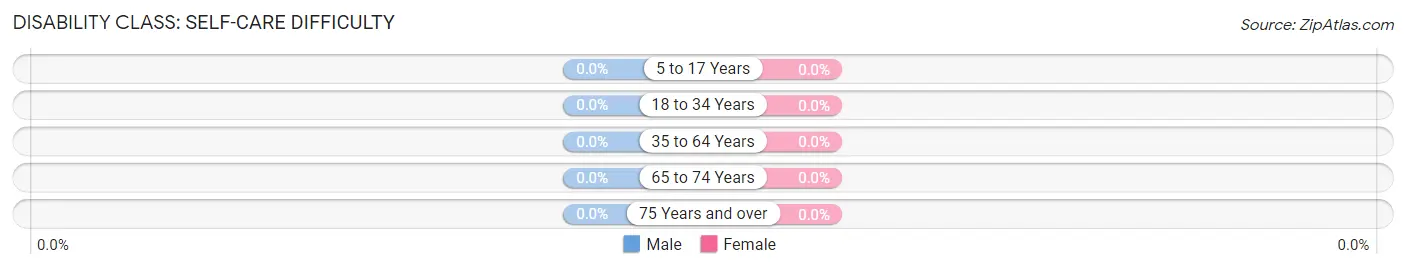
| Age Bracket | Male | Female |
| 5 to 17 Years | 0 (0.0%) | 0 (0.0%) |
| 18 to 34 Years | 0 (0.0%) | 0 (0.0%) |
| 35 to 64 Years | 0 (0.0%) | 0 (0.0%) |
| 65 to 74 Years | 0 (0.0%) | 0 (0.0%) |
| 75 Years and over | 0 (0.0%) | 0 (0.0%) |
Technology Access in East Quincy
Computing Device Access in East Quincy
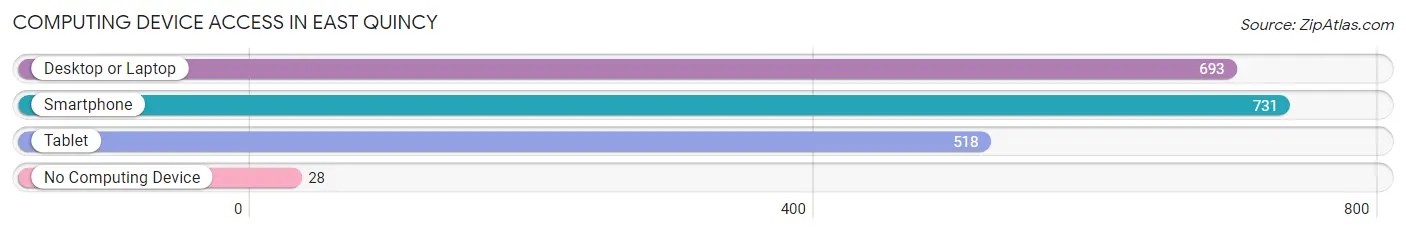
| Device Type | # Households | % Households |
| Desktop or Laptop | 693 | 83.6% |
| Smartphone | 731 | 88.2% |
| Tablet | 518 | 62.5% |
| No Computing Device | 28 | 3.4% |
| Total | 829 | 100.0% |
Internet Access in East Quincy
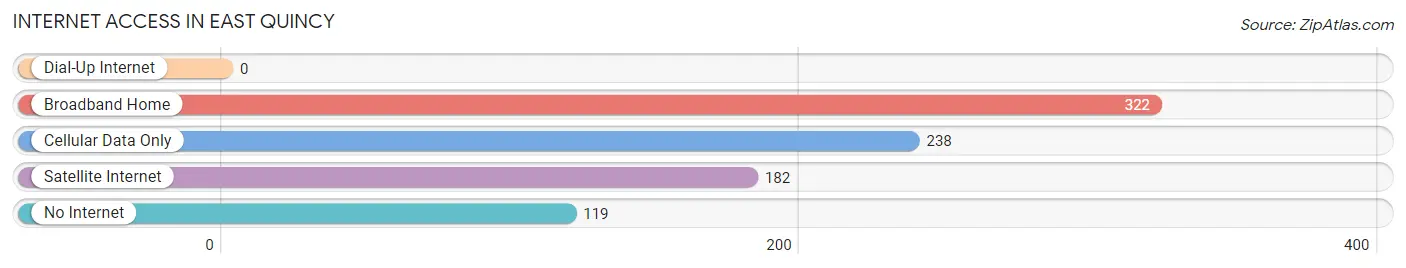
| Internet Type | # Households | % Households |
| Dial-Up Internet | 0 | 0.0% |
| Broadband Home | 322 | 38.8% |
| Cellular Data Only | 238 | 28.7% |
| Satellite Internet | 182 | 22.0% |
| No Internet | 119 | 14.3% |
| Total | 829 | 100.0% |
East Quincy Summary
Quincy is a small town located in Plumas County, California, United States. It is situated in the Sierra Nevada mountain range, at an elevation of 4,945 feet (1,507 m). The population was 5,912 at the 2010 census, up from 5,530 at the 2000 census.
History
The area that is now Quincy was originally inhabited by the Maidu and Washoe Native American tribes. The first European settlers arrived in the area in the 1850s, and the town was officially founded in 1855. It was named after John Quincy Adams, the sixth president of the United States.
The town quickly grew, and by the late 19th century, it had become a major center for logging and mining. The town was also home to a large Chinese population, who worked in the mines and on the railroads.
Geography
Quincy is located in the Sierra Nevada mountain range, at an elevation of 4,945 feet (1,507 m). It is situated in the Feather River Canyon, at the confluence of the North Fork and Middle Fork of the Feather River. The town is surrounded by the Plumas National Forest.
The climate in Quincy is characterized by warm, dry summers and cold, snowy winters. The average annual precipitation is 22.5 inches (572 mm).
Economy
Quincy’s economy is largely based on tourism, logging, and mining. The town is home to several tourist attractions, including the Plumas County Museum, the Quincy Historical Society, and the Plumas County Fairgrounds.
Logging is still an important industry in Quincy, and the town is home to several sawmills and lumber yards. Mining is also an important part of the local economy, with several gold and silver mines in the area.
Demographics
As of the 2010 census, there were 5,912 people, 2,521 households, and 1,541 families residing in Quincy. The population density was 545.3 people per square mile (210.9/km2). The racial makeup of the town was 87.2% White, 0.7% African American, 2.2% Native American, 0.7% Asian, 0.1% Pacific Islander, 5.7% from other races, and 3.4% from two or more races. Hispanic or Latino of any race were 11.3% of the population.
The median income for a household in Quincy was $35,938, and the median income for a family was $41,944. Males had a median income of $35,938 versus $25,938 for females. The per capita income for the town was $17,938. About 11.3% of families and 14.2% of the population were below the poverty line, including 19.2% of those under age 18 and 8.2% of those age 65 or over.
Common Questions
What is Per Capita Income in East Quincy?
Per Capita income in East Quincy is $36,560.
What is the Median Family Income in East Quincy?
Median Family Income in East Quincy is $89,766.
What is the Median Household income in East Quincy?
Median Household Income in East Quincy is $71,654.
What is Income or Wage Gap in East Quincy?
Income or Wage Gap in East Quincy is 36.8%.
Women in East Quincy earn 63.2 cents for every dollar earned by a man.
What is Inequality or Gini Index in East Quincy?
Inequality or Gini Index in East Quincy is 0.43.
What is the Total Population of East Quincy?
Total Population of East Quincy is 2,399.
What is the Total Male Population of East Quincy?
Total Male Population of East Quincy is 1,303.
What is the Total Female Population of East Quincy?
Total Female Population of East Quincy is 1,096.
What is the Ratio of Males per 100 Females in East Quincy?
There are 118.89 Males per 100 Females in East Quincy.
What is the Ratio of Females per 100 Males in East Quincy?
There are 84.11 Females per 100 Males in East Quincy.
What is the Median Population Age in East Quincy?
Median Population Age in East Quincy is 41.1 Years.
What is the Average Family Size in East Quincy
Average Family Size in East Quincy is 3.1 People.
What is the Average Household Size in East Quincy
Average Household Size in East Quincy is 2.9 People.
How Large is the Labor Force in East Quincy?
There are 1,241 People in the Labor Forcein in East Quincy.
What is the Percentage of People in the Labor Force in East Quincy?
65.5% of People are in the Labor Force in East Quincy.
What is the Unemployment Rate in East Quincy?
Unemployment Rate in East Quincy is 1.2%.