Cities with the Highest Percentage of Population Employed in Real Estate, Rental & Leasing in Utah
RELATED REPORTS & OPTIONS
Real Estate, Rental & Leasing
Utah
Compare Cities
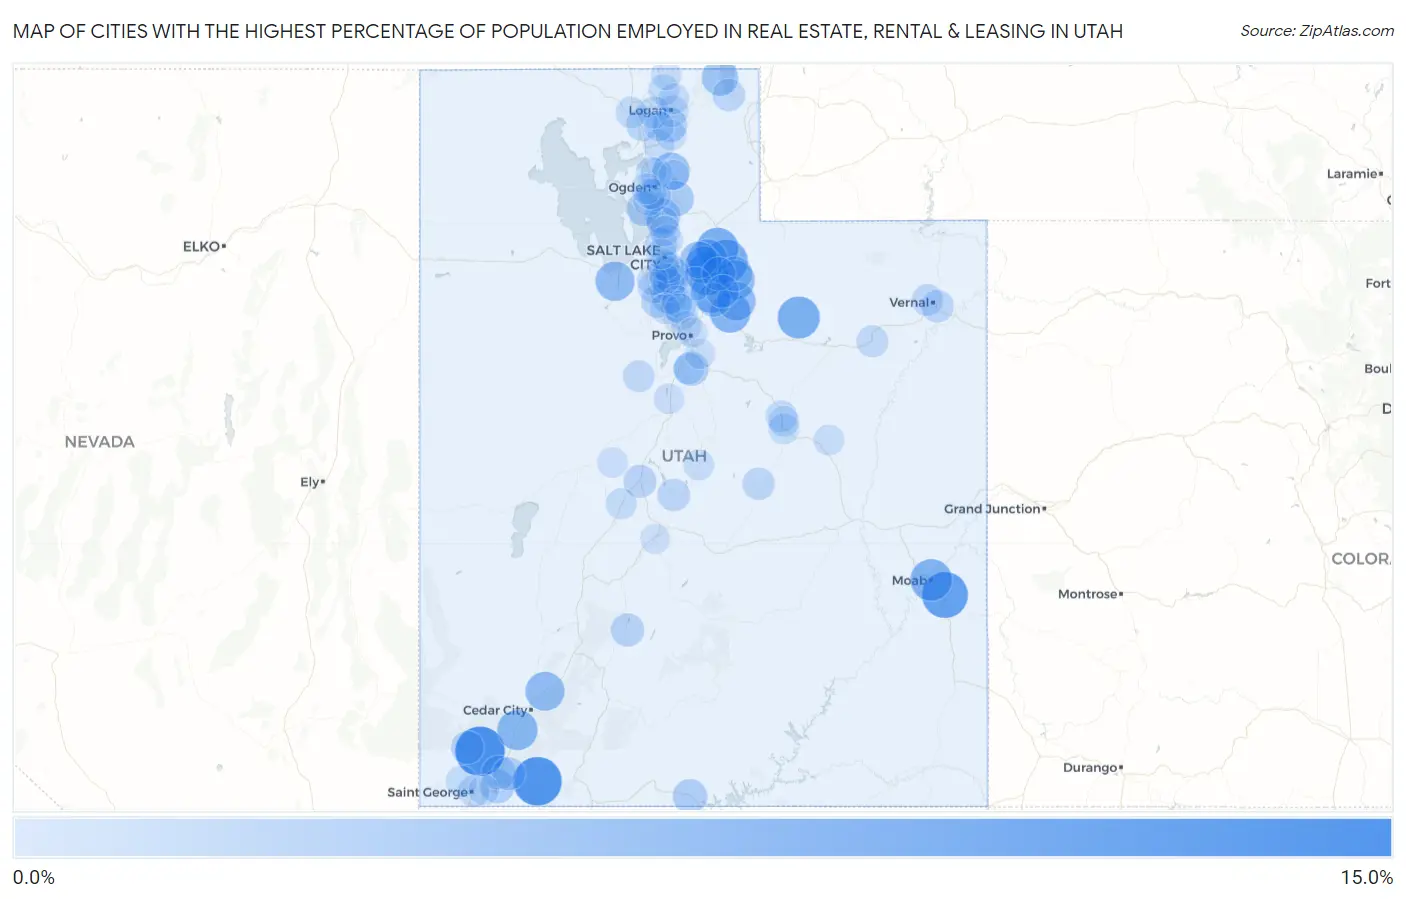
Map of Cities with the Highest Percentage of Population Employed in Real Estate, Rental & Leasing in Utah
0.0%
15.0%
Cities with the Highest Percentage of Population Employed in Real Estate, Rental & Leasing in Utah
| City | % Employed | vs State | vs National | |
| 1. | Pine Valley | 14.3% | 2.0%(+12.3)#1 | 1.9%(+12.4)#267 |
| 2. | Springdale | 13.6% | 2.0%(+11.7)#2 | 1.9%(+11.7)#292 |
| 3. | Spanish Valley | 11.8% | 2.0%(+9.86)#3 | 1.9%(+9.95)#386 |
| 4. | Peoa | 10.0% | 2.0%(+8.02)#4 | 1.9%(+8.11)#538 |
| 5. | Park City | 9.8% | 2.0%(+7.81)#5 | 1.9%(+7.90)#560 |
| 6. | Wanship | 9.4% | 2.0%(+7.39)#6 | 1.9%(+7.48)#599 |
| 7. | Tabiona | 9.4% | 2.0%(+7.39)#7 | 1.9%(+7.48)#600 |
| 8. | Moab | 9.1% | 2.0%(+7.13)#8 | 1.9%(+7.22)#634 |
| 9. | Midway | 8.4% | 2.0%(+6.45)#9 | 1.9%(+6.54)#738 |
| 10. | Independence | 8.3% | 2.0%(+6.35)#10 | 1.9%(+6.44)#755 |
| 11. | Kanarraville | 8.1% | 2.0%(+6.14)#11 | 1.9%(+6.23)#801 |
| 12. | Francis | 7.7% | 2.0%(+5.72)#12 | 1.9%(+5.81)#879 |
| 13. | Erda | 7.5% | 2.0%(+5.49)#13 | 1.9%(+5.58)#937 |
| 14. | Silver Summit | 7.4% | 2.0%(+5.44)#14 | 1.9%(+5.54)#946 |
| 15. | Summit | 7.4% | 2.0%(+5.42)#15 | 1.9%(+5.52)#950 |
| 16. | Timber Lakes | 7.1% | 2.0%(+5.13)#16 | 1.9%(+5.23)#1,018 |
| 17. | Snyderville | 6.2% | 2.0%(+4.26)#17 | 1.9%(+4.36)#1,279 |
| 18. | Wolf Creek | 6.2% | 2.0%(+4.22)#18 | 1.9%(+4.31)#1,295 |
| 19. | Summit Park | 6.0% | 2.0%(+4.01)#19 | 1.9%(+4.10)#1,379 |
| 20. | Garden City | 5.7% | 2.0%(+3.68)#20 | 1.9%(+3.77)#1,518 |
| 21. | East Basin | 5.2% | 2.0%(+3.26)#21 | 1.9%(+3.35)#1,720 |
| 22. | Fruit Heights | 5.1% | 2.0%(+3.16)#22 | 1.9%(+3.25)#1,784 |
| 23. | Mountain Green | 4.9% | 2.0%(+2.96)#23 | 1.9%(+3.05)#1,892 |
| 24. | Kamas | 4.6% | 2.0%(+2.58)#24 | 1.9%(+2.67)#2,160 |
| 25. | Big Water | 4.4% | 2.0%(+2.43)#25 | 1.9%(+2.53)#2,276 |
| 26. | Draper | 4.4% | 2.0%(+2.39)#26 | 1.9%(+2.48)#2,309 |
| 27. | Woodland Hills | 4.4% | 2.0%(+2.38)#27 | 1.9%(+2.47)#2,314 |
| 28. | Syracuse | 4.3% | 2.0%(+2.36)#28 | 1.9%(+2.45)#2,337 |
| 29. | Hyrum | 4.3% | 2.0%(+2.31)#29 | 1.9%(+2.40)#2,368 |
| 30. | Hurricane | 4.3% | 2.0%(+2.27)#30 | 1.9%(+2.36)#2,400 |
| 31. | Leeds | 4.1% | 2.0%(+2.14)#31 | 1.9%(+2.24)#2,519 |
| 32. | Charleston | 4.0% | 2.0%(+2.05)#32 | 1.9%(+2.14)#2,632 |
| 33. | Alta | 4.0% | 2.0%(+1.99)#33 | 1.9%(+2.08)#2,688 |
| 34. | Hideout | 3.9% | 2.0%(+1.89)#34 | 1.9%(+1.98)#2,808 |
| 35. | Junction | 3.7% | 2.0%(+1.72)#35 | 1.9%(+1.81)#3,015 |
| 36. | Central | 3.6% | 2.0%(+1.60)#36 | 1.9%(+1.69)#3,180 |
| 37. | La Verkin | 3.6% | 2.0%(+1.59)#37 | 1.9%(+1.68)#3,187 |
| 38. | Heber | 3.6% | 2.0%(+1.58)#38 | 1.9%(+1.67)#3,214 |
| 39. | Holladay | 3.5% | 2.0%(+1.55)#39 | 1.9%(+1.65)#3,243 |
| 40. | Scipio | 3.5% | 2.0%(+1.50)#40 | 1.9%(+1.59)#3,309 |
| 41. | Bluffdale | 3.4% | 2.0%(+1.43)#41 | 1.9%(+1.53)#3,400 |
| 42. | Murray | 3.3% | 2.0%(+1.35)#42 | 1.9%(+1.44)#3,510 |
| 43. | Sandy | 3.2% | 2.0%(+1.27)#43 | 1.9%(+1.36)#3,686 |
| 44. | Laketown | 3.2% | 2.0%(+1.22)#44 | 1.9%(+1.31)#3,764 |
| 45. | Honeyville | 3.2% | 2.0%(+1.18)#45 | 1.9%(+1.27)#3,823 |
| 46. | Gunnison | 3.2% | 2.0%(+1.18)#46 | 1.9%(+1.27)#3,824 |
| 47. | Naples | 3.1% | 2.0%(+1.14)#47 | 1.9%(+1.23)#3,903 |
| 48. | Orangeville | 3.1% | 2.0%(+1.12)#48 | 1.9%(+1.21)#3,928 |
| 49. | North Salt Lake | 3.0% | 2.0%(+1.06)#49 | 1.9%(+1.15)#4,040 |
| 50. | Farmington | 3.0% | 2.0%(+1.01)#50 | 1.9%(+1.10)#4,132 |
| 51. | Cottonwood Heights | 2.9% | 2.0%(+0.917)#51 | 1.9%(+1.01)#4,316 |
| 52. | Myton | 2.9% | 2.0%(+0.874)#52 | 1.9%(+0.965)#4,410 |
| 53. | Maeser | 2.8% | 2.0%(+0.863)#53 | 1.9%(+0.954)#4,434 |
| 54. | Mendon | 2.7% | 2.0%(+0.719)#54 | 1.9%(+0.811)#4,773 |
| 55. | South Jordan | 2.7% | 2.0%(+0.714)#55 | 1.9%(+0.805)#4,798 |
| 56. | Eureka | 2.7% | 2.0%(+0.710)#56 | 1.9%(+0.802)#4,802 |
| 57. | Washington Terrace | 2.7% | 2.0%(+0.708)#57 | 1.9%(+0.799)#4,807 |
| 58. | Pleasant Grove | 2.6% | 2.0%(+0.631)#58 | 1.9%(+0.722)#5,028 |
| 59. | North Ogden | 2.6% | 2.0%(+0.630)#59 | 1.9%(+0.722)#5,030 |
| 60. | River Heights | 2.6% | 2.0%(+0.603)#60 | 1.9%(+0.694)#5,096 |
| 61. | Sunset | 2.6% | 2.0%(+0.598)#61 | 1.9%(+0.690)#5,111 |
| 62. | Tremonton | 2.6% | 2.0%(+0.587)#62 | 1.9%(+0.679)#5,153 |
| 63. | Helper | 2.5% | 2.0%(+0.545)#63 | 1.9%(+0.637)#5,270 |
| 64. | Millcreek | 2.5% | 2.0%(+0.494)#64 | 1.9%(+0.585)#5,394 |
| 65. | St George | 2.5% | 2.0%(+0.493)#65 | 1.9%(+0.585)#5,397 |
| 66. | Ivins | 2.5% | 2.0%(+0.467)#66 | 1.9%(+0.559)#5,478 |
| 67. | Mantua | 2.4% | 2.0%(+0.429)#67 | 1.9%(+0.520)#5,602 |
| 68. | Amalga | 2.4% | 2.0%(+0.417)#68 | 1.9%(+0.508)#5,639 |
| 69. | South Salt Lake | 2.4% | 2.0%(+0.408)#69 | 1.9%(+0.500)#5,669 |
| 70. | Holden | 2.4% | 2.0%(+0.398)#70 | 1.9%(+0.489)#5,706 |
| 71. | Highland | 2.4% | 2.0%(+0.383)#71 | 1.9%(+0.475)#5,761 |
| 72. | Bountiful | 2.3% | 2.0%(+0.343)#72 | 1.9%(+0.434)#5,880 |
| 73. | Elk Ridge | 2.3% | 2.0%(+0.341)#73 | 1.9%(+0.433)#5,894 |
| 74. | West Wood | 2.3% | 2.0%(+0.300)#74 | 1.9%(+0.391)#6,015 |
| 75. | Alpine | 2.3% | 2.0%(+0.271)#75 | 1.9%(+0.363)#6,125 |
| 76. | Pleasant View | 2.2% | 2.0%(+0.256)#76 | 1.9%(+0.348)#6,182 |
| 77. | West Jordan | 2.2% | 2.0%(+0.251)#77 | 1.9%(+0.342)#6,198 |
| 78. | Spring Glen | 2.2% | 2.0%(+0.243)#78 | 1.9%(+0.335)#6,221 |
| 79. | Hyde Park | 2.2% | 2.0%(+0.243)#79 | 1.9%(+0.335)#6,222 |
| 80. | Riverdale | 2.2% | 2.0%(+0.222)#80 | 1.9%(+0.314)#6,291 |
| 81. | East Carbon | 2.1% | 2.0%(+0.163)#81 | 1.9%(+0.254)#6,510 |
| 82. | West Haven | 2.1% | 2.0%(+0.159)#82 | 1.9%(+0.250)#6,527 |
| 83. | Ephraim | 2.1% | 2.0%(+0.140)#83 | 1.9%(+0.231)#6,601 |
| 84. | Paradise | 2.1% | 2.0%(+0.111)#84 | 1.9%(+0.203)#6,688 |
| 85. | Midvale | 2.1% | 2.0%(+0.070)#85 | 1.9%(+0.162)#6,836 |
| 86. | White | 2.0% | 2.0%(+0.055)#86 | 1.9%(+0.147)#6,895 |
| 87. | Oak City | 2.0% | 2.0%(+0.037)#87 | 1.9%(+0.128)#6,959 |
| 88. | Lehi | 2.0% | 2.0%(+0.031)#88 | 1.9%(+0.123)#6,983 |
| 89. | Salt Lake City | 2.0% | 2.0%(+0.028)#89 | 1.9%(+0.120)#6,998 |
| 90. | Washington | 2.0% | 2.0%(+0.028)#90 | 1.9%(+0.119)#7,004 |
| 91. | Lewiston | 2.0% | 2.0%(+0.023)#91 | 1.9%(+0.114)#7,022 |
| 92. | Mona | 2.0% | 2.0%(-0.006)#92 | 1.9%(+0.086)#7,148 |
| 93. | Centerville | 2.0% | 2.0%(-0.028)#93 | 1.9%(+0.063)#7,243 |
| 94. | Wellsville | 1.9% | 2.0%(-0.046)#94 | 1.9%(+0.045)#7,303 |
| 95. | Mapleton | 1.9% | 2.0%(-0.061)#95 | 1.9%(+0.031)#7,369 |
| 96. | Orem | 1.9% | 2.0%(-0.064)#96 | 1.9%(+0.028)#7,378 |
| 97. | Cedar Hills | 1.9% | 2.0%(-0.090)#97 | 1.9%(+0.002)#7,469 |
| 98. | Eden | 1.8% | 2.0%(-0.217)#98 | 1.9%(-0.126)#7,976 |
| 99. | Sigurd | 1.8% | 2.0%(-0.229)#99 | 1.9%(-0.137)#8,028 |
| 100. | Provo | 1.7% | 2.0%(-0.240)#100 | 1.9%(-0.148)#8,084 |
Common Questions
What are the Top 10 Cities with the Highest Percentage of Population Employed in Real Estate, Rental & Leasing in Utah?
Top 10 Cities with the Highest Percentage of Population Employed in Real Estate, Rental & Leasing in Utah are:
#1
14.3%
#2
13.6%
#3
11.8%
#4
10.0%
#5
9.8%
#6
9.4%
#7
9.4%
#8
9.1%
#9
8.4%
#10
8.3%
What city has the Highest Percentage of Population Employed in Real Estate, Rental & Leasing in Utah?
Pine Valley has the Highest Percentage of Population Employed in Real Estate, Rental & Leasing in Utah with 14.3%.
What is the Percentage of Population Employed in Real Estate, Rental & Leasing in the State of Utah?
Percentage of Population Employed in Real Estate, Rental & Leasing in Utah is 2.0%.
What is the Percentage of Population Employed in Real Estate, Rental & Leasing in the United States?
Percentage of Population Employed in Real Estate, Rental & Leasing in the United States is 1.9%.