Cities with the Highest Percentage of Population Employed in Real Estate, Rental & Leasing in Mississippi
RELATED REPORTS & OPTIONS
Real Estate, Rental & Leasing
Mississippi
Compare Cities
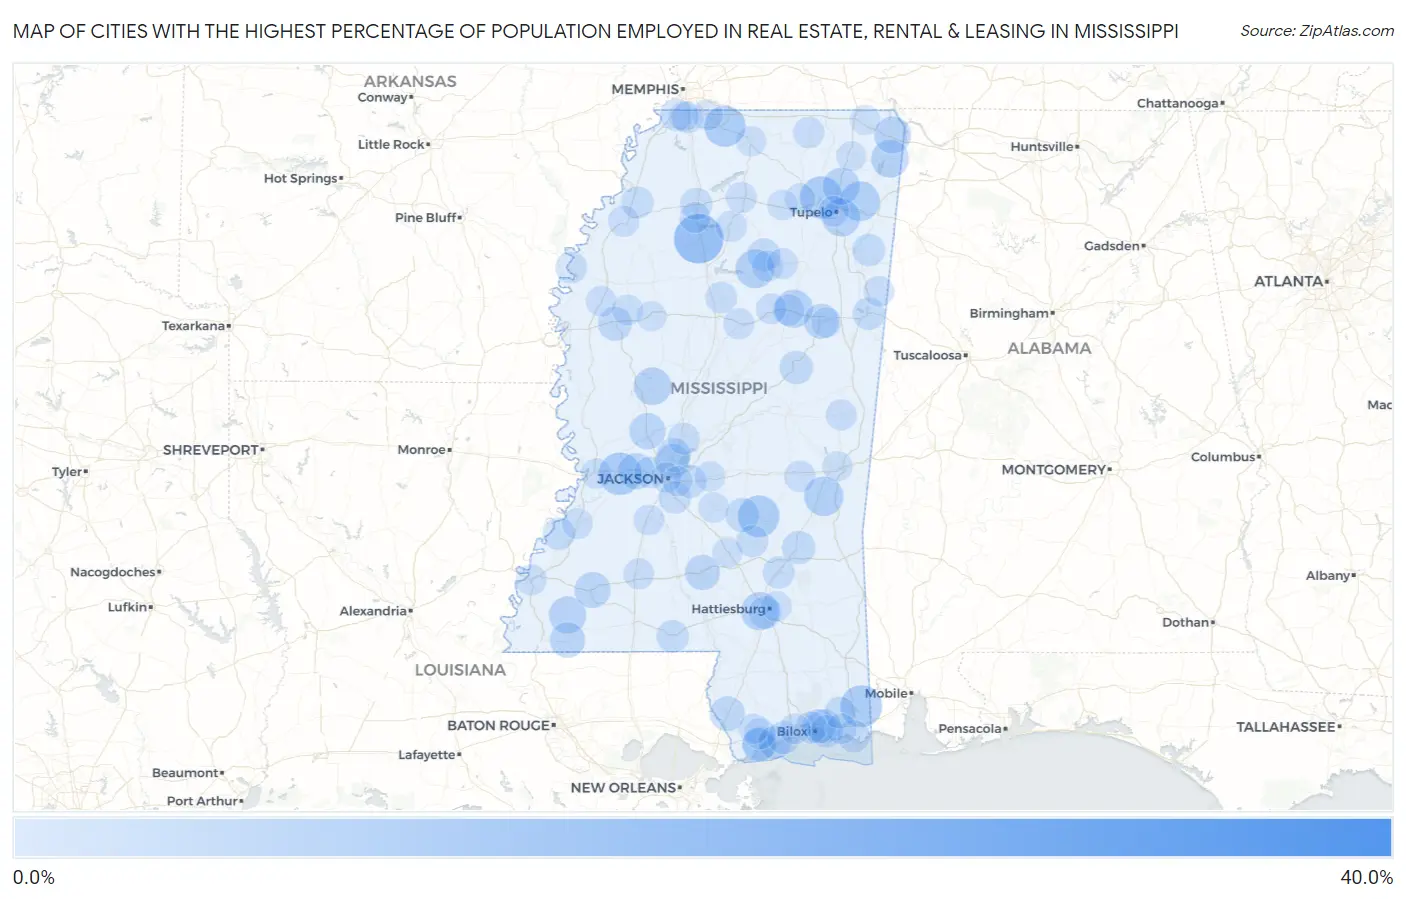
Map of Cities with the Highest Percentage of Population Employed in Real Estate, Rental & Leasing in Mississippi
0.0%
40.0%
Cities with the Highest Percentage of Population Employed in Real Estate, Rental & Leasing in Mississippi
| City | % Employed | vs State | vs National | |
| 1. | Longview | 31.1% | 1.3%(+29.9)#1 | 1.9%(+29.2)#63 |
| 2. | Oakland | 12.4% | 1.3%(+11.1)#2 | 1.9%(+10.5)#353 |
| 3. | Sherman | 8.2% | 1.3%(+6.97)#3 | 1.9%(+6.33)#770 |
| 4. | Edwards | 8.2% | 1.3%(+6.95)#4 | 1.9%(+6.31)#780 |
| 5. | Big Point | 7.8% | 1.3%(+6.52)#5 | 1.9%(+5.88)#864 |
| 6. | Sylvarena | 7.7% | 1.3%(+6.44)#6 | 1.9%(+5.80)#887 |
| 7. | Byhalia | 7.4% | 1.3%(+6.15)#7 | 1.9%(+5.51)#951 |
| 8. | Mantachie | 6.5% | 1.3%(+5.27)#8 | 1.9%(+4.62)#1,186 |
| 9. | Enterprise | 6.4% | 1.3%(+5.16)#9 | 1.9%(+4.52)#1,213 |
| 10. | Big Creek | 6.0% | 1.3%(+4.72)#10 | 1.9%(+4.08)#1,387 |
| 11. | Plantersville | 5.6% | 1.3%(+4.38)#11 | 1.9%(+3.73)#1,532 |
| 12. | Maben | 5.6% | 1.3%(+4.37)#12 | 1.9%(+3.73)#1,536 |
| 13. | West Hattiesburg | 5.6% | 1.3%(+4.31)#13 | 1.9%(+3.67)#1,562 |
| 14. | Tishomingo | 5.4% | 1.3%(+4.15)#14 | 1.9%(+3.51)#1,635 |
| 15. | Eden | 5.4% | 1.3%(+4.11)#15 | 1.9%(+3.47)#1,665 |
| 16. | Crosby | 5.1% | 1.3%(+3.83)#16 | 1.9%(+3.19)#1,819 |
| 17. | Guntown | 5.0% | 1.3%(+3.79)#17 | 1.9%(+3.15)#1,837 |
| 18. | Iuka | 4.9% | 1.3%(+3.65)#18 | 1.9%(+3.01)#1,923 |
| 19. | Bolton | 4.6% | 1.3%(+3.34)#19 | 1.9%(+2.70)#2,142 |
| 20. | Bentonia | 4.4% | 1.3%(+3.17)#20 | 1.9%(+2.53)#2,269 |
| 21. | Bude | 4.4% | 1.3%(+3.11)#21 | 1.9%(+2.47)#2,312 |
| 22. | Centreville | 4.0% | 1.3%(+2.73)#22 | 1.9%(+2.09)#2,678 |
| 23. | Prentiss | 3.9% | 1.3%(+2.63)#23 | 1.9%(+1.99)#2,795 |
| 24. | Starkville | 3.9% | 1.3%(+2.61)#24 | 1.9%(+1.97)#2,816 |
| 25. | Picayune | 3.7% | 1.3%(+2.46)#25 | 1.9%(+1.82)#2,992 |
| 26. | Ridgeland | 3.4% | 1.3%(+2.19)#26 | 1.9%(+1.54)#3,372 |
| 27. | Gulf Hills | 3.4% | 1.3%(+2.13)#27 | 1.9%(+1.49)#3,450 |
| 28. | Indianola | 3.3% | 1.3%(+2.03)#28 | 1.9%(+1.39)#3,602 |
| 29. | St Martin | 3.3% | 1.3%(+2.02)#29 | 1.9%(+1.38)#3,631 |
| 30. | Raleigh | 3.2% | 1.3%(+1.98)#30 | 1.9%(+1.34)#3,706 |
| 31. | Bay St Louis | 3.2% | 1.3%(+1.92)#31 | 1.9%(+1.28)#3,817 |
| 32. | Madison | 3.1% | 1.3%(+1.85)#32 | 1.9%(+1.21)#3,932 |
| 33. | Sandersville | 2.9% | 1.3%(+1.69)#33 | 1.9%(+1.05)#4,237 |
| 34. | Louisville | 2.9% | 1.3%(+1.67)#34 | 1.9%(+1.03)#4,277 |
| 35. | Waveland | 2.8% | 1.3%(+1.57)#35 | 1.9%(+0.927)#4,500 |
| 36. | Pass Christian | 2.8% | 1.3%(+1.56)#36 | 1.9%(+0.914)#4,538 |
| 37. | Pittsboro | 2.8% | 1.3%(+1.53)#37 | 1.9%(+0.886)#4,590 |
| 38. | Long Beach | 2.7% | 1.3%(+1.46)#38 | 1.9%(+0.822)#4,747 |
| 39. | Brandon | 2.7% | 1.3%(+1.41)#39 | 1.9%(+0.767)#4,903 |
| 40. | Hatley | 2.4% | 1.3%(+1.19)#40 | 1.9%(+0.547)#5,522 |
| 41. | Hattiesburg | 2.4% | 1.3%(+1.19)#41 | 1.9%(+0.546)#5,534 |
| 42. | Tylertown | 2.4% | 1.3%(+1.18)#42 | 1.9%(+0.544)#5,539 |
| 43. | Ocean Springs | 2.4% | 1.3%(+1.15)#43 | 1.9%(+0.508)#5,638 |
| 44. | Pascagoula | 2.3% | 1.3%(+1.10)#44 | 1.9%(+0.455)#5,824 |
| 45. | Alcorn State University | 2.3% | 1.3%(+1.02)#45 | 1.9%(+0.376)#6,075 |
| 46. | Columbus | 2.3% | 1.3%(+1.01)#46 | 1.9%(+0.373)#6,087 |
| 47. | Florence | 2.2% | 1.3%(+0.944)#47 | 1.9%(+0.303)#6,334 |
| 48. | Lynchburg | 2.2% | 1.3%(+0.944)#48 | 1.9%(+0.302)#6,338 |
| 49. | Batesville | 2.2% | 1.3%(+0.934)#49 | 1.9%(+0.293)#6,375 |
| 50. | Ellisville | 2.1% | 1.3%(+0.870)#50 | 1.9%(+0.229)#6,610 |
| 51. | Biloxi | 2.1% | 1.3%(+0.828)#51 | 1.9%(+0.187)#6,743 |
| 52. | Jonestown | 2.0% | 1.3%(+0.782)#52 | 1.9%(+0.141)#6,915 |
| 53. | Canton | 2.0% | 1.3%(+0.761)#53 | 1.9%(+0.119)#7,001 |
| 54. | Taylorsville | 2.0% | 1.3%(+0.741)#54 | 1.9%(+0.100)#7,079 |
| 55. | Vancleave | 1.9% | 1.3%(+0.616)#55 | 1.9%(-0.026)#7,580 |
| 56. | Clinton | 1.8% | 1.3%(+0.599)#56 | 1.9%(-0.042)#7,640 |
| 57. | Rosedale | 1.8% | 1.3%(+0.596)#57 | 1.9%(-0.045)#7,646 |
| 58. | Duck Hill | 1.8% | 1.3%(+0.568)#58 | 1.9%(-0.074)#7,769 |
| 59. | Mathiston | 1.7% | 1.3%(+0.484)#59 | 1.9%(-0.158)#8,130 |
| 60. | Diamondhead | 1.7% | 1.3%(+0.444)#60 | 1.9%(-0.197)#8,301 |
| 61. | Hickory | 1.7% | 1.3%(+0.425)#61 | 1.9%(-0.216)#8,412 |
| 62. | Falkner | 1.7% | 1.3%(+0.423)#62 | 1.9%(-0.218)#8,422 |
| 63. | Water Valley | 1.7% | 1.3%(+0.417)#63 | 1.9%(-0.224)#8,437 |
| 64. | Calhoun City | 1.6% | 1.3%(+0.381)#64 | 1.9%(-0.260)#8,615 |
| 65. | Southaven | 1.6% | 1.3%(+0.356)#65 | 1.9%(-0.285)#8,738 |
| 66. | Clarksdale | 1.6% | 1.3%(+0.351)#66 | 1.9%(-0.290)#8,764 |
| 67. | De Kalb | 1.6% | 1.3%(+0.337)#67 | 1.9%(-0.304)#8,823 |
| 68. | Kilmichael | 1.5% | 1.3%(+0.294)#68 | 1.9%(-0.347)#9,061 |
| 69. | Vardaman | 1.5% | 1.3%(+0.246)#69 | 1.9%(-0.395)#9,314 |
| 70. | University | 1.5% | 1.3%(+0.218)#70 | 1.9%(-0.423)#9,459 |
| 71. | Pope | 1.4% | 1.3%(+0.168)#71 | 1.9%(-0.473)#9,719 |
| 72. | Olive Branch | 1.4% | 1.3%(+0.154)#72 | 1.9%(-0.487)#9,783 |
| 73. | Brookhaven | 1.4% | 1.3%(+0.150)#73 | 1.9%(-0.491)#9,800 |
| 74. | Sunflower | 1.4% | 1.3%(+0.116)#74 | 1.9%(-0.525)#9,964 |
| 75. | Port Gibson | 1.4% | 1.3%(+0.116)#75 | 1.9%(-0.526)#9,970 |
| 76. | Natchez | 1.4% | 1.3%(+0.111)#76 | 1.9%(-0.530)#9,997 |
| 77. | Shaw | 1.3% | 1.3%(+0.070)#77 | 1.9%(-0.571)#10,210 |
| 78. | Caledonia | 1.3% | 1.3%(+0.058)#78 | 1.9%(-0.583)#10,270 |
| 79. | Beechwood | 1.3% | 1.3%(+0.057)#79 | 1.9%(-0.585)#10,279 |
| 80. | Tupelo | 1.3% | 1.3%(+0.032)#80 | 1.9%(-0.609)#10,410 |
| 81. | Gulfport | 1.3% | 1.3%(+0.006)#81 | 1.9%(-0.635)#10,564 |
| 82. | Eupora | 1.2% | 1.3%(-0.003)#82 | 1.9%(-0.644)#10,607 |
| 83. | Gautier | 1.2% | 1.3%(-0.005)#83 | 1.9%(-0.646)#10,619 |
| 84. | Ecru | 1.2% | 1.3%(-0.010)#84 | 1.9%(-0.651)#10,643 |
| 85. | Crystal Springs | 1.2% | 1.3%(-0.017)#85 | 1.9%(-0.659)#10,696 |
| 86. | Thaxton | 1.2% | 1.3%(-0.027)#86 | 1.9%(-0.668)#10,751 |
| 87. | Petal | 1.2% | 1.3%(-0.035)#87 | 1.9%(-0.676)#10,790 |
| 88. | Holly Springs | 1.2% | 1.3%(-0.039)#88 | 1.9%(-0.680)#10,808 |
| 89. | Puckett | 1.2% | 1.3%(-0.053)#89 | 1.9%(-0.694)#10,905 |
| 90. | Pelahatchie | 1.2% | 1.3%(-0.076)#90 | 1.9%(-0.717)#11,028 |
| 91. | Jackson | 1.1% | 1.3%(-0.125)#91 | 1.9%(-0.766)#11,292 |
| 92. | Mount Olive | 1.1% | 1.3%(-0.165)#92 | 1.9%(-0.806)#11,513 |
| 93. | Kiln | 1.1% | 1.3%(-0.185)#93 | 1.9%(-0.826)#11,631 |
| 94. | Meridian | 1.1% | 1.3%(-0.200)#94 | 1.9%(-0.841)#11,710 |
| 95. | Farmington | 1.0% | 1.3%(-0.221)#95 | 1.9%(-0.862)#11,834 |
| 96. | Horn Lake | 1.0% | 1.3%(-0.228)#96 | 1.9%(-0.869)#11,870 |
| 97. | Mississippi State | 1.0% | 1.3%(-0.244)#97 | 1.9%(-0.885)#11,961 |
| 98. | Itta Bena | 1.0% | 1.3%(-0.245)#98 | 1.9%(-0.886)#11,965 |
| 99. | Booneville | 0.98% | 1.3%(-0.266)#99 | 1.9%(-0.908)#12,087 |
| 100. | Pearl | 0.98% | 1.3%(-0.274)#100 | 1.9%(-0.916)#12,137 |
Common Questions
What are the Top 10 Cities with the Highest Percentage of Population Employed in Real Estate, Rental & Leasing in Mississippi?
Top 10 Cities with the Highest Percentage of Population Employed in Real Estate, Rental & Leasing in Mississippi are:
#1
12.4%
#2
8.2%
#3
8.2%
#4
7.8%
#5
7.7%
#6
7.4%
#7
6.5%
#8
6.4%
#9
6.0%
#10
5.6%
What city has the Highest Percentage of Population Employed in Real Estate, Rental & Leasing in Mississippi?
Oakland has the Highest Percentage of Population Employed in Real Estate, Rental & Leasing in Mississippi with 12.4%.
What is the Percentage of Population Employed in Real Estate, Rental & Leasing in the State of Mississippi?
Percentage of Population Employed in Real Estate, Rental & Leasing in Mississippi is 1.3%.
What is the Percentage of Population Employed in Real Estate, Rental & Leasing in the United States?
Percentage of Population Employed in Real Estate, Rental & Leasing in the United States is 1.9%.