Point Arena, CA Map & Demographics
Point Arena Map
Point Arena Overview
$26,290
PER CAPITA INCOME
$101,875
AVG FAMILY INCOME
$51,719
AVG HOUSEHOLD INCOME
0.39
INEQUALITY / GINI INDEX
661
TOTAL POPULATION
339
MALE POPULATION
322
FEMALE POPULATION
105.28
MALES / 100 FEMALES
94.99
FEMALES / 100 MALES
44.4
MEDIAN AGE
3.8
AVG FAMILY SIZE
3.0
AVG HOUSEHOLD SIZE
342
LABOR FORCE [ PEOPLE ]
70.1%
PERCENT IN LABOR FORCE
8.8%
UNEMPLOYMENT RATE
Point Arena Zip Codes
Point Arena Area Codes
Income in Point Arena
Income Overview in Point Arena
Per Capita Income in Point Arena is $26,290, while median incomes of families and households are $101,875 and $51,719 respectively.
| Characteristic | Number | Measure |
| Per Capita Income | 661 | $26,290 |
| Median Family Income | 145 | $101,875 |
| Mean Family Income | 145 | $91,168 |
| Median Household Income | 219 | $51,719 |
| Mean Household Income | 219 | $70,286 |
| Income Deficit | 145 | $0 |
| Wage / Income Gap (%) | 661 | 0.00% |
| Wage / Income Gap ($) | 661 | 100.00¢ per $1 |
| Gini / Inequality Index | 661 | 0.39 |
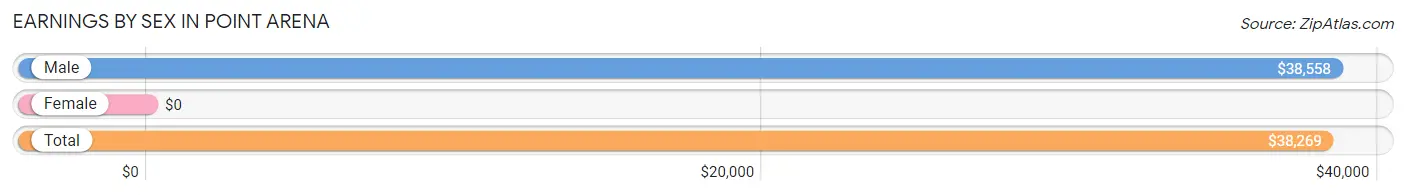
Earnings by Sex in Point Arena
| Sex | Number | Average Earnings |
| Male | 150 (45.7%) | $38,558 |
| Female | 178 (54.3%) | $0 |
| Total | 328 (100.0%) | $38,269 |
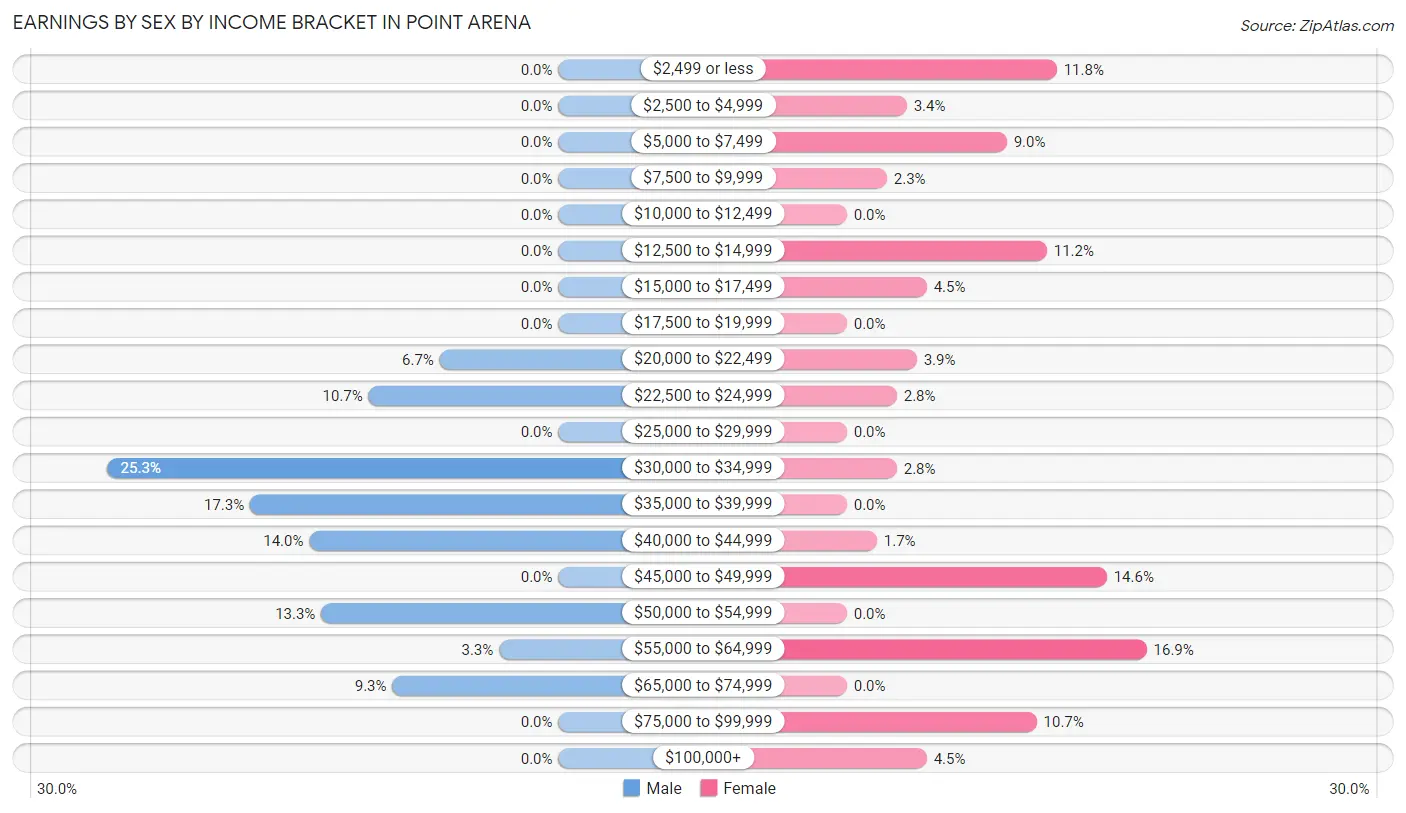
Earnings by Sex by Income Bracket in Point Arena
The most common earnings brackets in Point Arena are $30,000 to $34,999 for men (38 | 25.3%) and $55,000 to $64,999 for women (30 | 16.9%).
| Income | Male | Female |
| $2,499 or less | 0 (0.0%) | 21 (11.8%) |
| $2,500 to $4,999 | 0 (0.0%) | 6 (3.4%) |
| $5,000 to $7,499 | 0 (0.0%) | 16 (9.0%) |
| $7,500 to $9,999 | 0 (0.0%) | 4 (2.2%) |
| $10,000 to $12,499 | 0 (0.0%) | 0 (0.0%) |
| $12,500 to $14,999 | 0 (0.0%) | 20 (11.2%) |
| $15,000 to $17,499 | 0 (0.0%) | 8 (4.5%) |
| $17,500 to $19,999 | 0 (0.0%) | 0 (0.0%) |
| $20,000 to $22,499 | 10 (6.7%) | 7 (3.9%) |
| $22,500 to $24,999 | 16 (10.7%) | 5 (2.8%) |
| $25,000 to $29,999 | 0 (0.0%) | 0 (0.0%) |
| $30,000 to $34,999 | 38 (25.3%) | 5 (2.8%) |
| $35,000 to $39,999 | 26 (17.3%) | 0 (0.0%) |
| $40,000 to $44,999 | 21 (14.0%) | 3 (1.7%) |
| $45,000 to $49,999 | 0 (0.0%) | 26 (14.6%) |
| $50,000 to $54,999 | 20 (13.3%) | 0 (0.0%) |
| $55,000 to $64,999 | 5 (3.3%) | 30 (16.9%) |
| $65,000 to $74,999 | 14 (9.3%) | 0 (0.0%) |
| $75,000 to $99,999 | 0 (0.0%) | 19 (10.7%) |
| $100,000+ | 0 (0.0%) | 8 (4.5%) |
| Total | 150 (100.0%) | 178 (100.0%) |
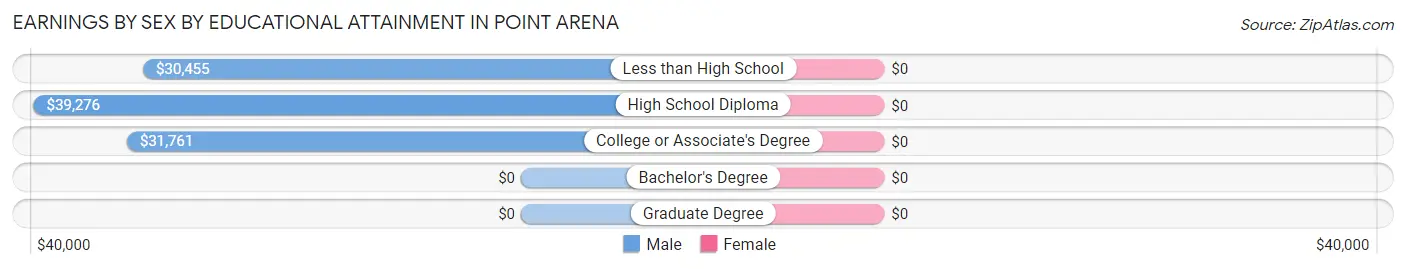
Earnings by Sex by Educational Attainment in Point Arena
| Educational Attainment | Male Income | Female Income |
| Less than High School | $30,455 | $0 |
| High School Diploma | $39,276 | $0 |
| College or Associate's Degree | $31,761 | $0 |
| Bachelor's Degree | - | - |
| Graduate Degree | - | - |
| Total | $38,558 | $46,696 |
Family Income in Point Arena
Family Income Brackets in Point Arena
According to the Point Arena family income data, there are 84 families falling into the $100,000 to $149,999 income range, which is the most common income bracket and makes up 57.9% of all families.
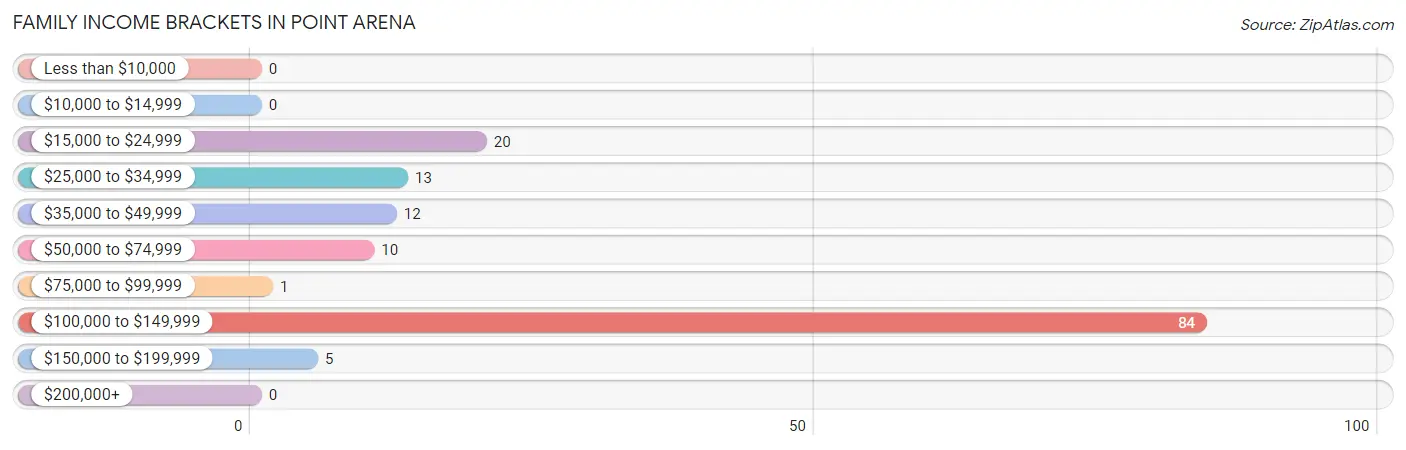
| Income Bracket | # Families | % Families |
| Less than $10,000 | 0 | 0.0% |
| $10,000 to $14,999 | 0 | 0.0% |
| $15,000 to $24,999 | 20 | 13.8% |
| $25,000 to $34,999 | 13 | 9.0% |
| $35,000 to $49,999 | 12 | 8.3% |
| $50,000 to $74,999 | 10 | 6.9% |
| $75,000 to $99,999 | 1 | 0.7% |
| $100,000 to $149,999 | 84 | 57.9% |
| $150,000 to $199,999 | 5 | 3.4% |
| $200,000+ | 0 | 0.0% |
Family Income by Famaliy Size in Point Arena
2-person families (63 | 43.4%) account for the highest median family income in Point Arena with $133,162 per family, while 2-person families (63 | 43.4%) have the highest median income of $66,581 per family member.
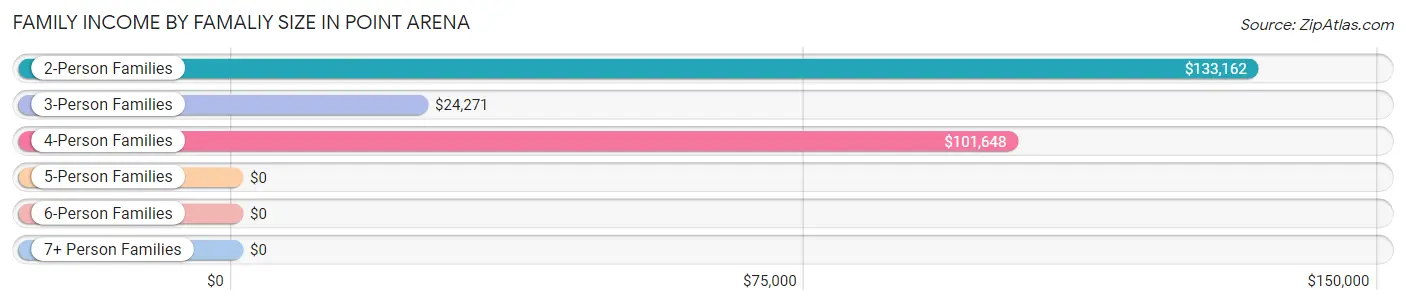
| Income Bracket | # Families | Median Income |
| 2-Person Families | 63 (43.4%) | $133,162 |
| 3-Person Families | 17 (11.7%) | $24,271 |
| 4-Person Families | 37 (25.5%) | $101,648 |
| 5-Person Families | 9 (6.2%) | $0 |
| 6-Person Families | 19 (13.1%) | $0 |
| 7+ Person Families | 0 (0.0%) | $0 |
| Total | 145 (100.0%) | $101,875 |
Family Income by Number of Earners in Point Arena
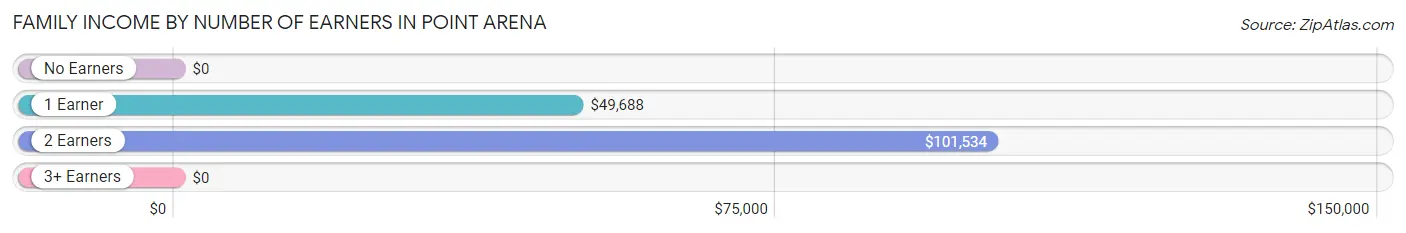
| Number of Earners | # Families | Median Income |
| No Earners | 12 (8.3%) | $0 |
| 1 Earner | 39 (26.9%) | $49,688 |
| 2 Earners | 69 (47.6%) | $101,534 |
| 3+ Earners | 25 (17.2%) | $0 |
| Total | 145 (100.0%) | $101,875 |
Household Income in Point Arena
Household Income Brackets in Point Arena
With 84 households falling in the category, the $100,000 to $149,999 income range is the most frequent in Point Arena, accounting for 38.4% of all households.
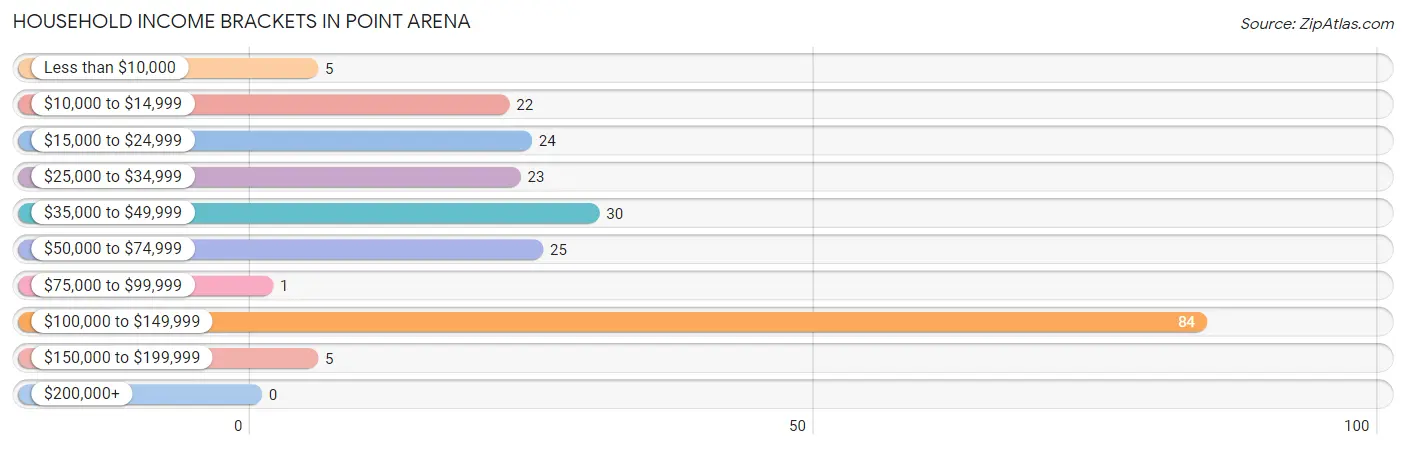
| Income Bracket | # Households | % Households |
| Less than $10,000 | 5 | 2.3% |
| $10,000 to $14,999 | 22 | 10.0% |
| $15,000 to $24,999 | 24 | 11.0% |
| $25,000 to $34,999 | 23 | 10.5% |
| $35,000 to $49,999 | 30 | 13.7% |
| $50,000 to $74,999 | 25 | 11.4% |
| $75,000 to $99,999 | 1 | 0.5% |
| $100,000 to $149,999 | 84 | 38.4% |
| $150,000 to $199,999 | 5 | 2.3% |
| $200,000+ | 0 | 0.0% |
Household Income by Householder Age in Point Arena
The median household income in Point Arena is $51,719, with the highest median household income of $39,583 found in the 65+ years age bracket for the primary householder. A total of 57 households (26.0%) fall into this category.
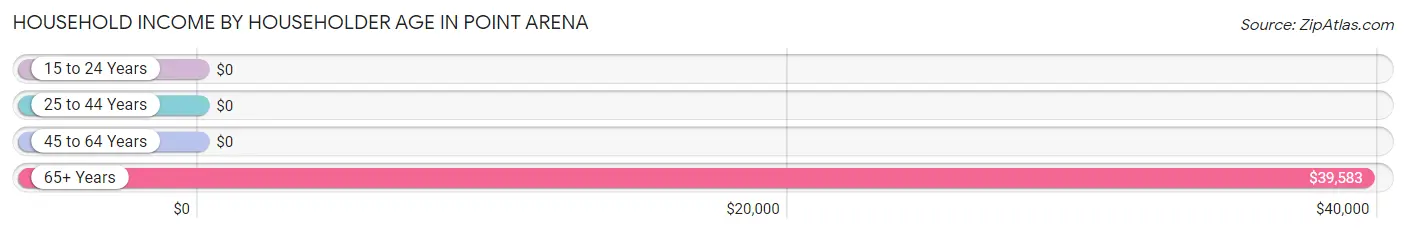
| Income Bracket | # Households | Median Income |
| 15 to 24 Years | 0 (0.0%) | $0 |
| 25 to 44 Years | 45 (20.5%) | $0 |
| 45 to 64 Years | 117 (53.4%) | $0 |
| 65+ Years | 57 (26.0%) | $39,583 |
| Total | 219 (100.0%) | $51,719 |
Poverty in Point Arena
Income Below Poverty by Sex and Age in Point Arena
With 22.5% poverty level for males and 15.5% for females among the residents of Point Arena, under 5 year old males and 18 to 24 year old females are the most vulnerable to poverty, with 16 males (100.0%) and 10 females (41.7%) in their respective age groups living below the poverty level.
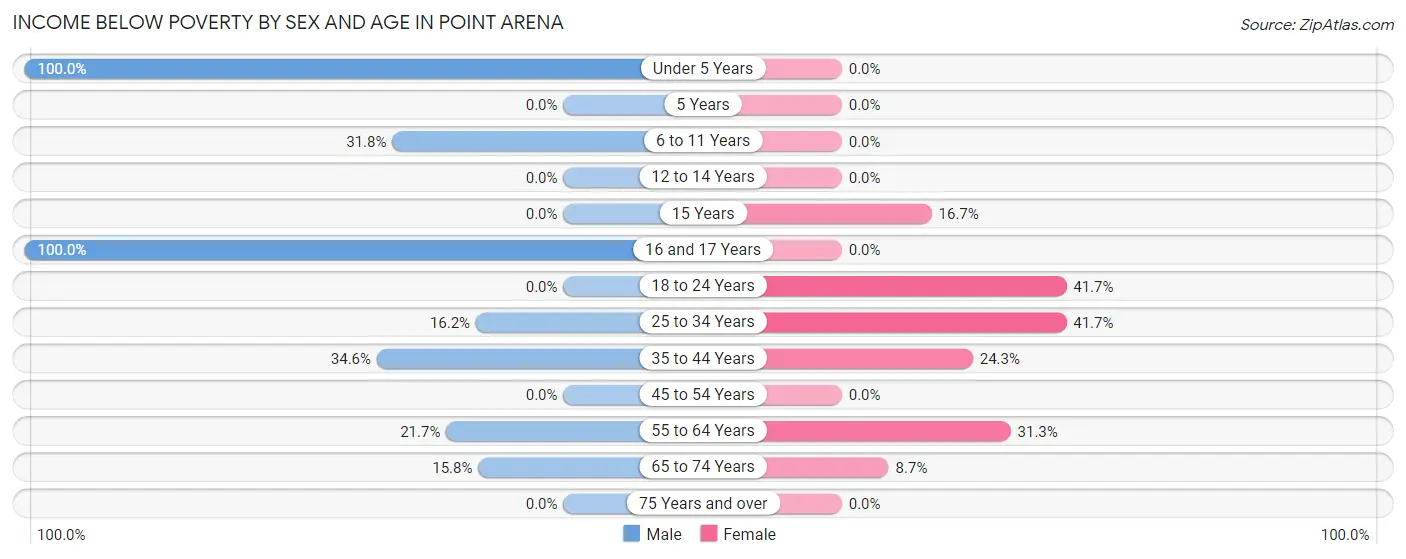
| Age Bracket | Male | Female |
| Under 5 Years | 16 (100.0%) | 0 (0.0%) |
| 5 Years | 0 (0.0%) | 0 (0.0%) |
| 6 to 11 Years | 20 (31.8%) | 0 (0.0%) |
| 12 to 14 Years | 0 (0.0%) | 0 (0.0%) |
| 15 Years | 0 (0.0%) | 3 (16.7%) |
| 16 and 17 Years | 8 (100.0%) | 0 (0.0%) |
| 18 to 24 Years | 0 (0.0%) | 10 (41.7%) |
| 25 to 34 Years | 6 (16.2%) | 5 (41.7%) |
| 35 to 44 Years | 9 (34.6%) | 9 (24.3%) |
| 45 to 54 Years | 0 (0.0%) | 0 (0.0%) |
| 55 to 64 Years | 10 (21.7%) | 21 (31.3%) |
| 65 to 74 Years | 6 (15.8%) | 2 (8.7%) |
| 75 Years and over | 0 (0.0%) | 0 (0.0%) |
| Total | 75 (22.5%) | 50 (15.5%) |
Income Above Poverty by Sex and Age in Point Arena
According to the poverty statistics in Point Arena, males aged 15 years and females aged under 5 years are the age groups that are most secure financially, with 100.0% of males and 100.0% of females in these age groups living above the poverty line.
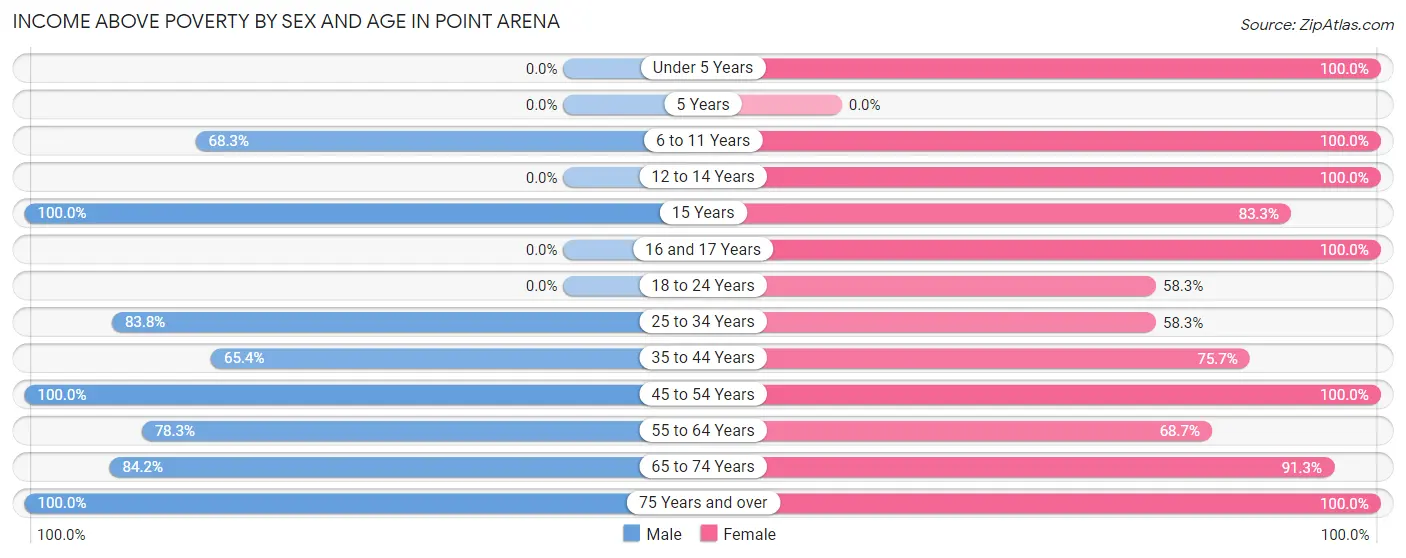
| Age Bracket | Male | Female |
| Under 5 Years | 0 (0.0%) | 5 (100.0%) |
| 5 Years | 0 (0.0%) | 0 (0.0%) |
| 6 to 11 Years | 43 (68.2%) | 22 (100.0%) |
| 12 to 14 Years | 0 (0.0%) | 33 (100.0%) |
| 15 Years | 11 (100.0%) | 15 (83.3%) |
| 16 and 17 Years | 0 (0.0%) | 16 (100.0%) |
| 18 to 24 Years | 0 (0.0%) | 14 (58.3%) |
| 25 to 34 Years | 31 (83.8%) | 7 (58.3%) |
| 35 to 44 Years | 17 (65.4%) | 28 (75.7%) |
| 45 to 54 Years | 55 (100.0%) | 49 (100.0%) |
| 55 to 64 Years | 36 (78.3%) | 46 (68.7%) |
| 65 to 74 Years | 32 (84.2%) | 21 (91.3%) |
| 75 Years and over | 34 (100.0%) | 16 (100.0%) |
| Total | 259 (77.5%) | 272 (84.5%) |
Income Below Poverty Among Married-Couple Families in Point Arena
The poverty statistics for married-couple families in Point Arena show that 3.8% or 5 of the total 132 families live below the poverty line. Families with 3 or 4 children have the highest poverty rate of 26.3%, comprising of 5 families. On the other hand, families with no children have the lowest poverty rate of 0.0%, which includes 0 families.
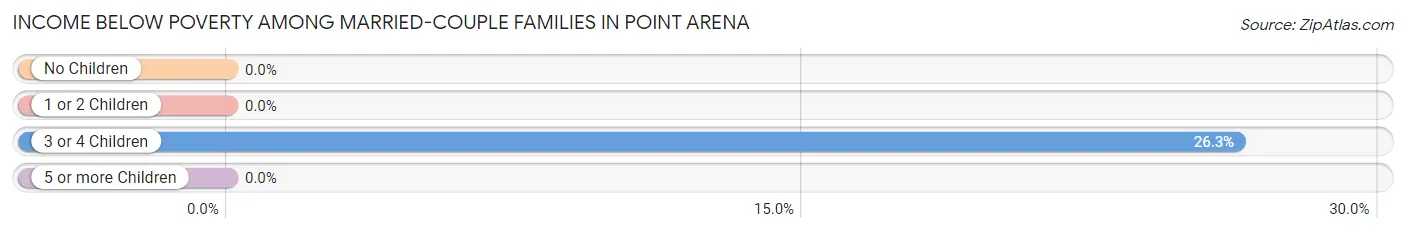
| Children | Above Poverty | Below Poverty |
| No Children | 67 (100.0%) | 0 (0.0%) |
| 1 or 2 Children | 46 (100.0%) | 0 (0.0%) |
| 3 or 4 Children | 14 (73.7%) | 5 (26.3%) |
| 5 or more Children | 0 (0.0%) | 0 (0.0%) |
| Total | 127 (96.2%) | 5 (3.8%) |
Income Below Poverty Among Single-Parent Households in Point Arena
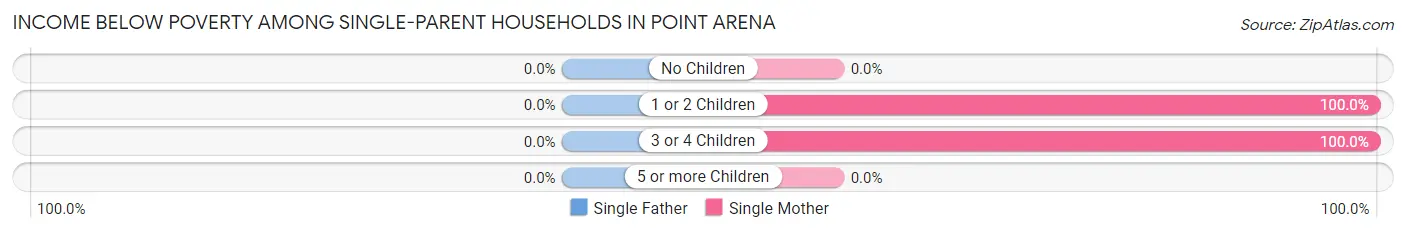
| Children | Single Father | Single Mother |
| No Children | 0 (0.0%) | 0 (0.0%) |
| 1 or 2 Children | 0 (0.0%) | 3 (100.0%) |
| 3 or 4 Children | 0 (0.0%) | 5 (100.0%) |
| 5 or more Children | 0 (0.0%) | 0 (0.0%) |
| Total | 0 (0.0%) | 8 (100.0%) |
Income Below Poverty Among Married-Couple vs Single-Parent Households in Point Arena
The poverty data for Point Arena shows that 5 of the married-couple family households (3.8%) and 8 of the single-parent households (61.5%) are living below the poverty level. Within the married-couple family households, those with 3 or 4 children have the highest poverty rate, with 5 households (26.3%) falling below the poverty line. Among the single-parent households, those with 1 or 2 children have the highest poverty rate, with 3 household (100.0%) living below poverty.
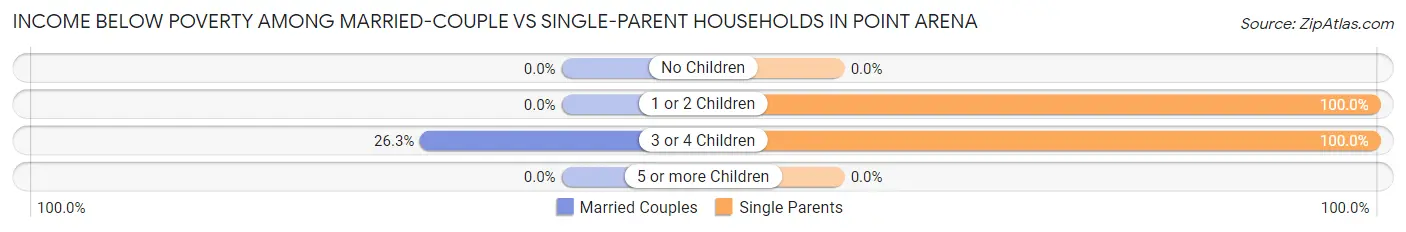
| Children | Married-Couple Families | Single-Parent Households |
| No Children | 0 (0.0%) | 0 (0.0%) |
| 1 or 2 Children | 0 (0.0%) | 3 (100.0%) |
| 3 or 4 Children | 5 (26.3%) | 5 (100.0%) |
| 5 or more Children | 0 (0.0%) | 0 (0.0%) |
| Total | 5 (3.8%) | 8 (61.5%) |
Race in Point Arena
The most populous races in Point Arena are Hispanic or Latino (328 | 49.6%), White / Caucasian (264 | 39.9%), and Two or more Races (195 | 29.5%).
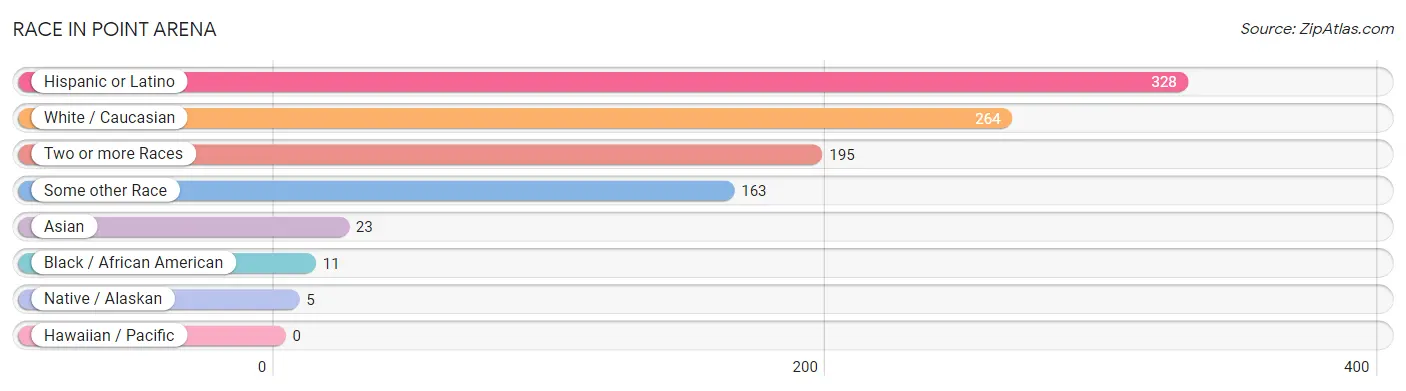
| Race | # Population | % Population |
| Asian | 23 | 3.5% |
| Black / African American | 11 | 1.7% |
| Hawaiian / Pacific | 0 | 0.0% |
| Hispanic or Latino | 328 | 49.6% |
| Native / Alaskan | 5 | 0.8% |
| White / Caucasian | 264 | 39.9% |
| Two or more Races | 195 | 29.5% |
| Some other Race | 163 | 24.7% |
| Total | 661 | 100.0% |
Ancestry in Point Arena
The most populous ancestries reported in Point Arena are Mexican (300 | 45.4%), European (43 | 6.5%), Irish (35 | 5.3%), Laotian (29 | 4.4%), and Arab (20 | 3.0%), together accounting for 64.6% of all Point Arena residents.
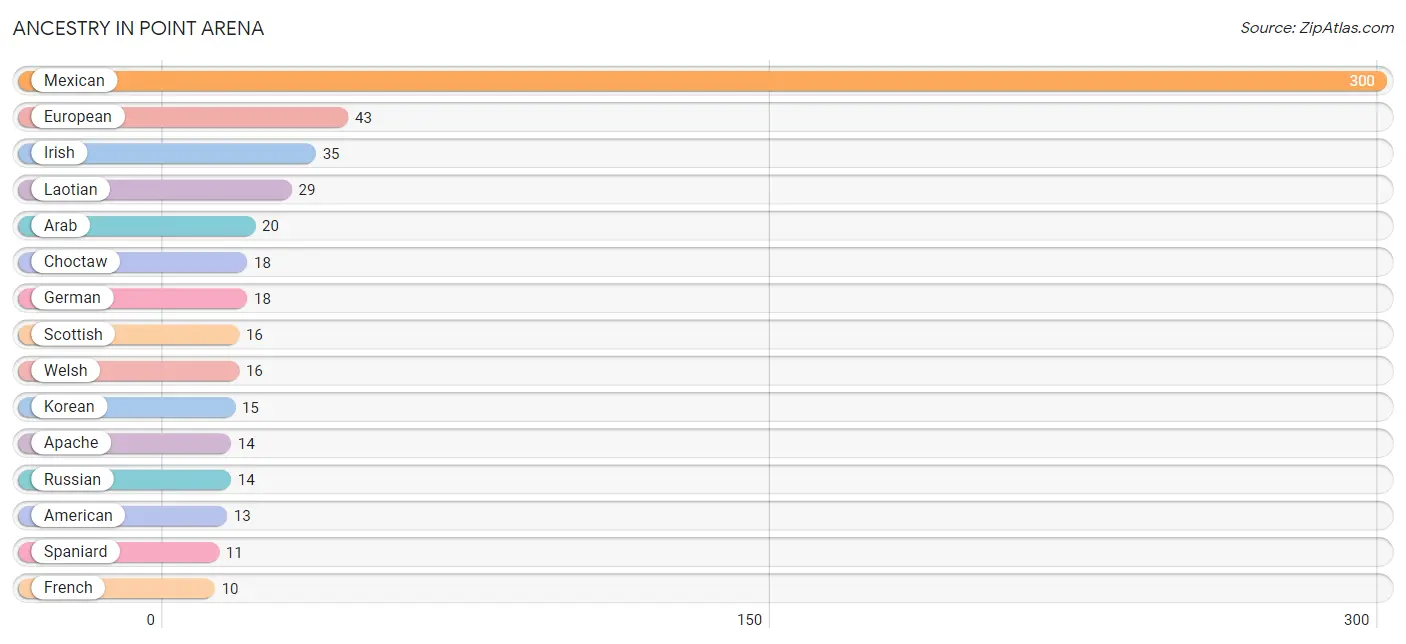
| Ancestry | # Population | % Population |
| American | 13 | 2.0% |
| Apache | 14 | 2.1% |
| Arab | 20 | 3.0% |
| Choctaw | 18 | 2.7% |
| Colombian | 8 | 1.2% |
| Croatian | 2 | 0.3% |
| Danish | 9 | 1.4% |
| English | 8 | 1.2% |
| European | 43 | 6.5% |
| French | 10 | 1.5% |
| German | 18 | 2.7% |
| Hungarian | 2 | 0.3% |
| Irish | 35 | 5.3% |
| Italian | 4 | 0.6% |
| Korean | 15 | 2.3% |
| Laotian | 29 | 4.4% |
| Mexican | 300 | 45.4% |
| Polish | 5 | 0.8% |
| Russian | 14 | 2.1% |
| Samoan | 10 | 1.5% |
| Scottish | 16 | 2.4% |
| South American | 8 | 1.2% |
| Spaniard | 11 | 1.7% |
| Spanish | 9 | 1.4% |
| Swiss | 4 | 0.6% |
| Welsh | 16 | 2.4% | View All 26 Rows |
Immigrants in Point Arena
The most numerous immigrant groups reported in Point Arena came from Central America (92 | 13.9%), Latin America (92 | 13.9%), Mexico (92 | 13.9%), Asia (4 | 0.6%), and Canada (4 | 0.6%), together accounting for 43.0% of all Point Arena residents.
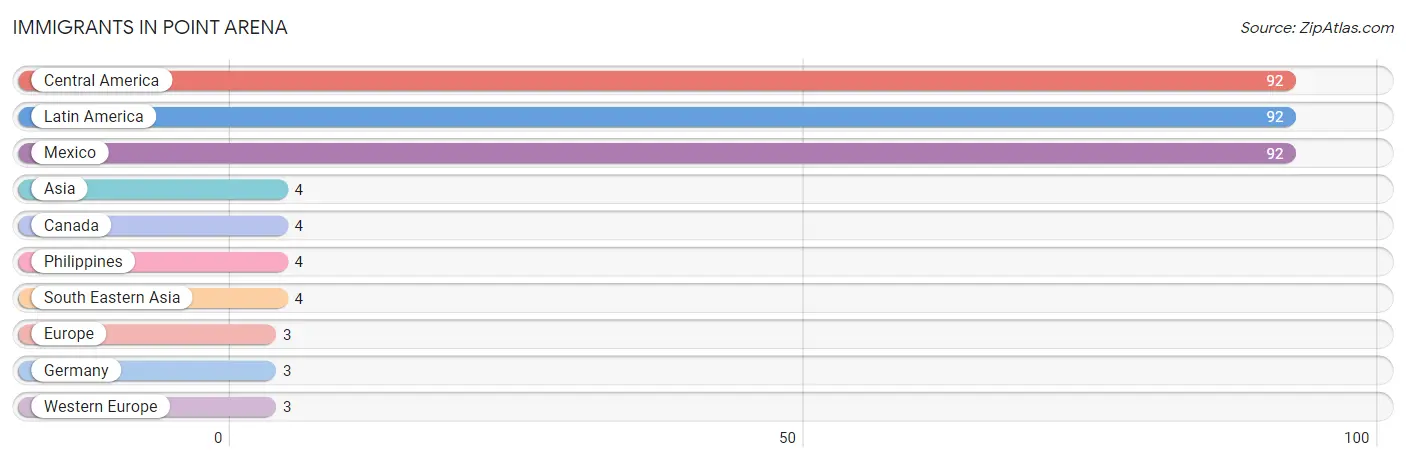
| Immigration Origin | # Population | % Population |
| Asia | 4 | 0.6% |
| Canada | 4 | 0.6% |
| Central America | 92 | 13.9% |
| Europe | 3 | 0.4% |
| Germany | 3 | 0.4% |
| Latin America | 92 | 13.9% |
| Mexico | 92 | 13.9% |
| Philippines | 4 | 0.6% |
| South Eastern Asia | 4 | 0.6% |
| Western Europe | 3 | 0.4% | View All 10 Rows |
Sex and Age in Point Arena
Sex and Age in Point Arena
The most populous age groups in Point Arena are 5 to 9 Years (53 | 15.6%) for men and 15 to 19 Years (53 | 16.5%) for women.
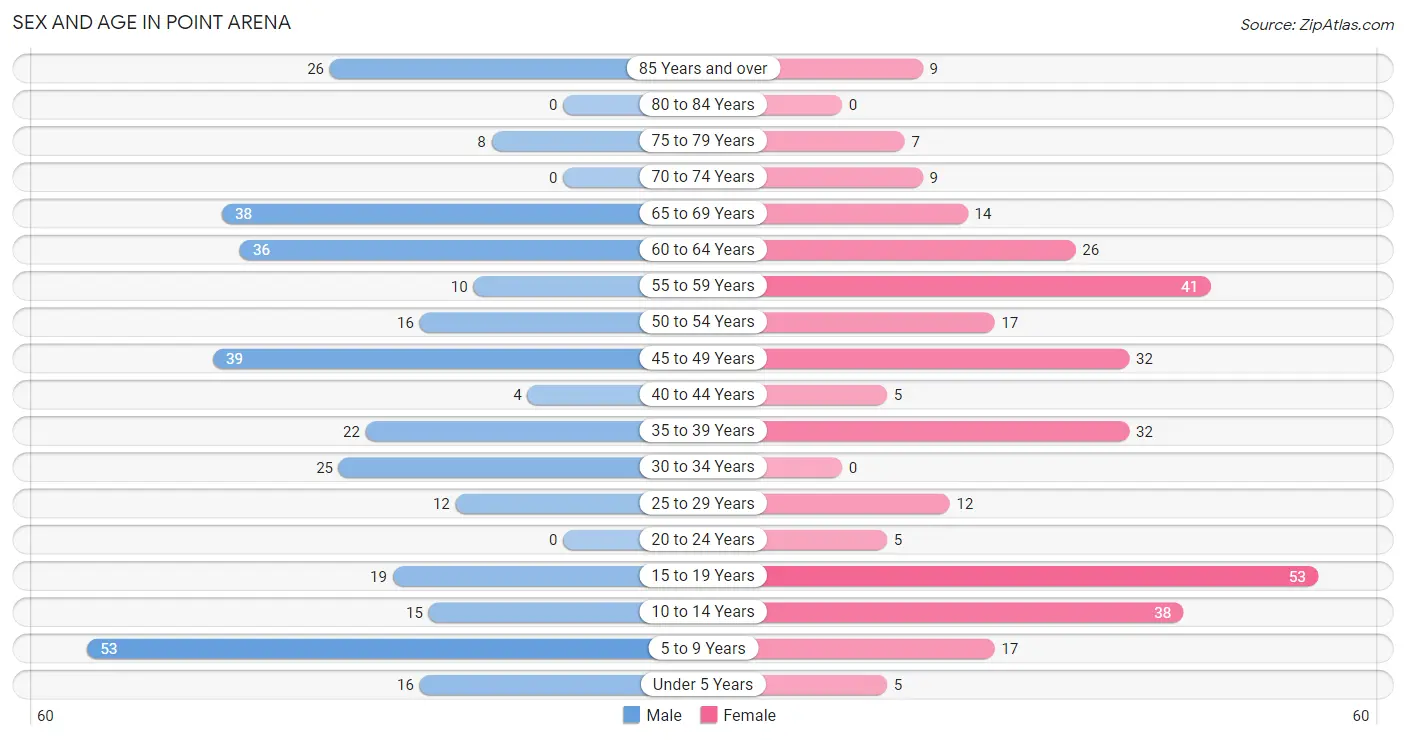
| Age Bracket | Male | Female |
| Under 5 Years | 16 (4.7%) | 5 (1.5%) |
| 5 to 9 Years | 53 (15.6%) | 17 (5.3%) |
| 10 to 14 Years | 15 (4.4%) | 38 (11.8%) |
| 15 to 19 Years | 19 (5.6%) | 53 (16.5%) |
| 20 to 24 Years | 0 (0.0%) | 5 (1.5%) |
| 25 to 29 Years | 12 (3.5%) | 12 (3.7%) |
| 30 to 34 Years | 25 (7.4%) | 0 (0.0%) |
| 35 to 39 Years | 22 (6.5%) | 32 (9.9%) |
| 40 to 44 Years | 4 (1.2%) | 5 (1.5%) |
| 45 to 49 Years | 39 (11.5%) | 32 (9.9%) |
| 50 to 54 Years | 16 (4.7%) | 17 (5.3%) |
| 55 to 59 Years | 10 (2.9%) | 41 (12.7%) |
| 60 to 64 Years | 36 (10.6%) | 26 (8.1%) |
| 65 to 69 Years | 38 (11.2%) | 14 (4.3%) |
| 70 to 74 Years | 0 (0.0%) | 9 (2.8%) |
| 75 to 79 Years | 8 (2.4%) | 7 (2.2%) |
| 80 to 84 Years | 0 (0.0%) | 0 (0.0%) |
| 85 Years and over | 26 (7.7%) | 9 (2.8%) |
| Total | 339 (100.0%) | 322 (100.0%) |
Families and Households in Point Arena
Median Family Size in Point Arena
The median family size in Point Arena is 3.83 persons per family, with single female/mother families (8 | 5.5%) accounting for the largest median family size of 4.88 persons per family. On the other hand, single male/father families (5 | 3.5%) represent the smallest median family size with 2.20 persons per family.
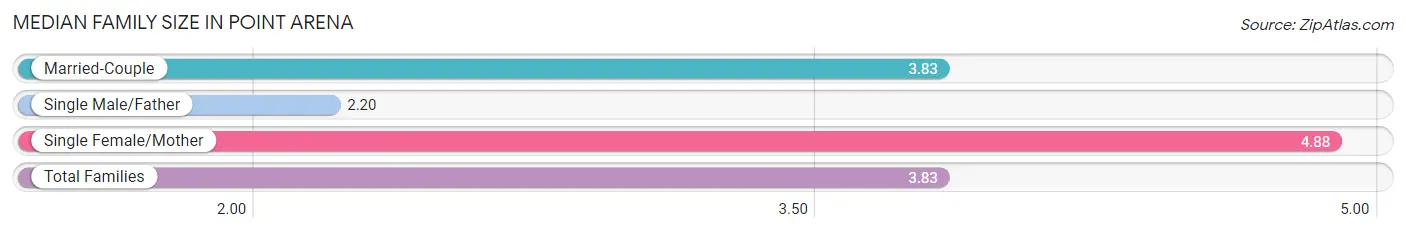
| Family Type | # Families | Family Size |
| Married-Couple | 132 (91.0%) | 3.83 |
| Single Male/Father | 5 (3.5%) | 2.20 |
| Single Female/Mother | 8 (5.5%) | 4.88 |
| Total Families | 145 (100.0%) | 3.83 |
Median Household Size in Point Arena
The median household size in Point Arena is 3.02 persons per household, with single female/mother households (8 | 3.6%) accounting for the largest median household size of 4.88 persons per household. non-family households (74 | 33.8%) represent the smallest median household size with 1.43 persons per household.
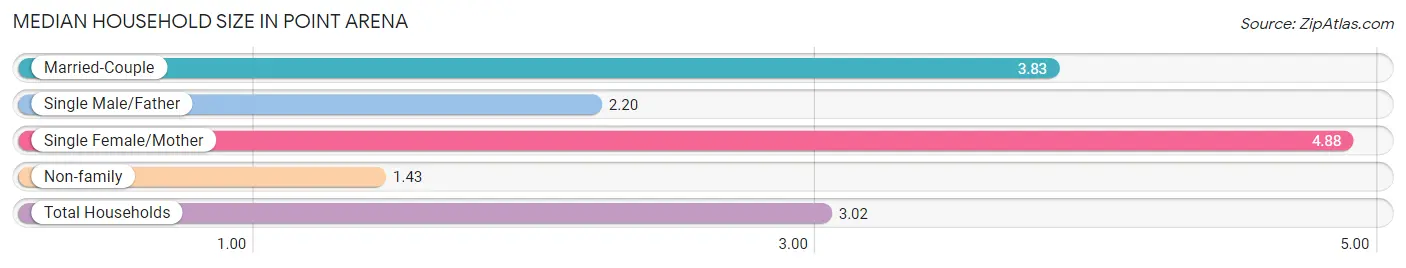
| Household Type | # Households | Household Size |
| Married-Couple | 132 (60.3%) | 3.83 |
| Single Male/Father | 5 (2.3%) | 2.20 |
| Single Female/Mother | 8 (3.6%) | 4.88 |
| Non-family | 74 (33.8%) | 1.43 |
| Total Households | 219 (100.0%) | 3.02 |
Household Size by Marriage Status in Point Arena
Out of a total of 219 households in Point Arena, 145 (66.2%) are family households, while 74 (33.8%) are nonfamily households. The most numerous type of family households are 2-person households, comprising 63, and the most common type of nonfamily households are 1-person households, comprising 50.
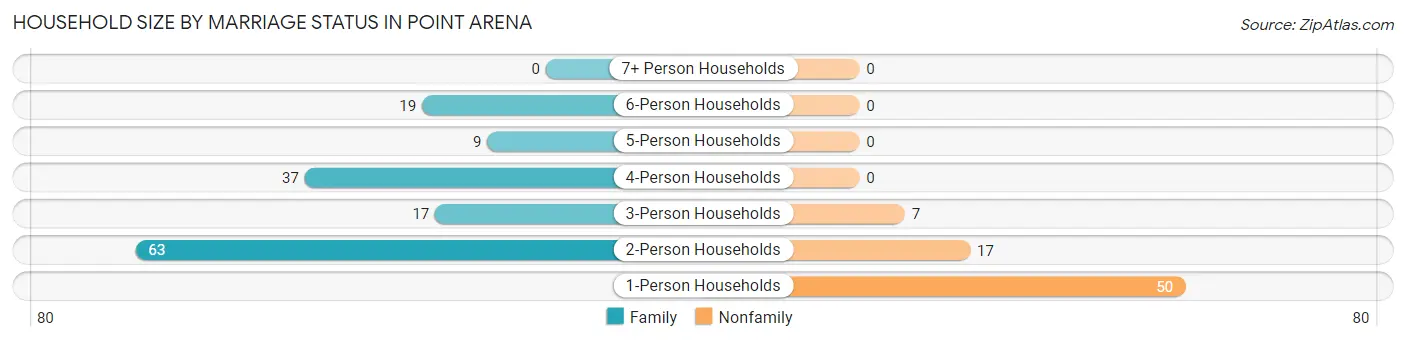
| Household Size | Family Households | Nonfamily Households |
| 1-Person Households | - | 50 (22.8%) |
| 2-Person Households | 63 (28.8%) | 17 (7.8%) |
| 3-Person Households | 17 (7.8%) | 7 (3.2%) |
| 4-Person Households | 37 (16.9%) | 0 (0.0%) |
| 5-Person Households | 9 (4.1%) | 0 (0.0%) |
| 6-Person Households | 19 (8.7%) | 0 (0.0%) |
| 7+ Person Households | 0 (0.0%) | 0 (0.0%) |
| Total | 145 (66.2%) | 74 (33.8%) |
Female Fertility in Point Arena
Fertility by Age in Point Arena
| Age Bracket | Women with Births | Births / 1,000 Women |
| 15 to 19 years | 0 (0.0%) | 0.0 |
| 20 to 34 years | 0 (0.0%) | 0.0 |
| 35 to 50 years | 0 (0.0%) | 0.0 |
| Total | 0 (0.0%) | 0.0 |
Fertility by Age by Marriage Status in Point Arena
| Age Bracket | Married | Unmarried |
| 15 to 19 years | 0 (0.0%) | 0 (0.0%) |
| 20 to 34 years | 0 (0.0%) | 0 (0.0%) |
| 35 to 50 years | 0 (0.0%) | 0 (0.0%) |
| Total | 0 (0.0%) | 0 (0.0%) |
Fertility by Education in Point Arena
| Educational Attainment | Women with Births | Births / 1,000 Women |
| Less than High School | 0 (0.0%) | 0.0 |
| High School Diploma | 0 (0.0%) | 0.0 |
| College or Associate's Degree | 0 (0.0%) | 0.0 |
| Bachelor's Degree | 0 (0.0%) | 0.0 |
| Graduate Degree | 0 (0.0%) | 0.0 |
| Total | 0 (0.0%) | 0.0 |
Fertility by Education by Marriage Status in Point Arena
| Educational Attainment | Married | Unmarried |
| Less than High School | 0 (0.0%) | 0 (0.0%) |
| High School Diploma | 0 (0.0%) | 0 (0.0%) |
| College or Associate's Degree | 0 (0.0%) | 0 (0.0%) |
| Bachelor's Degree | 0 (0.0%) | 0 (0.0%) |
| Graduate Degree | 0 (0.0%) | 0 (0.0%) |
| Total | 0 (0.0%) | 0 (0.0%) |
Employment Characteristics in Point Arena
Employment by Class of Employer in Point Arena
Among the 312 employed individuals in Point Arena, private company employees (242 | 77.6%), local government employees (35 | 11.2%), and self-employed (not incorporated) (30 | 9.6%) make up the most common classes of employment.
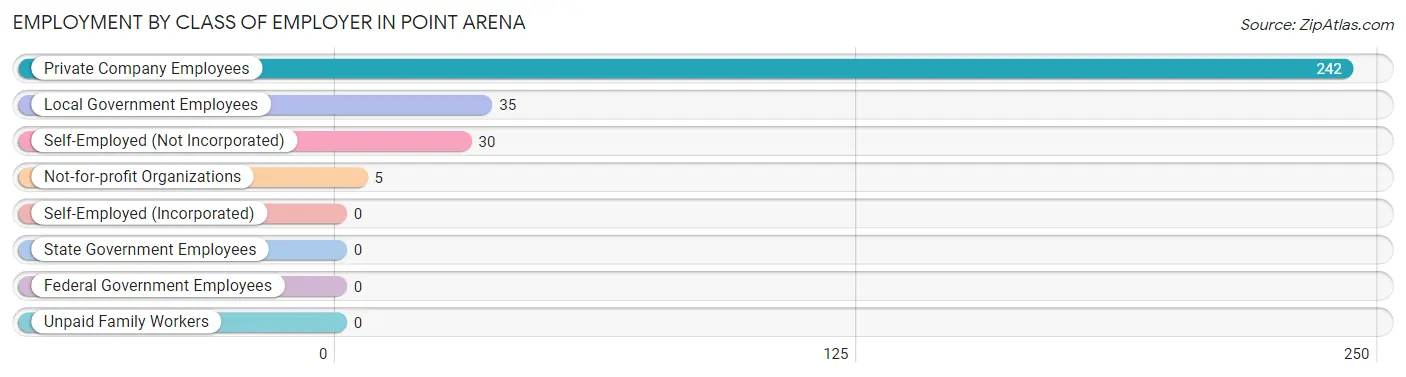
| Employer Class | # Employees | % Employees |
| Private Company Employees | 242 | 77.6% |
| Self-Employed (Incorporated) | 0 | 0.0% |
| Self-Employed (Not Incorporated) | 30 | 9.6% |
| Not-for-profit Organizations | 5 | 1.6% |
| Local Government Employees | 35 | 11.2% |
| State Government Employees | 0 | 0.0% |
| Federal Government Employees | 0 | 0.0% |
| Unpaid Family Workers | 0 | 0.0% |
| Total | 312 | 100.0% |
Employment Status by Age in Point Arena
According to the labor force statistics for Point Arena, out of the total population over 16 years of age (488), 70.1% or 342 individuals are in the labor force, with 8.8% or 30 of them unemployed. The age group with the highest labor force participation rate is 20 to 24 years, with 100.0% or 5 individuals in the labor force. Within the labor force, the 16 to 19 years age range has the highest percentage of unemployed individuals, with 38.5% or 10 of them being unemployed.
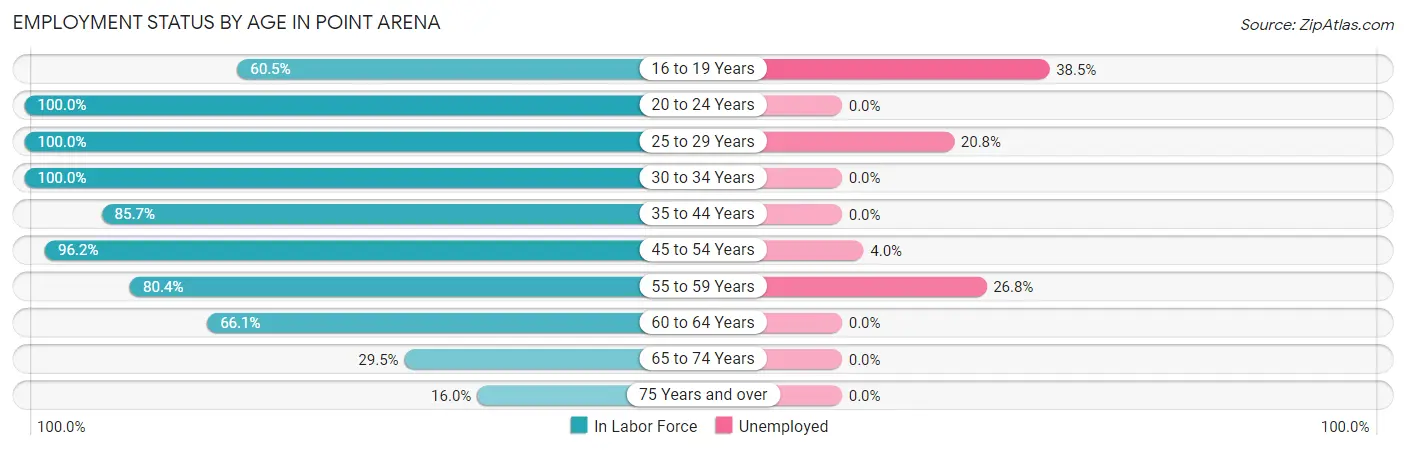
| Age Bracket | In Labor Force | Unemployed |
| 16 to 19 Years | 26 (60.5%) | 10 (38.5%) |
| 20 to 24 Years | 5 (100.0%) | 0 (0.0%) |
| 25 to 29 Years | 24 (100.0%) | 5 (20.8%) |
| 30 to 34 Years | 25 (100.0%) | 0 (0.0%) |
| 35 to 44 Years | 54 (85.7%) | 0 (0.0%) |
| 45 to 54 Years | 100 (96.2%) | 4 (4.0%) |
| 55 to 59 Years | 41 (80.4%) | 11 (26.8%) |
| 60 to 64 Years | 41 (66.1%) | 0 (0.0%) |
| 65 to 74 Years | 18 (29.5%) | 0 (0.0%) |
| 75 Years and over | 8 (16.0%) | 0 (0.0%) |
| Total | 342 (70.1%) | 30 (8.8%) |
Employment Status by Educational Attainment in Point Arena
According to labor force statistics for Point Arena, 86.6% of individuals (285) out of the total population between 25 and 64 years of age (329) are in the labor force, with 7.0% or 20 of them being unemployed. The group with the highest labor force participation rate are those with the educational attainment of college / associate degree, with 94.0% or 78 individuals in the labor force. Within the labor force, individuals with high school diploma education have the highest percentage of unemployment, with 17.0% or 16 of them being unemployed.
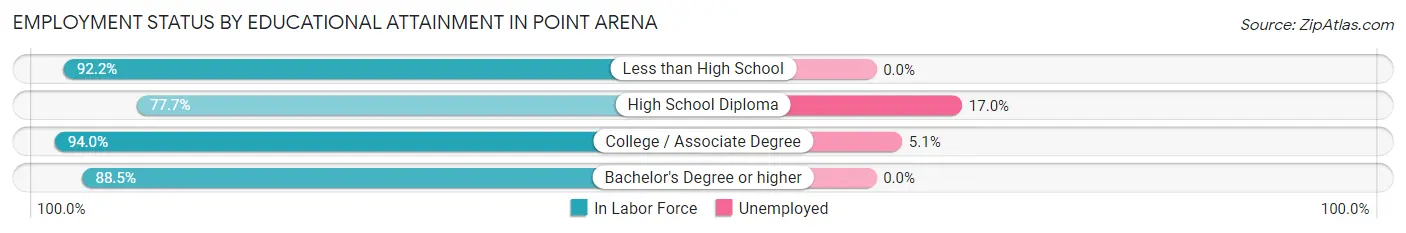
| Educational Attainment | In Labor Force | Unemployed |
| Less than High School | 59 (92.2%) | 0 (0.0%) |
| High School Diploma | 94 (77.7%) | 21 (17.0%) |
| College / Associate Degree | 78 (94.0%) | 4 (5.1%) |
| Bachelor's Degree or higher | 54 (88.5%) | 0 (0.0%) |
| Total | 285 (86.6%) | 23 (7.0%) |
Employment Occupations by Sex in Point Arena
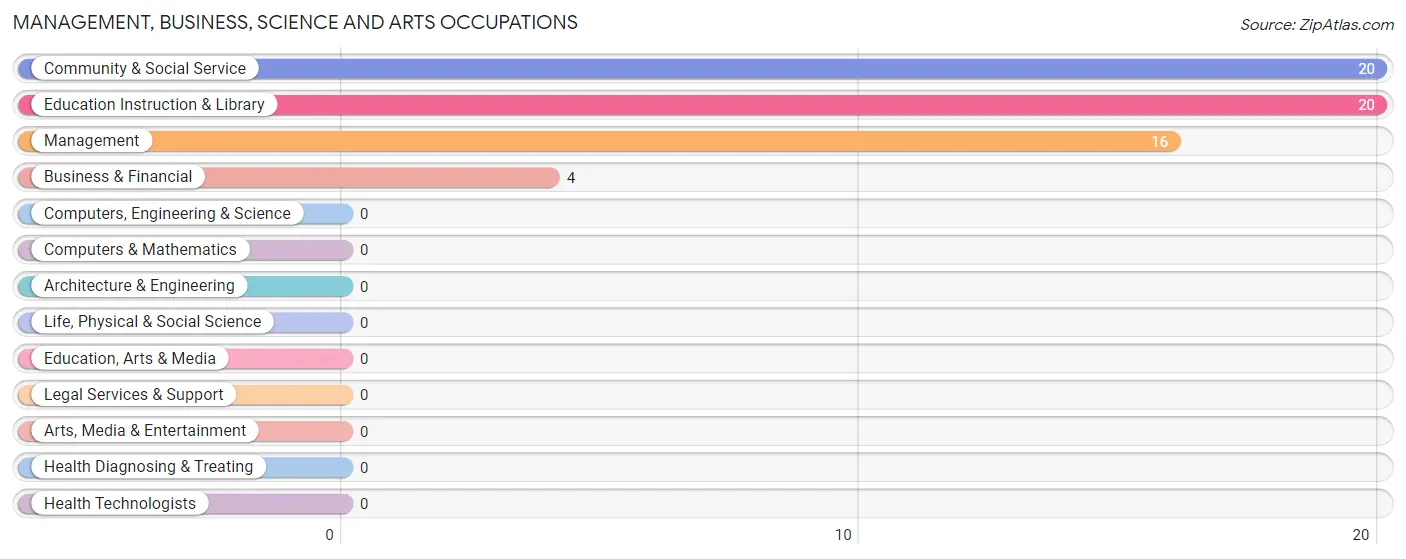
Management, Business, Science and Arts Occupations
The most common Management, Business, Science and Arts occupations in Point Arena are Community & Social Service (20 | 6.4%), Education Instruction & Library (20 | 6.4%), Management (16 | 5.1%), and Business & Financial (4 | 1.3%).
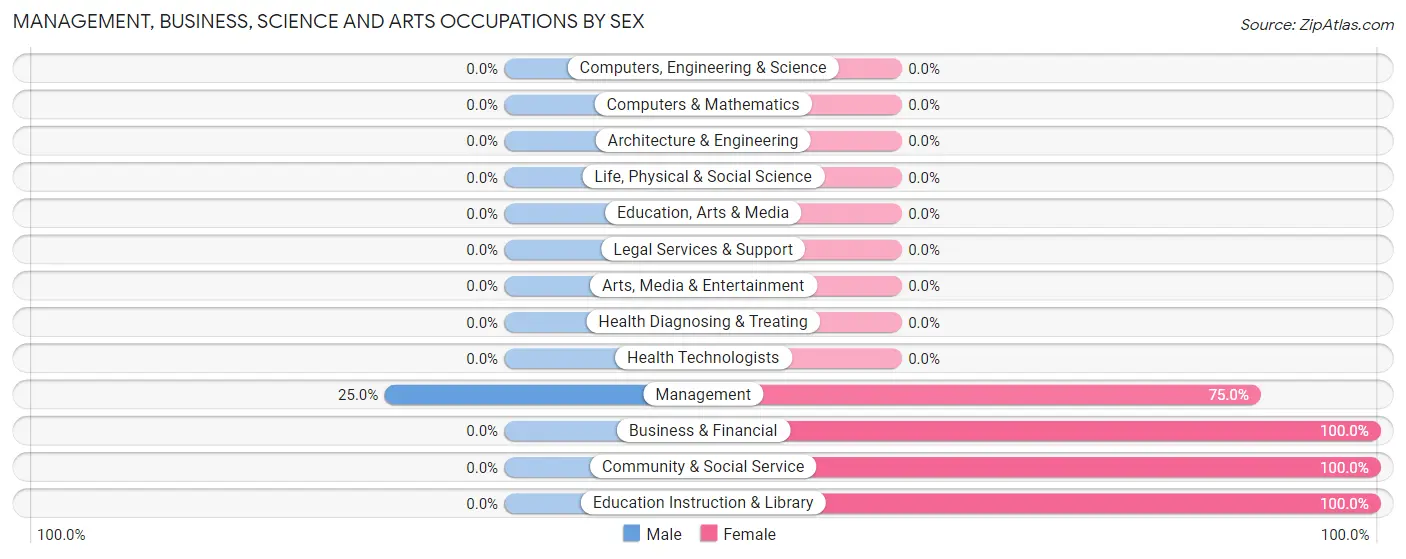
Management, Business, Science and Arts Occupations by Sex
| Occupation | Male | Female |
| Management | 4 (25.0%) | 12 (75.0%) |
| Business & Financial | 0 (0.0%) | 4 (100.0%) |
| Computers, Engineering & Science | 0 (0.0%) | 0 (0.0%) |
| Computers & Mathematics | 0 (0.0%) | 0 (0.0%) |
| Architecture & Engineering | 0 (0.0%) | 0 (0.0%) |
| Life, Physical & Social Science | 0 (0.0%) | 0 (0.0%) |
| Community & Social Service | 0 (0.0%) | 20 (100.0%) |
| Education, Arts & Media | 0 (0.0%) | 0 (0.0%) |
| Legal Services & Support | 0 (0.0%) | 0 (0.0%) |
| Education Instruction & Library | 0 (0.0%) | 20 (100.0%) |
| Arts, Media & Entertainment | 0 (0.0%) | 0 (0.0%) |
| Health Diagnosing & Treating | 0 (0.0%) | 0 (0.0%) |
| Health Technologists | 0 (0.0%) | 0 (0.0%) |
| Total (Category) | 4 (10.0%) | 36 (90.0%) |
| Total (Overall) | 150 (48.1%) | 162 (51.9%) |
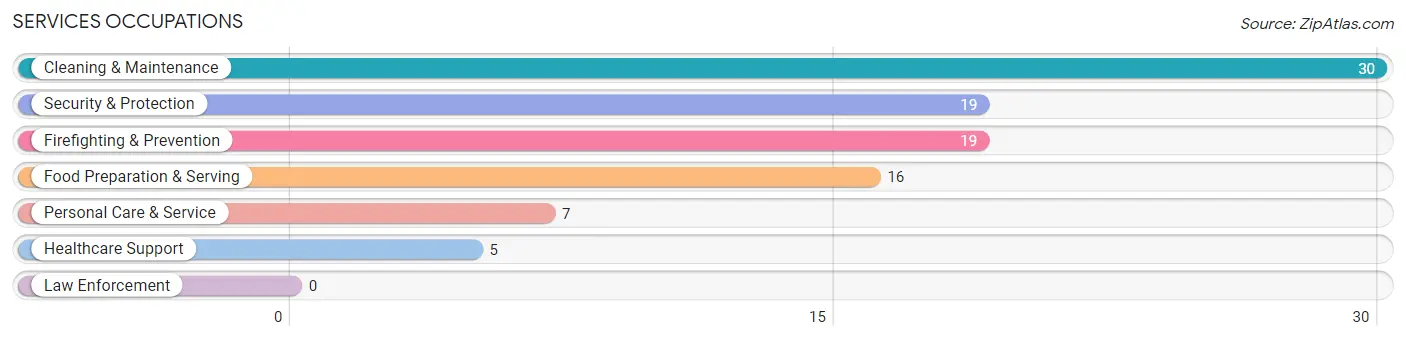
Services Occupations
The most common Services occupations in Point Arena are Cleaning & Maintenance (30 | 9.6%), Security & Protection (19 | 6.1%), Firefighting & Prevention (19 | 6.1%), Food Preparation & Serving (16 | 5.1%), and Personal Care & Service (7 | 2.2%).
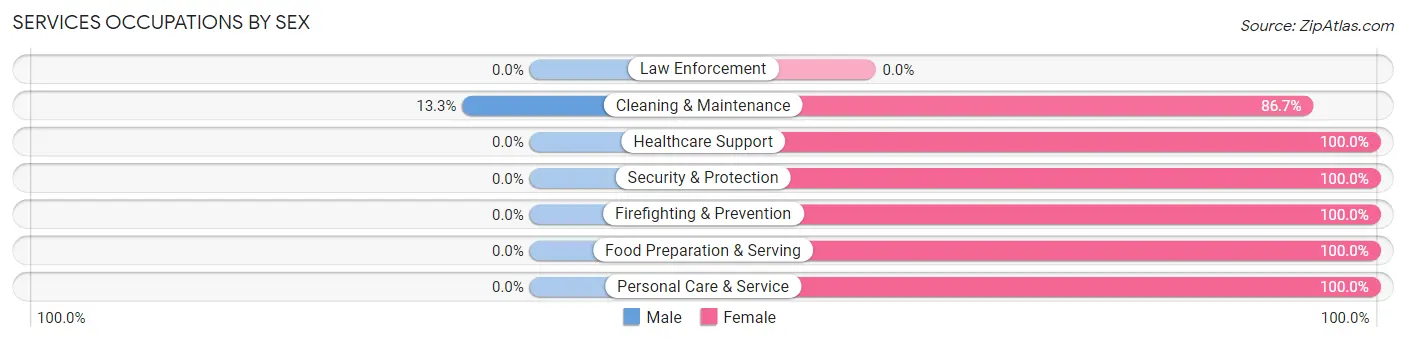
Services Occupations by Sex
| Occupation | Male | Female |
| Healthcare Support | 0 (0.0%) | 5 (100.0%) |
| Security & Protection | 0 (0.0%) | 19 (100.0%) |
| Firefighting & Prevention | 0 (0.0%) | 19 (100.0%) |
| Law Enforcement | 0 (0.0%) | 0 (0.0%) |
| Food Preparation & Serving | 0 (0.0%) | 16 (100.0%) |
| Cleaning & Maintenance | 4 (13.3%) | 26 (86.7%) |
| Personal Care & Service | 0 (0.0%) | 7 (100.0%) |
| Total (Category) | 4 (5.2%) | 73 (94.8%) |
| Total (Overall) | 150 (48.1%) | 162 (51.9%) |
Sales and Office Occupations
The most common Sales and Office occupations in Point Arena are Office & Administration (45 | 14.4%), and Sales & Related (19 | 6.1%).
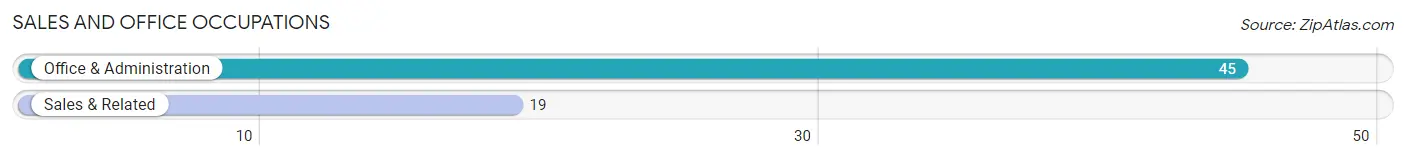
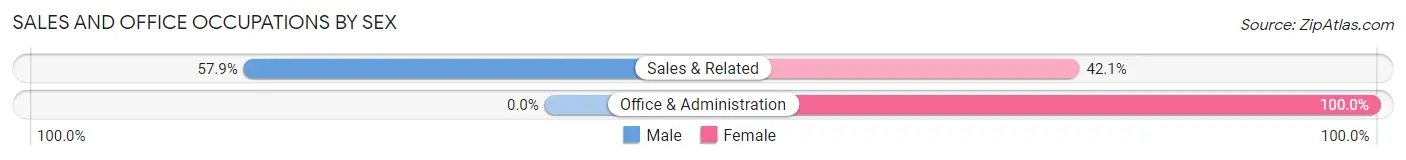
Sales and Office Occupations by Sex
| Occupation | Male | Female |
| Sales & Related | 11 (57.9%) | 8 (42.1%) |
| Office & Administration | 0 (0.0%) | 45 (100.0%) |
| Total (Category) | 11 (17.2%) | 53 (82.8%) |
| Total (Overall) | 150 (48.1%) | 162 (51.9%) |
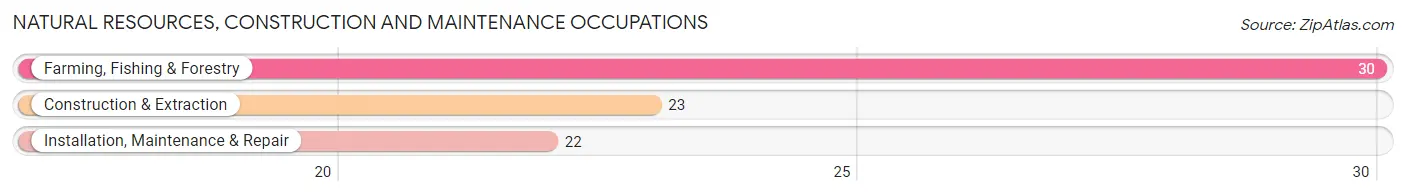
Natural Resources, Construction and Maintenance Occupations
The most common Natural Resources, Construction and Maintenance occupations in Point Arena are Farming, Fishing & Forestry (30 | 9.6%), Construction & Extraction (23 | 7.4%), and Installation, Maintenance & Repair (22 | 7.0%).
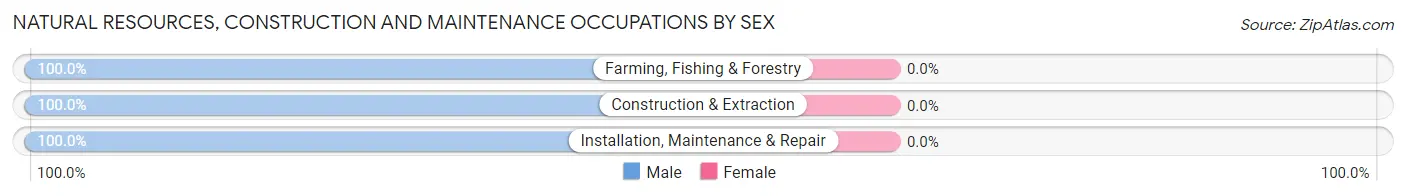
Natural Resources, Construction and Maintenance Occupations by Sex
| Occupation | Male | Female |
| Farming, Fishing & Forestry | 30 (100.0%) | 0 (0.0%) |
| Construction & Extraction | 23 (100.0%) | 0 (0.0%) |
| Installation, Maintenance & Repair | 22 (100.0%) | 0 (0.0%) |
| Total (Category) | 75 (100.0%) | 0 (0.0%) |
| Total (Overall) | 150 (48.1%) | 162 (51.9%) |
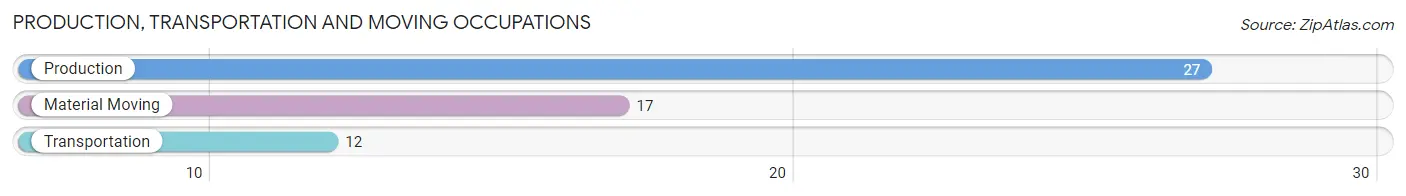
Production, Transportation and Moving Occupations
The most common Production, Transportation and Moving occupations in Point Arena are Production (27 | 8.6%), Material Moving (17 | 5.4%), and Transportation (12 | 3.8%).
Production, Transportation and Moving Occupations by Sex
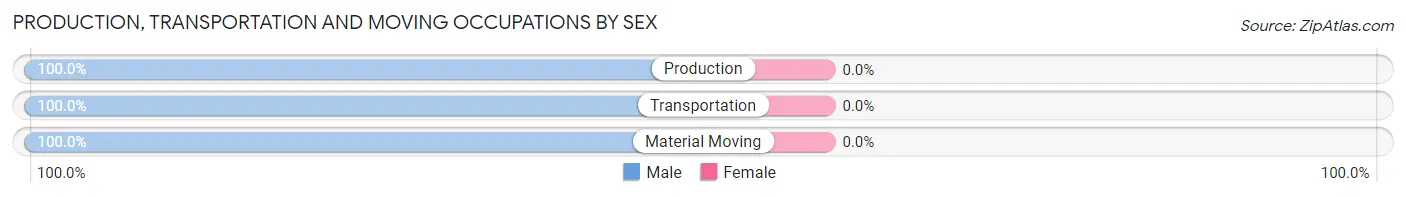
| Occupation | Male | Female |
| Production | 27 (100.0%) | 0 (0.0%) |
| Transportation | 12 (100.0%) | 0 (0.0%) |
| Material Moving | 17 (100.0%) | 0 (0.0%) |
| Total (Category) | 56 (100.0%) | 0 (0.0%) |
| Total (Overall) | 150 (48.1%) | 162 (51.9%) |
Employment Industries by Sex in Point Arena
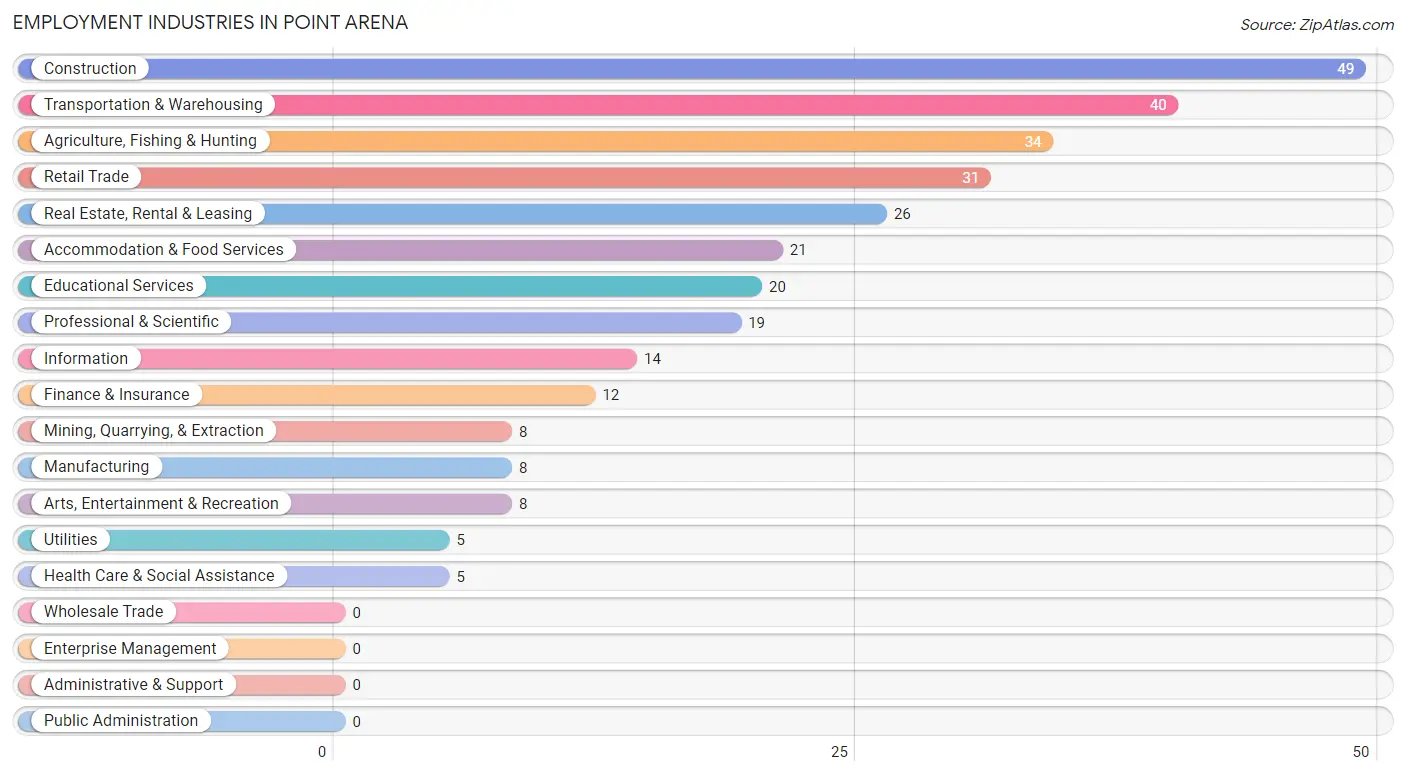
Employment Industries in Point Arena
The major employment industries in Point Arena include Construction (49 | 15.7%), Transportation & Warehousing (40 | 12.8%), Agriculture, Fishing & Hunting (34 | 10.9%), Retail Trade (31 | 9.9%), and Real Estate, Rental & Leasing (26 | 8.3%).
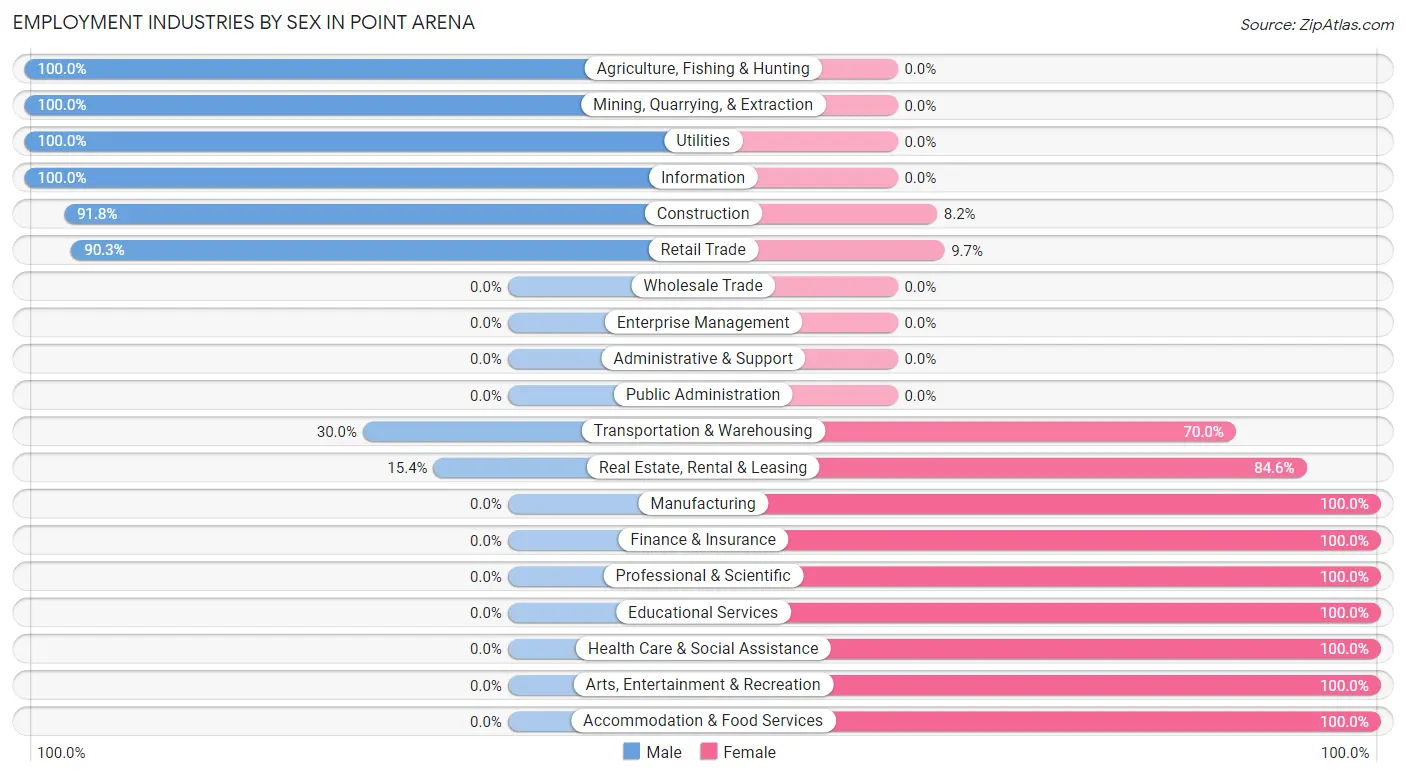
Employment Industries by Sex in Point Arena
The Point Arena industries that see more men than women are Agriculture, Fishing & Hunting (100.0%), Mining, Quarrying, & Extraction (100.0%), and Utilities (100.0%), whereas the industries that tend to have a higher number of women are Manufacturing (100.0%), Finance & Insurance (100.0%), and Professional & Scientific (100.0%).
| Industry | Male | Female |
| Agriculture, Fishing & Hunting | 34 (100.0%) | 0 (0.0%) |
| Mining, Quarrying, & Extraction | 8 (100.0%) | 0 (0.0%) |
| Construction | 45 (91.8%) | 4 (8.2%) |
| Manufacturing | 0 (0.0%) | 8 (100.0%) |
| Wholesale Trade | 0 (0.0%) | 0 (0.0%) |
| Retail Trade | 28 (90.3%) | 3 (9.7%) |
| Transportation & Warehousing | 12 (30.0%) | 28 (70.0%) |
| Utilities | 5 (100.0%) | 0 (0.0%) |
| Information | 14 (100.0%) | 0 (0.0%) |
| Finance & Insurance | 0 (0.0%) | 12 (100.0%) |
| Real Estate, Rental & Leasing | 4 (15.4%) | 22 (84.6%) |
| Professional & Scientific | 0 (0.0%) | 19 (100.0%) |
| Enterprise Management | 0 (0.0%) | 0 (0.0%) |
| Administrative & Support | 0 (0.0%) | 0 (0.0%) |
| Educational Services | 0 (0.0%) | 20 (100.0%) |
| Health Care & Social Assistance | 0 (0.0%) | 5 (100.0%) |
| Arts, Entertainment & Recreation | 0 (0.0%) | 8 (100.0%) |
| Accommodation & Food Services | 0 (0.0%) | 21 (100.0%) |
| Public Administration | 0 (0.0%) | 0 (0.0%) |
| Total | 150 (48.1%) | 162 (51.9%) |
Education in Point Arena
School Enrollment in Point Arena
The most common levels of schooling among the 203 students in Point Arena are high school (62 | 30.5%), middle school (53 | 26.1%), and elementary school (48 | 23.6%).
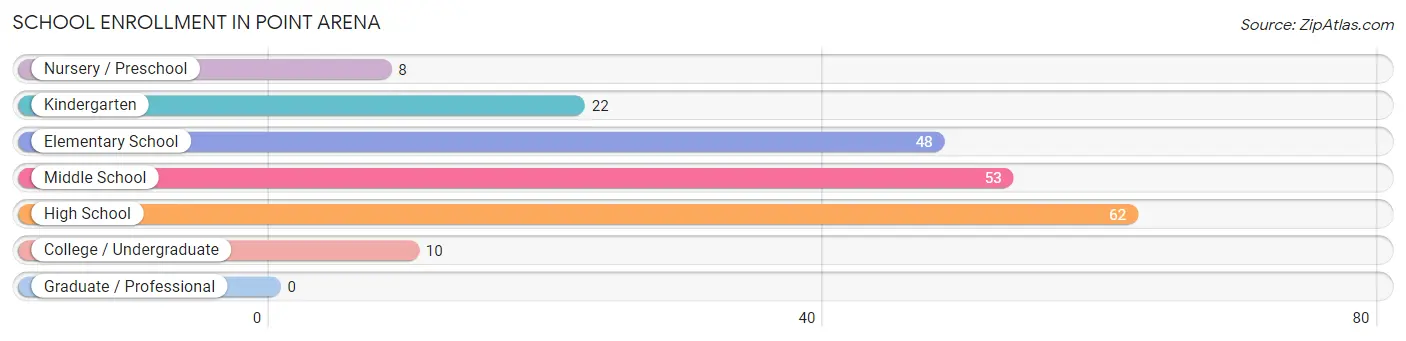
| School Level | # Students | % Students |
| Nursery / Preschool | 8 | 3.9% |
| Kindergarten | 22 | 10.8% |
| Elementary School | 48 | 23.6% |
| Middle School | 53 | 26.1% |
| High School | 62 | 30.5% |
| College / Undergraduate | 10 | 4.9% |
| Graduate / Professional | 0 | 0.0% |
| Total | 203 | 100.0% |
School Enrollment by Age by Funding Source in Point Arena
Out of a total of 203 students who are enrolled in schools in Point Arena, 5 (2.5%) attend a private institution, while the remaining 198 (97.5%) are enrolled in public schools. The age group of 10 to 14 year olds has the highest likelihood of being enrolled in private schools, with 5 (9.4% in the age bracket) enrolled. Conversely, the age group of 3 to 4 year olds has the lowest likelihood of being enrolled in a private school, with 8 (100.0% in the age bracket) attending a public institution.
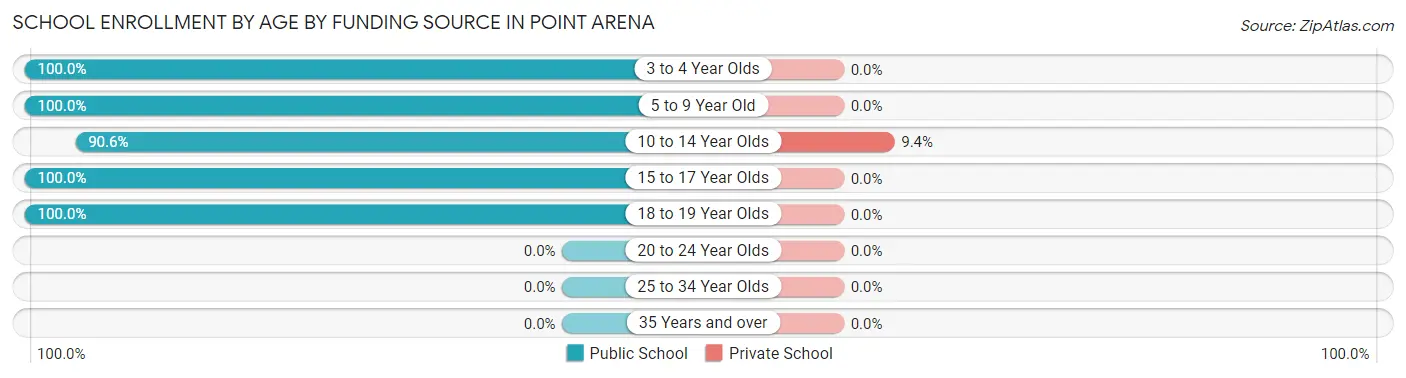
| Age Bracket | Public School | Private School |
| 3 to 4 Year Olds | 8 (100.0%) | 0 (0.0%) |
| 5 to 9 Year Old | 70 (100.0%) | 0 (0.0%) |
| 10 to 14 Year Olds | 48 (90.6%) | 5 (9.4%) |
| 15 to 17 Year Olds | 53 (100.0%) | 0 (0.0%) |
| 18 to 19 Year Olds | 19 (100.0%) | 0 (0.0%) |
| 20 to 24 Year Olds | 0 (0.0%) | 0 (0.0%) |
| 25 to 34 Year Olds | 0 (0.0%) | 0 (0.0%) |
| 35 Years and over | 0 (0.0%) | 0 (0.0%) |
| Total | 198 (97.5%) | 5 (2.5%) |
Educational Attainment by Field of Study in Point Arena
Liberal arts & history (17 | 18.9%), engineering (16 | 17.8%), literature & languages (16 | 17.8%), social sciences (15 | 16.7%), and business (14 | 15.6%) are the most common fields of study among 90 individuals in Point Arena who have obtained a bachelor's degree or higher.
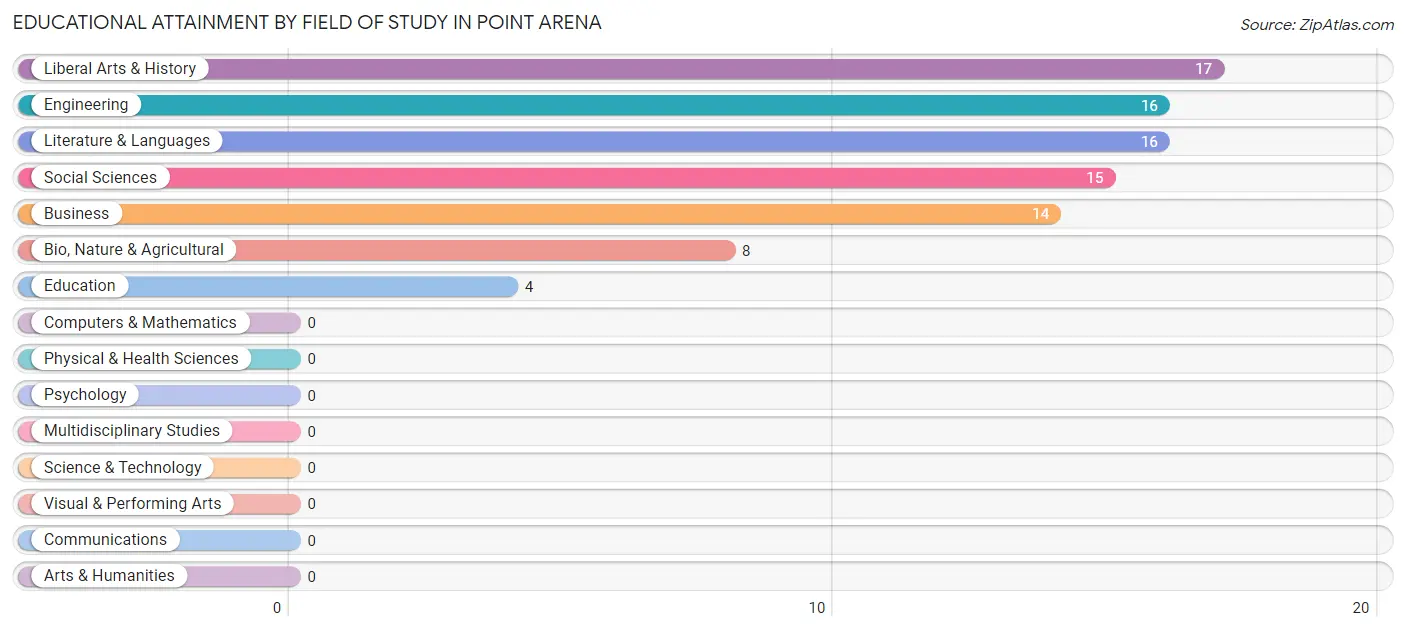
| Field of Study | # Graduates | % Graduates |
| Computers & Mathematics | 0 | 0.0% |
| Bio, Nature & Agricultural | 8 | 8.9% |
| Physical & Health Sciences | 0 | 0.0% |
| Psychology | 0 | 0.0% |
| Social Sciences | 15 | 16.7% |
| Engineering | 16 | 17.8% |
| Multidisciplinary Studies | 0 | 0.0% |
| Science & Technology | 0 | 0.0% |
| Business | 14 | 15.6% |
| Education | 4 | 4.4% |
| Literature & Languages | 16 | 17.8% |
| Liberal Arts & History | 17 | 18.9% |
| Visual & Performing Arts | 0 | 0.0% |
| Communications | 0 | 0.0% |
| Arts & Humanities | 0 | 0.0% |
| Total | 90 | 100.0% |
Transportation & Commute in Point Arena
Vehicle Availability by Sex in Point Arena
The most prevalent vehicle ownership categories in Point Arena are males with 2 vehicles (65, accounting for 43.3%) and females with 2 vehicles (108, making up 40.1%).
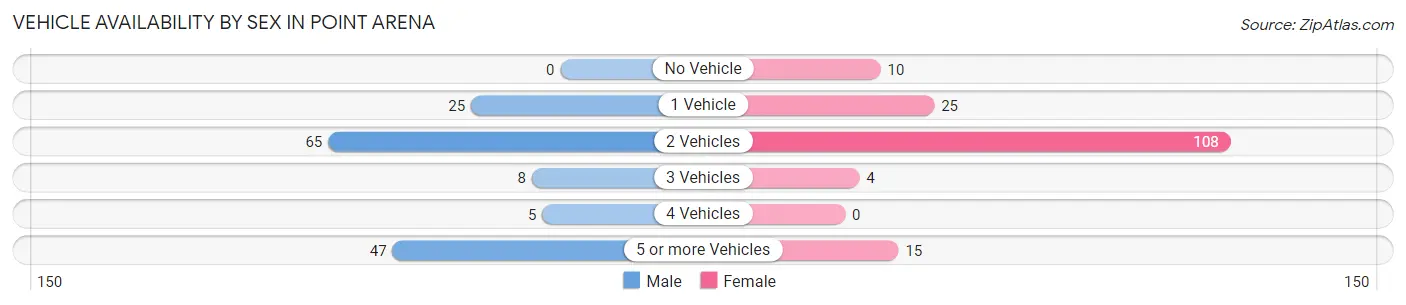
| Vehicles Available | Male | Female |
| No Vehicle | 0 (0.0%) | 10 (6.2%) |
| 1 Vehicle | 25 (16.7%) | 25 (15.4%) |
| 2 Vehicles | 65 (43.3%) | 108 (66.7%) |
| 3 Vehicles | 8 (5.3%) | 4 (2.5%) |
| 4 Vehicles | 5 (3.3%) | 0 (0.0%) |
| 5 or more Vehicles | 47 (31.3%) | 15 (9.3%) |
| Total | 150 (100.0%) | 162 (100.0%) |
Commute Time in Point Arena
The most frequently occuring commute durations in Point Arena are 5 to 9 minutes (76 commuters, 31.1%), 10 to 14 minutes (58 commuters, 23.8%), and 45 to 59 minutes (29 commuters, 11.9%).
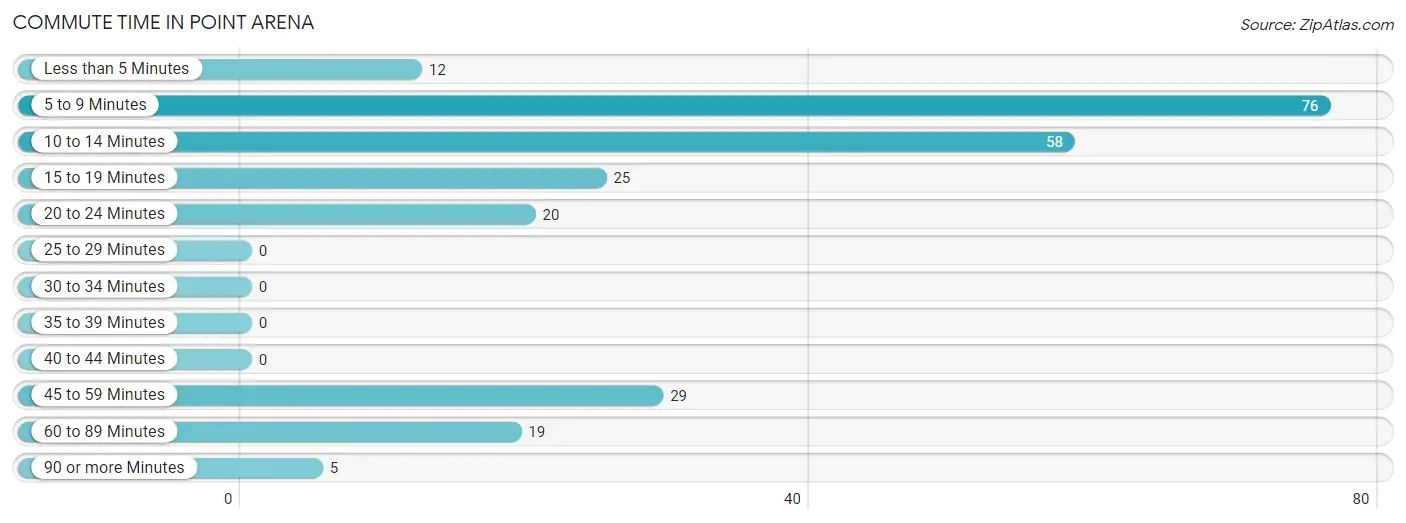
| Commute Time | # Commuters | % Commuters |
| Less than 5 Minutes | 12 | 4.9% |
| 5 to 9 Minutes | 76 | 31.1% |
| 10 to 14 Minutes | 58 | 23.8% |
| 15 to 19 Minutes | 25 | 10.2% |
| 20 to 24 Minutes | 20 | 8.2% |
| 25 to 29 Minutes | 0 | 0.0% |
| 30 to 34 Minutes | 0 | 0.0% |
| 35 to 39 Minutes | 0 | 0.0% |
| 40 to 44 Minutes | 0 | 0.0% |
| 45 to 59 Minutes | 29 | 11.9% |
| 60 to 89 Minutes | 19 | 7.8% |
| 90 or more Minutes | 5 | 2.1% |
Commute Time by Sex in Point Arena
The most common commute times in Point Arena are 5 to 9 minutes (41 commuters, 27.3%) for males and 5 to 9 minutes (35 commuters, 37.2%) for females.
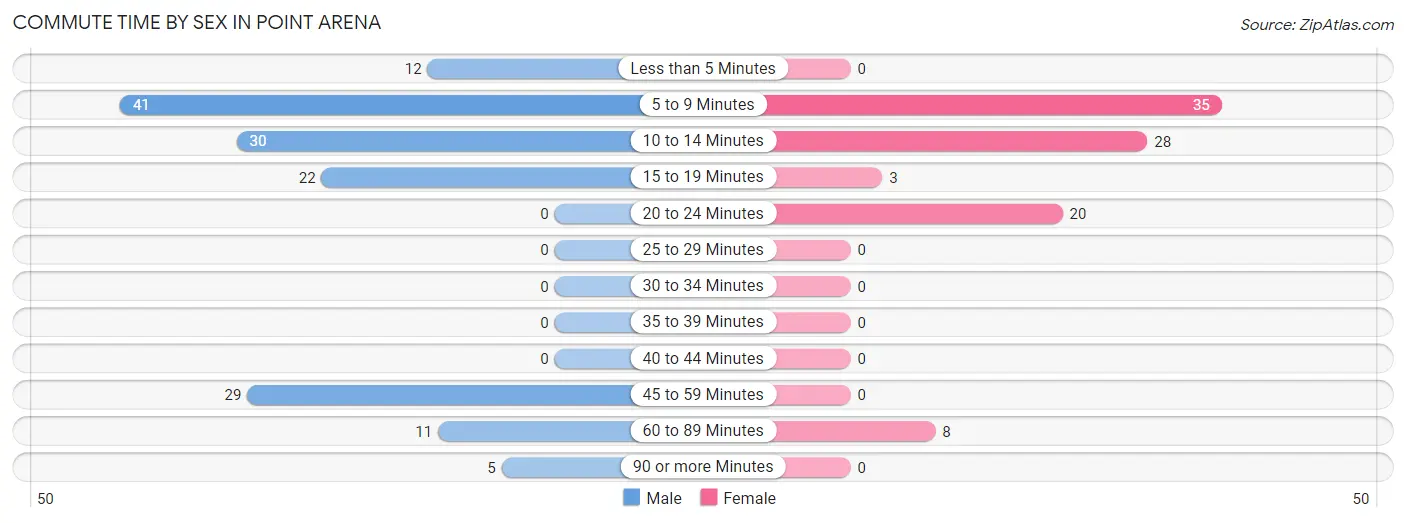
| Commute Time | Male | Female |
| Less than 5 Minutes | 12 (8.0%) | 0 (0.0%) |
| 5 to 9 Minutes | 41 (27.3%) | 35 (37.2%) |
| 10 to 14 Minutes | 30 (20.0%) | 28 (29.8%) |
| 15 to 19 Minutes | 22 (14.7%) | 3 (3.2%) |
| 20 to 24 Minutes | 0 (0.0%) | 20 (21.3%) |
| 25 to 29 Minutes | 0 (0.0%) | 0 (0.0%) |
| 30 to 34 Minutes | 0 (0.0%) | 0 (0.0%) |
| 35 to 39 Minutes | 0 (0.0%) | 0 (0.0%) |
| 40 to 44 Minutes | 0 (0.0%) | 0 (0.0%) |
| 45 to 59 Minutes | 29 (19.3%) | 0 (0.0%) |
| 60 to 89 Minutes | 11 (7.3%) | 8 (8.5%) |
| 90 or more Minutes | 5 (3.3%) | 0 (0.0%) |
Time of Departure to Work by Sex in Point Arena
The most frequent times of departure to work in Point Arena are 6:00 AM to 6:29 AM (44, 29.3%) for males and 8:00 AM to 8:29 AM (52, 55.3%) for females.
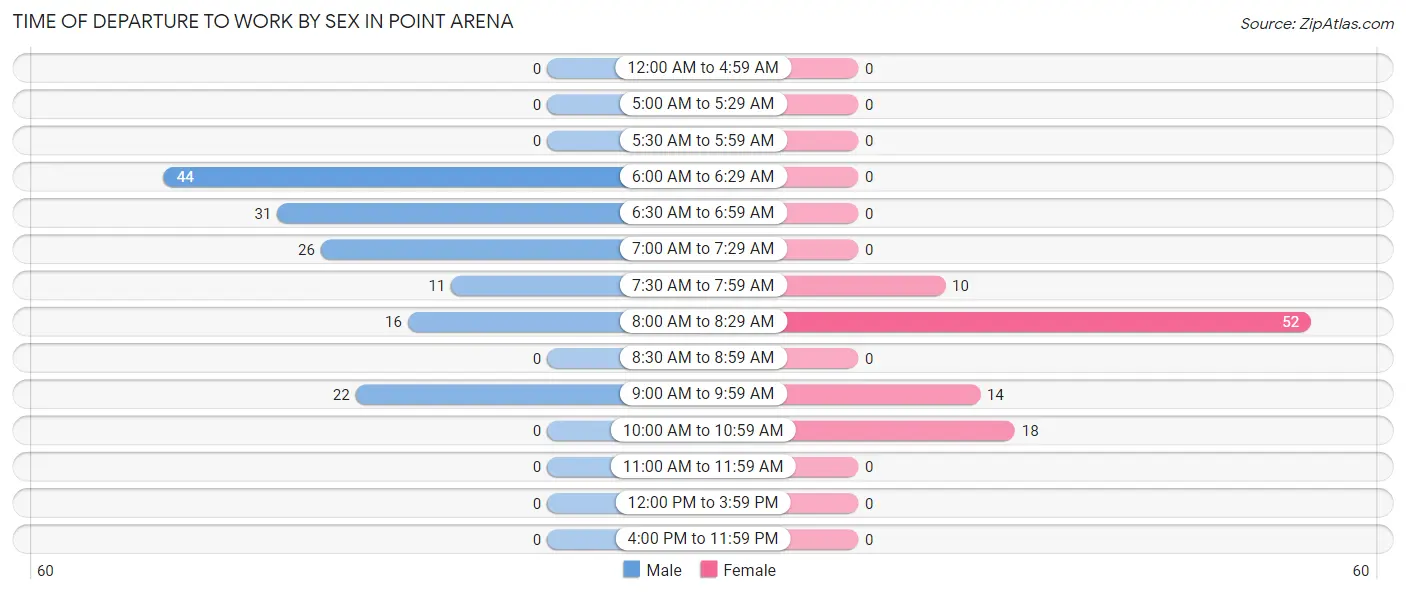
| Time of Departure | Male | Female |
| 12:00 AM to 4:59 AM | 0 (0.0%) | 0 (0.0%) |
| 5:00 AM to 5:29 AM | 0 (0.0%) | 0 (0.0%) |
| 5:30 AM to 5:59 AM | 0 (0.0%) | 0 (0.0%) |
| 6:00 AM to 6:29 AM | 44 (29.3%) | 0 (0.0%) |
| 6:30 AM to 6:59 AM | 31 (20.7%) | 0 (0.0%) |
| 7:00 AM to 7:29 AM | 26 (17.3%) | 0 (0.0%) |
| 7:30 AM to 7:59 AM | 11 (7.3%) | 10 (10.6%) |
| 8:00 AM to 8:29 AM | 16 (10.7%) | 52 (55.3%) |
| 8:30 AM to 8:59 AM | 0 (0.0%) | 0 (0.0%) |
| 9:00 AM to 9:59 AM | 22 (14.7%) | 14 (14.9%) |
| 10:00 AM to 10:59 AM | 0 (0.0%) | 18 (19.2%) |
| 11:00 AM to 11:59 AM | 0 (0.0%) | 0 (0.0%) |
| 12:00 PM to 3:59 PM | 0 (0.0%) | 0 (0.0%) |
| 4:00 PM to 11:59 PM | 0 (0.0%) | 0 (0.0%) |
| Total | 150 (100.0%) | 94 (100.0%) |
Housing Occupancy in Point Arena
Occupancy by Ownership in Point Arena
Of the total 219 dwellings in Point Arena, owner-occupied units account for 107 (48.9%), while renter-occupied units make up 112 (51.1%).
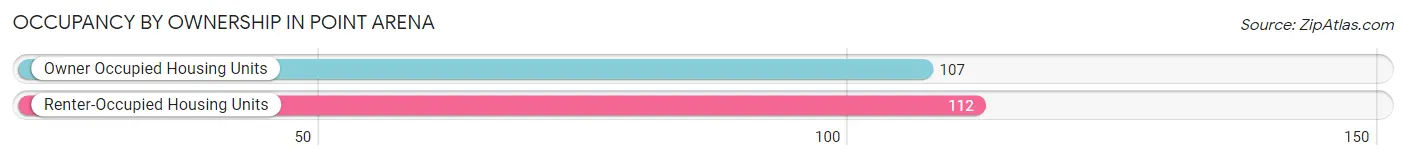
| Occupancy | # Housing Units | % Housing Units |
| Owner Occupied Housing Units | 107 | 48.9% |
| Renter-Occupied Housing Units | 112 | 51.1% |
| Total Occupied Housing Units | 219 | 100.0% |
Occupancy by Household Size in Point Arena
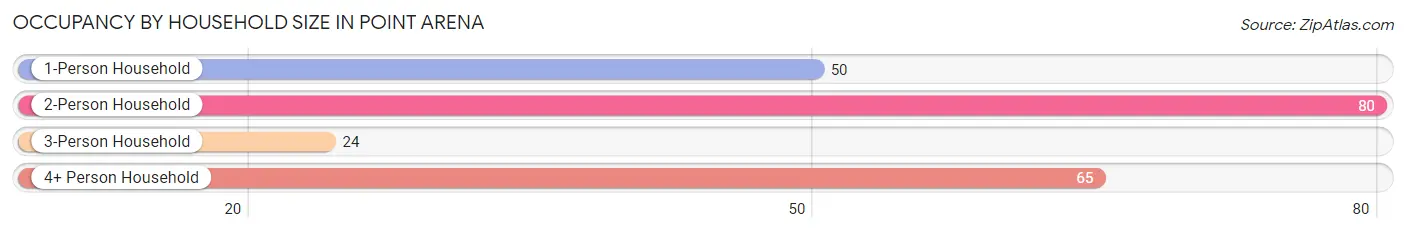
| Household Size | # Housing Units | % Housing Units |
| 1-Person Household | 50 | 22.8% |
| 2-Person Household | 80 | 36.5% |
| 3-Person Household | 24 | 11.0% |
| 4+ Person Household | 65 | 29.7% |
| Total Housing Units | 219 | 100.0% |
Occupancy by Ownership by Household Size in Point Arena
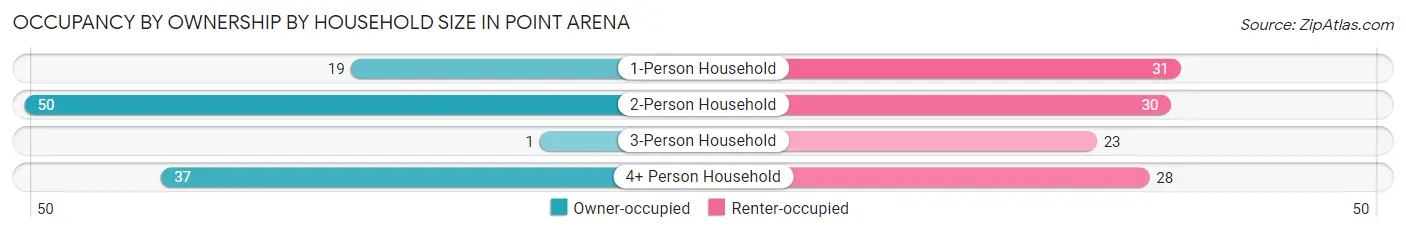
| Household Size | Owner-occupied | Renter-occupied |
| 1-Person Household | 19 (38.0%) | 31 (62.0%) |
| 2-Person Household | 50 (62.5%) | 30 (37.5%) |
| 3-Person Household | 1 (4.2%) | 23 (95.8%) |
| 4+ Person Household | 37 (56.9%) | 28 (43.1%) |
| Total Housing Units | 107 (48.9%) | 112 (51.1%) |
Occupancy by Educational Attainment in Point Arena
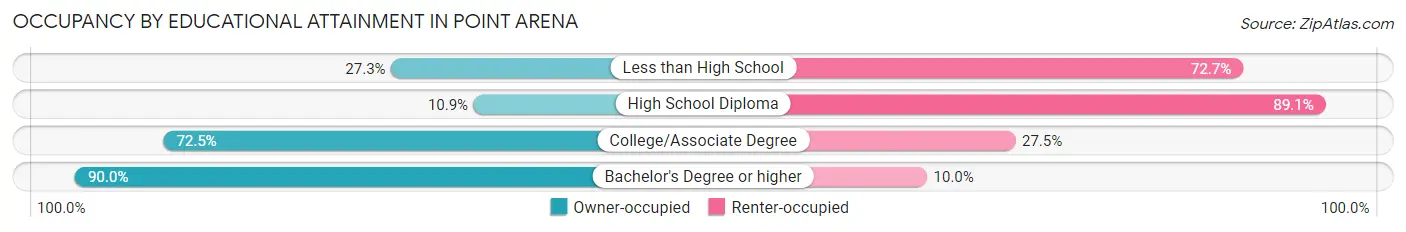
| Household Size | Owner-occupied | Renter-occupied |
| Less than High School | 15 (27.3%) | 40 (72.7%) |
| High School Diploma | 6 (10.9%) | 49 (89.1%) |
| College/Associate Degree | 50 (72.5%) | 19 (27.5%) |
| Bachelor's Degree or higher | 36 (90.0%) | 4 (10.0%) |
Occupancy by Age of Householder in Point Arena
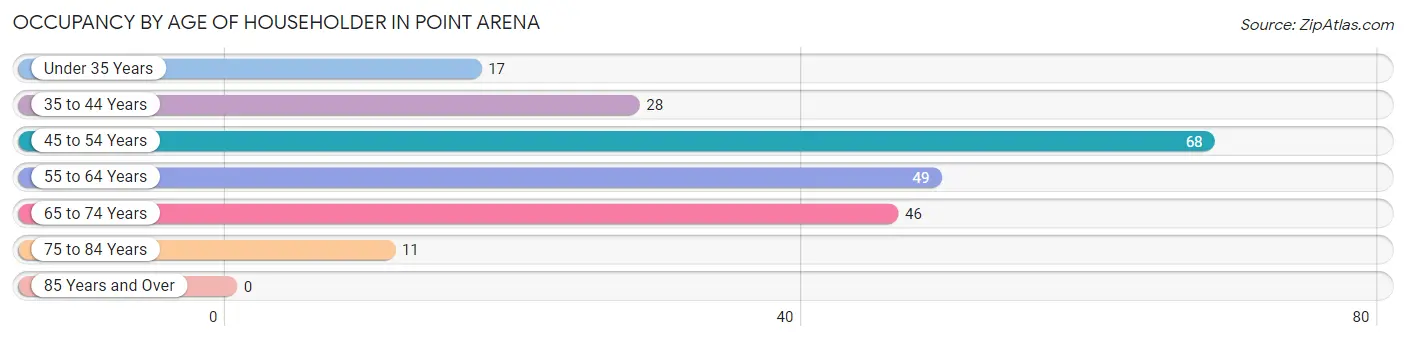
| Age Bracket | # Households | % Households |
| Under 35 Years | 17 | 7.8% |
| 35 to 44 Years | 28 | 12.8% |
| 45 to 54 Years | 68 | 31.0% |
| 55 to 64 Years | 49 | 22.4% |
| 65 to 74 Years | 46 | 21.0% |
| 75 to 84 Years | 11 | 5.0% |
| 85 Years and Over | 0 | 0.0% |
| Total | 219 | 100.0% |
Housing Finances in Point Arena
Median Income by Occupancy in Point Arena
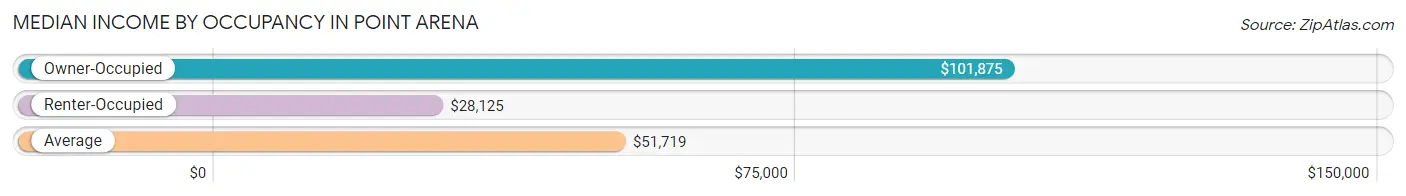
| Occupancy Type | # Households | Median Income |
| Owner-Occupied | 107 (48.9%) | $101,875 |
| Renter-Occupied | 112 (51.1%) | $28,125 |
| Average | 219 (100.0%) | $51,719 |
Occupancy by Householder Income Bracket in Point Arena
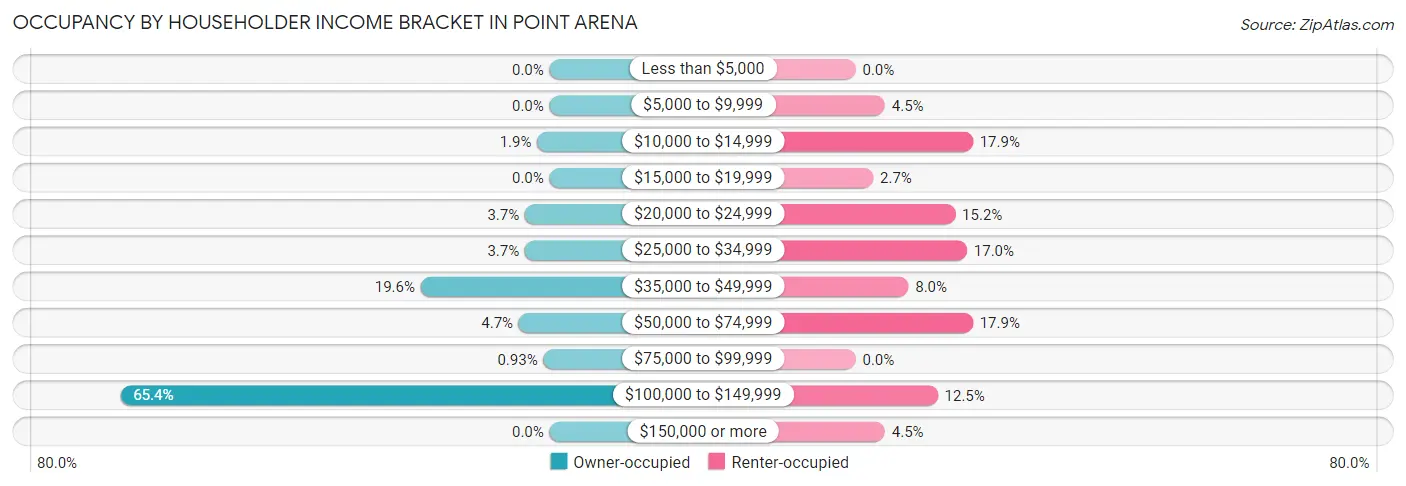
| Income Bracket | Owner-occupied | Renter-occupied |
| Less than $5,000 | 0 (0.0%) | 0 (0.0%) |
| $5,000 to $9,999 | 0 (0.0%) | 5 (4.5%) |
| $10,000 to $14,999 | 2 (1.9%) | 20 (17.9%) |
| $15,000 to $19,999 | 0 (0.0%) | 3 (2.7%) |
| $20,000 to $24,999 | 4 (3.7%) | 17 (15.2%) |
| $25,000 to $34,999 | 4 (3.7%) | 19 (17.0%) |
| $35,000 to $49,999 | 21 (19.6%) | 9 (8.0%) |
| $50,000 to $74,999 | 5 (4.7%) | 20 (17.9%) |
| $75,000 to $99,999 | 1 (0.9%) | 0 (0.0%) |
| $100,000 to $149,999 | 70 (65.4%) | 14 (12.5%) |
| $150,000 or more | 0 (0.0%) | 5 (4.5%) |
| Total | 107 (100.0%) | 112 (100.0%) |
Monthly Housing Cost Tiers in Point Arena
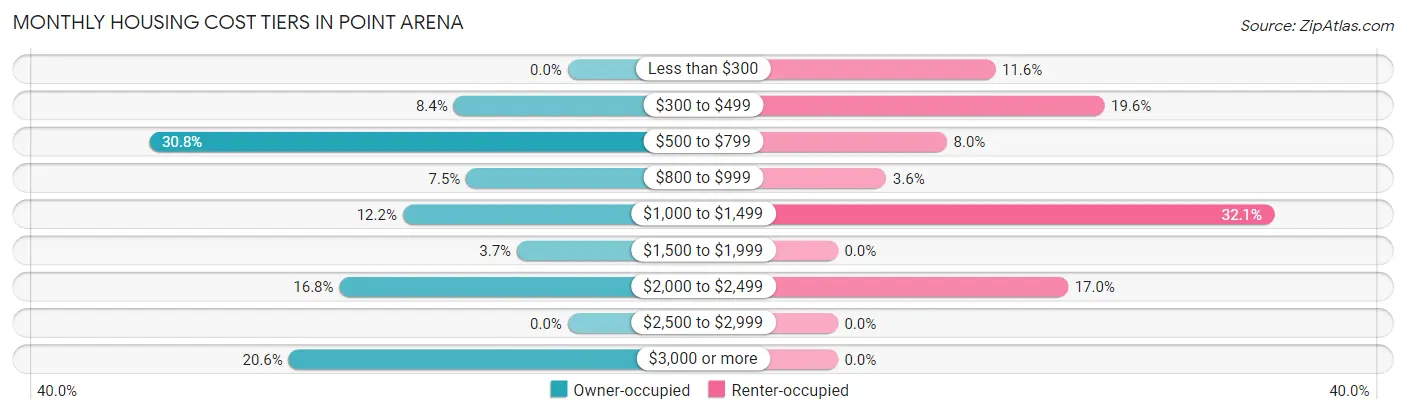
| Monthly Cost | Owner-occupied | Renter-occupied |
| Less than $300 | 0 (0.0%) | 13 (11.6%) |
| $300 to $499 | 9 (8.4%) | 22 (19.6%) |
| $500 to $799 | 33 (30.8%) | 9 (8.0%) |
| $800 to $999 | 8 (7.5%) | 4 (3.6%) |
| $1,000 to $1,499 | 13 (12.1%) | 36 (32.1%) |
| $1,500 to $1,999 | 4 (3.7%) | 0 (0.0%) |
| $2,000 to $2,499 | 18 (16.8%) | 19 (17.0%) |
| $2,500 to $2,999 | 0 (0.0%) | 0 (0.0%) |
| $3,000 or more | 22 (20.6%) | 0 (0.0%) |
| Total | 107 (100.0%) | 112 (100.0%) |
Physical Housing Characteristics in Point Arena
Housing Structures in Point Arena
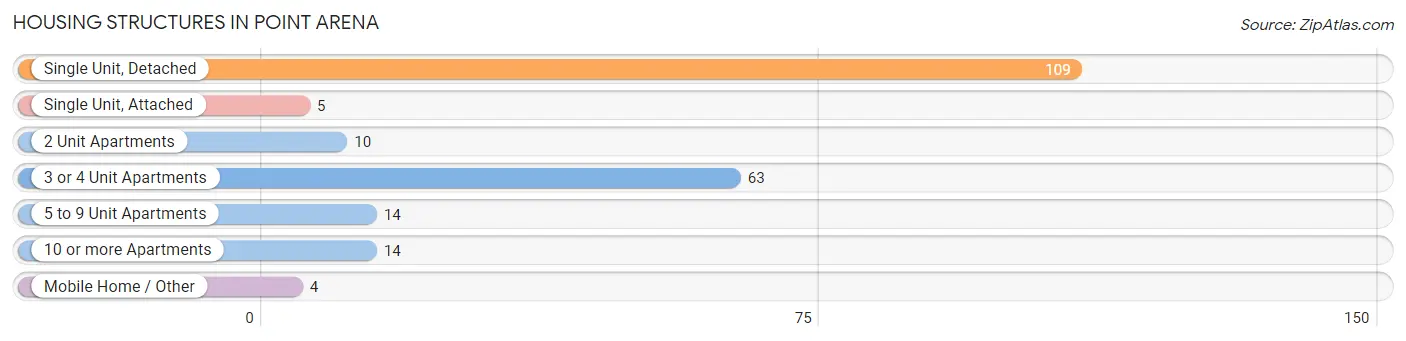
| Structure Type | # Housing Units | % Housing Units |
| Single Unit, Detached | 109 | 49.8% |
| Single Unit, Attached | 5 | 2.3% |
| 2 Unit Apartments | 10 | 4.6% |
| 3 or 4 Unit Apartments | 63 | 28.8% |
| 5 to 9 Unit Apartments | 14 | 6.4% |
| 10 or more Apartments | 14 | 6.4% |
| Mobile Home / Other | 4 | 1.8% |
| Total | 219 | 100.0% |
Housing Structures by Occupancy in Point Arena
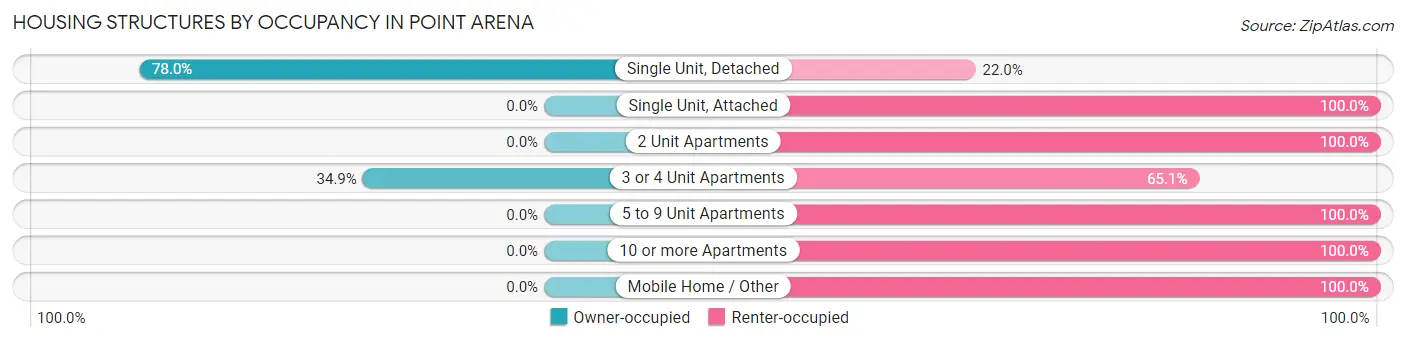
| Structure Type | Owner-occupied | Renter-occupied |
| Single Unit, Detached | 85 (78.0%) | 24 (22.0%) |
| Single Unit, Attached | 0 (0.0%) | 5 (100.0%) |
| 2 Unit Apartments | 0 (0.0%) | 10 (100.0%) |
| 3 or 4 Unit Apartments | 22 (34.9%) | 41 (65.1%) |
| 5 to 9 Unit Apartments | 0 (0.0%) | 14 (100.0%) |
| 10 or more Apartments | 0 (0.0%) | 14 (100.0%) |
| Mobile Home / Other | 0 (0.0%) | 4 (100.0%) |
| Total | 107 (48.9%) | 112 (51.1%) |
Housing Structures by Number of Rooms in Point Arena
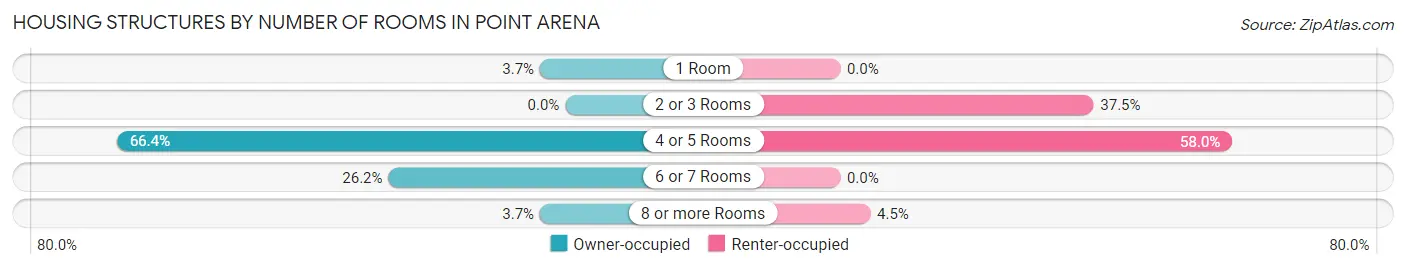
| Number of Rooms | Owner-occupied | Renter-occupied |
| 1 Room | 4 (3.7%) | 0 (0.0%) |
| 2 or 3 Rooms | 0 (0.0%) | 42 (37.5%) |
| 4 or 5 Rooms | 71 (66.4%) | 65 (58.0%) |
| 6 or 7 Rooms | 28 (26.2%) | 0 (0.0%) |
| 8 or more Rooms | 4 (3.7%) | 5 (4.5%) |
| Total | 107 (100.0%) | 112 (100.0%) |
Housing Structure by Heating Type in Point Arena
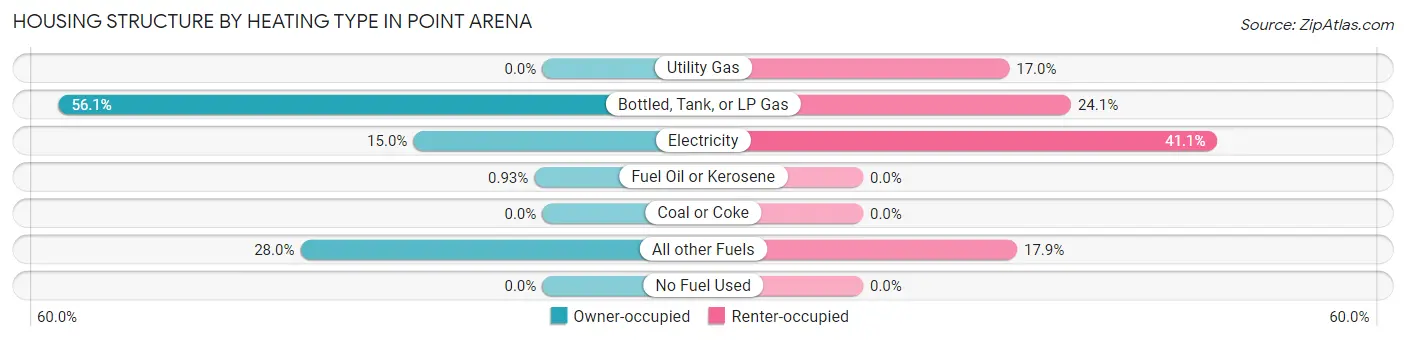
| Heating Type | Owner-occupied | Renter-occupied |
| Utility Gas | 0 (0.0%) | 19 (17.0%) |
| Bottled, Tank, or LP Gas | 60 (56.1%) | 27 (24.1%) |
| Electricity | 16 (14.9%) | 46 (41.1%) |
| Fuel Oil or Kerosene | 1 (0.9%) | 0 (0.0%) |
| Coal or Coke | 0 (0.0%) | 0 (0.0%) |
| All other Fuels | 30 (28.0%) | 20 (17.9%) |
| No Fuel Used | 0 (0.0%) | 0 (0.0%) |
| Total | 107 (100.0%) | 112 (100.0%) |
Household Vehicle Usage in Point Arena
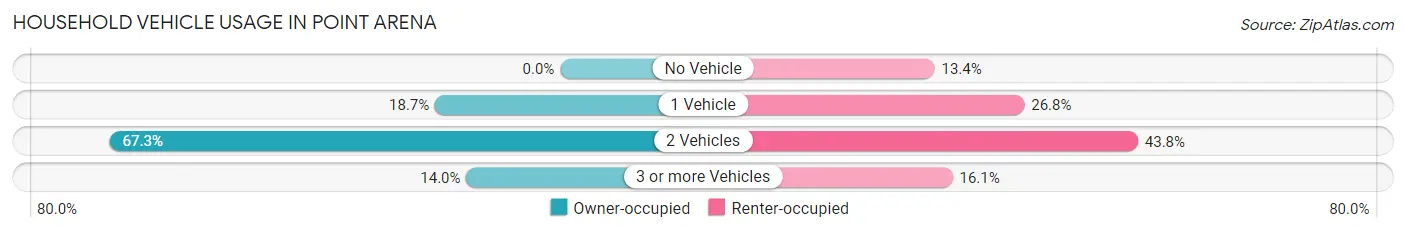
| Vehicles per Household | Owner-occupied | Renter-occupied |
| No Vehicle | 0 (0.0%) | 15 (13.4%) |
| 1 Vehicle | 20 (18.7%) | 30 (26.8%) |
| 2 Vehicles | 72 (67.3%) | 49 (43.8%) |
| 3 or more Vehicles | 15 (14.0%) | 18 (16.1%) |
| Total | 107 (100.0%) | 112 (100.0%) |
Real Estate & Mortgages in Point Arena
Real Estate and Mortgage Overview in Point Arena
| Characteristic | Without Mortgage | With Mortgage |
| Housing Units | 57 | 50 |
| Median Property Value | $407,100 | $352,800 |
| Median Household Income | $114,792 | $0 |
| Monthly Housing Costs | $753 | $22 |
| Real Estate Taxes | $3,955 | $0 |
Property Value by Mortgage Status in Point Arena
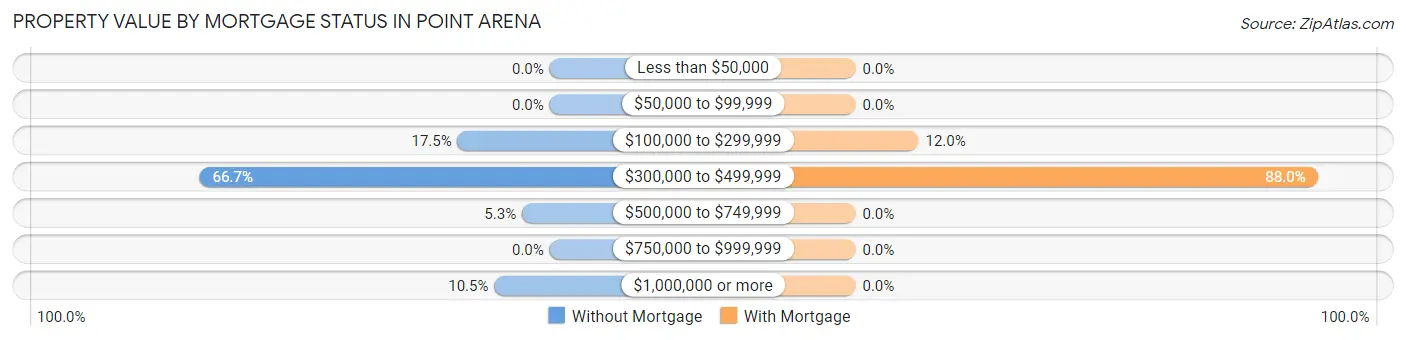
| Property Value | Without Mortgage | With Mortgage |
| Less than $50,000 | 0 (0.0%) | 0 (0.0%) |
| $50,000 to $99,999 | 0 (0.0%) | 0 (0.0%) |
| $100,000 to $299,999 | 10 (17.5%) | 6 (12.0%) |
| $300,000 to $499,999 | 38 (66.7%) | 44 (88.0%) |
| $500,000 to $749,999 | 3 (5.3%) | 0 (0.0%) |
| $750,000 to $999,999 | 0 (0.0%) | 0 (0.0%) |
| $1,000,000 or more | 6 (10.5%) | 0 (0.0%) |
| Total | 57 (100.0%) | 50 (100.0%) |
Household Income by Mortgage Status in Point Arena
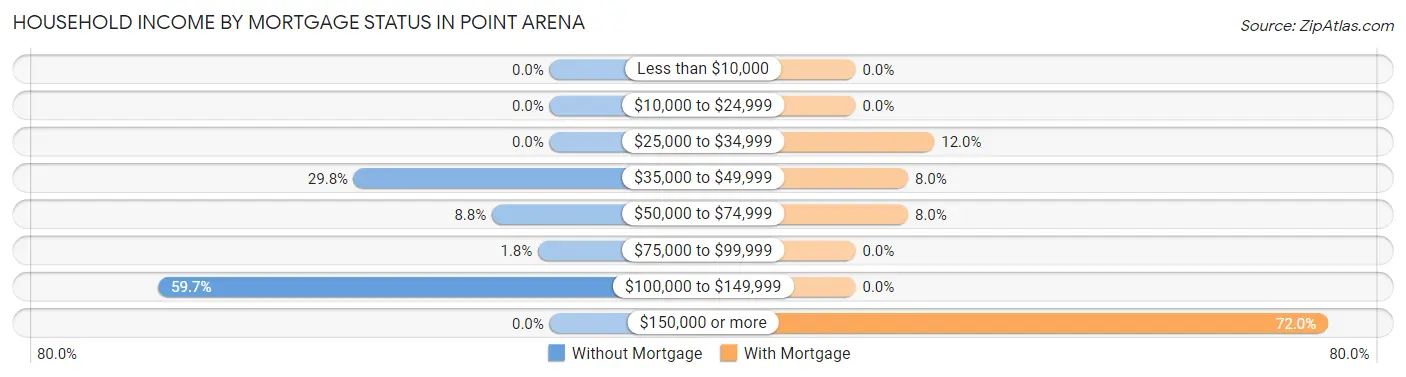
| Household Income | Without Mortgage | With Mortgage |
| Less than $10,000 | 0 (0.0%) | 0 (0.0%) |
| $10,000 to $24,999 | 0 (0.0%) | 0 (0.0%) |
| $25,000 to $34,999 | 0 (0.0%) | 6 (12.0%) |
| $35,000 to $49,999 | 17 (29.8%) | 4 (8.0%) |
| $50,000 to $74,999 | 5 (8.8%) | 4 (8.0%) |
| $75,000 to $99,999 | 1 (1.8%) | 0 (0.0%) |
| $100,000 to $149,999 | 34 (59.7%) | 0 (0.0%) |
| $150,000 or more | 0 (0.0%) | 36 (72.0%) |
| Total | 57 (100.0%) | 50 (100.0%) |
Property Value to Household Income Ratio in Point Arena
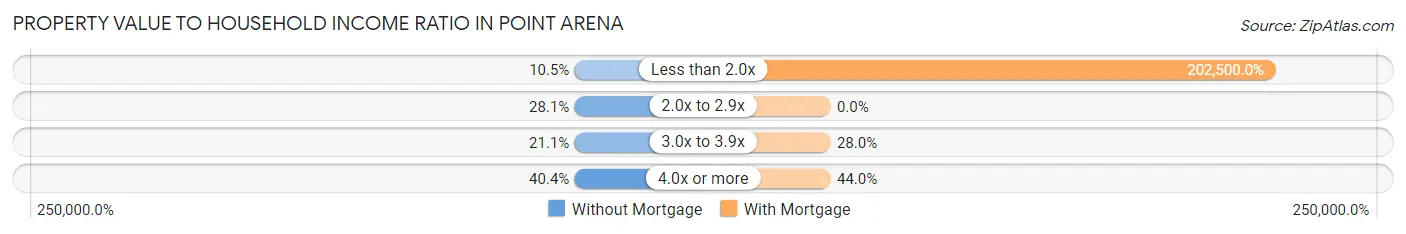
| Value-to-Income Ratio | Without Mortgage | With Mortgage |
| Less than 2.0x | 6 (10.5%) | 101,250 (202,500.0%) |
| 2.0x to 2.9x | 16 (28.1%) | 0 (0.0%) |
| 3.0x to 3.9x | 12 (21.0%) | 14 (28.0%) |
| 4.0x or more | 23 (40.4%) | 22 (44.0%) |
| Total | 57 (100.0%) | 50 (100.0%) |
Real Estate Taxes by Mortgage Status in Point Arena
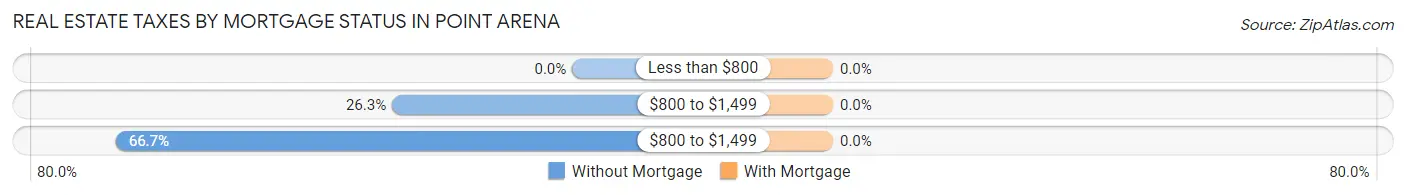
| Property Taxes | Without Mortgage | With Mortgage |
| Less than $800 | 0 (0.0%) | 0 (0.0%) |
| $800 to $1,499 | 15 (26.3%) | 0 (0.0%) |
| $800 to $1,499 | 38 (66.7%) | 0 (0.0%) |
| Total | 57 (100.0%) | 50 (100.0%) |
Health & Disability in Point Arena
Health Insurance Coverage by Age in Point Arena
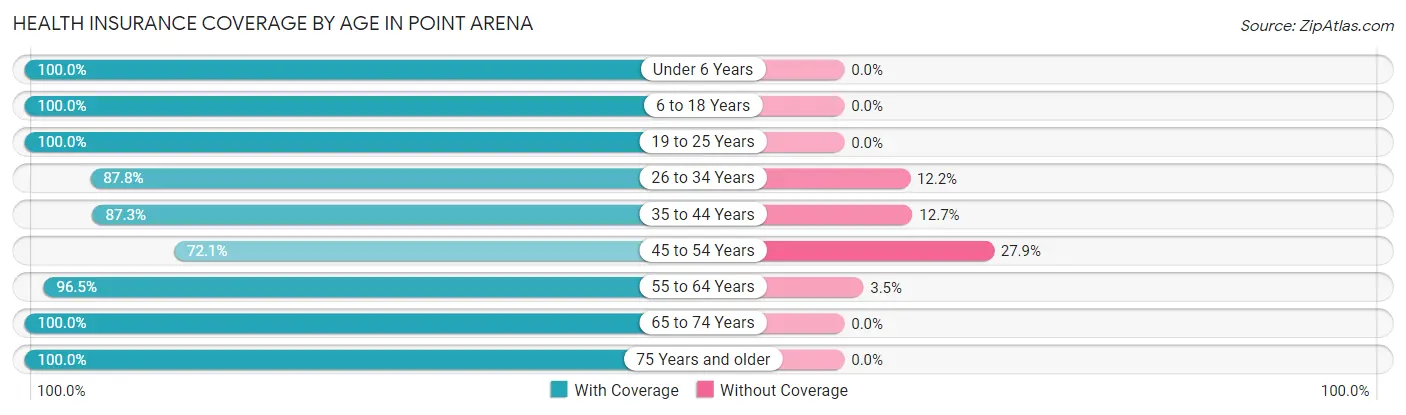
| Age Bracket | With Coverage | Without Coverage |
| Under 6 Years | 21 (100.0%) | 0 (0.0%) |
| 6 to 18 Years | 185 (100.0%) | 0 (0.0%) |
| 19 to 25 Years | 15 (100.0%) | 0 (0.0%) |
| 26 to 34 Years | 43 (87.8%) | 6 (12.2%) |
| 35 to 44 Years | 55 (87.3%) | 8 (12.7%) |
| 45 to 54 Years | 75 (72.1%) | 29 (27.9%) |
| 55 to 64 Years | 109 (96.5%) | 4 (3.5%) |
| 65 to 74 Years | 61 (100.0%) | 0 (0.0%) |
| 75 Years and older | 50 (100.0%) | 0 (0.0%) |
| Total | 614 (92.9%) | 47 (7.1%) |
Health Insurance Coverage by Citizenship Status in Point Arena
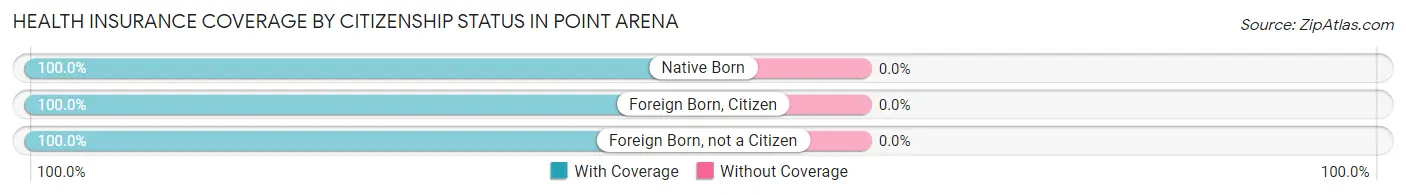
| Citizenship Status | With Coverage | Without Coverage |
| Native Born | 21 (100.0%) | 0 (0.0%) |
| Foreign Born, Citizen | 185 (100.0%) | 0 (0.0%) |
| Foreign Born, not a Citizen | 15 (100.0%) | 0 (0.0%) |
Health Insurance Coverage by Household Income in Point Arena
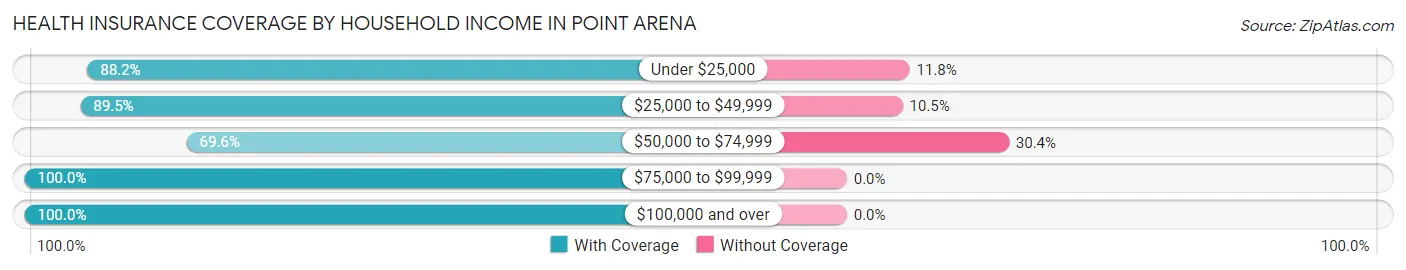
| Household Income | With Coverage | Without Coverage |
| Under $25,000 | 105 (88.2%) | 14 (11.8%) |
| $25,000 to $49,999 | 137 (89.5%) | 16 (10.5%) |
| $50,000 to $74,999 | 39 (69.6%) | 17 (30.4%) |
| $75,000 to $99,999 | 5 (100.0%) | 0 (0.0%) |
| $100,000 and over | 328 (100.0%) | 0 (0.0%) |
Public vs Private Health Insurance Coverage by Age in Point Arena
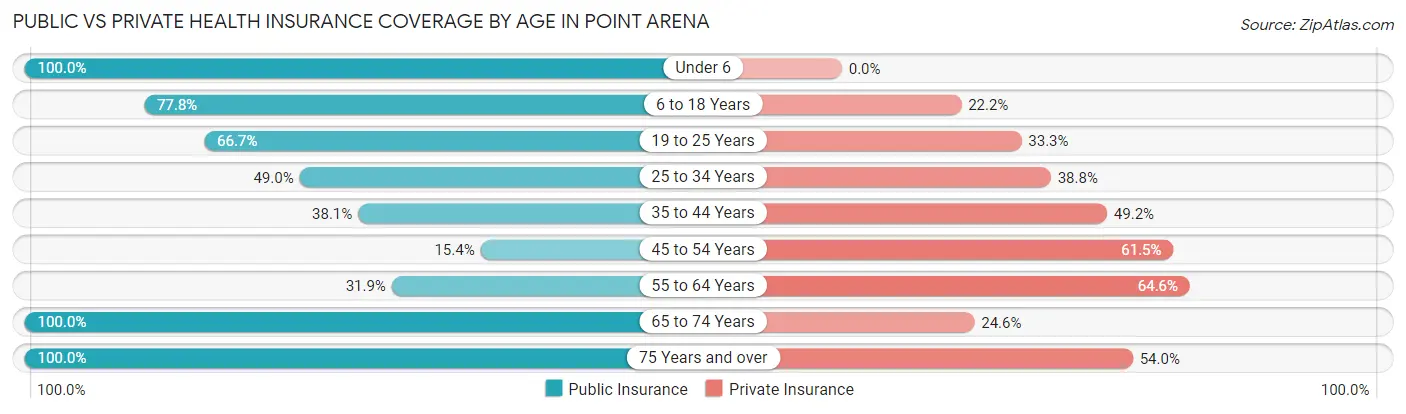
| Age Bracket | Public Insurance | Private Insurance |
| Under 6 | 21 (100.0%) | 0 (0.0%) |
| 6 to 18 Years | 144 (77.8%) | 41 (22.2%) |
| 19 to 25 Years | 10 (66.7%) | 5 (33.3%) |
| 25 to 34 Years | 24 (49.0%) | 19 (38.8%) |
| 35 to 44 Years | 24 (38.1%) | 31 (49.2%) |
| 45 to 54 Years | 16 (15.4%) | 64 (61.5%) |
| 55 to 64 Years | 36 (31.9%) | 73 (64.6%) |
| 65 to 74 Years | 61 (100.0%) | 15 (24.6%) |
| 75 Years and over | 50 (100.0%) | 27 (54.0%) |
| Total | 386 (58.4%) | 275 (41.6%) |
Disability Status by Sex by Age in Point Arena
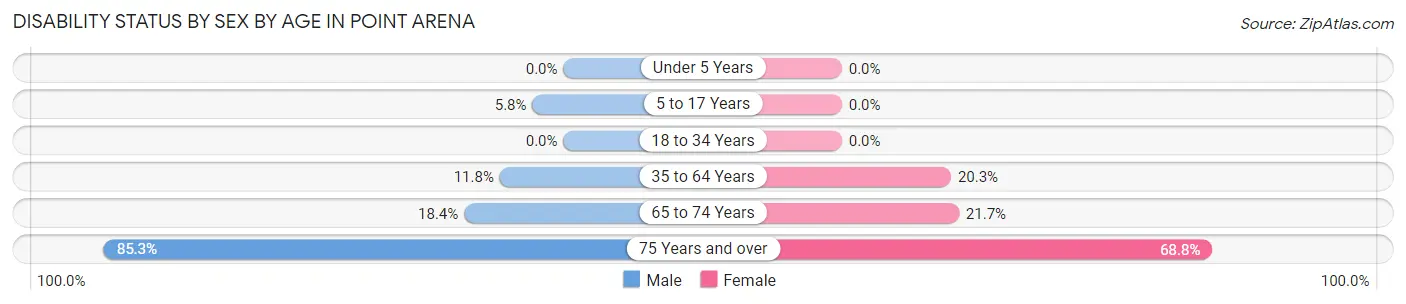
| Age Bracket | Male | Female |
| Under 5 Years | 0 (0.0%) | 0 (0.0%) |
| 5 to 17 Years | 5 (5.8%) | 0 (0.0%) |
| 18 to 34 Years | 0 (0.0%) | 0 (0.0%) |
| 35 to 64 Years | 15 (11.8%) | 31 (20.3%) |
| 65 to 74 Years | 7 (18.4%) | 5 (21.7%) |
| 75 Years and over | 29 (85.3%) | 11 (68.8%) |
Disability Class by Sex by Age in Point Arena
Disability Class: Hearing Difficulty
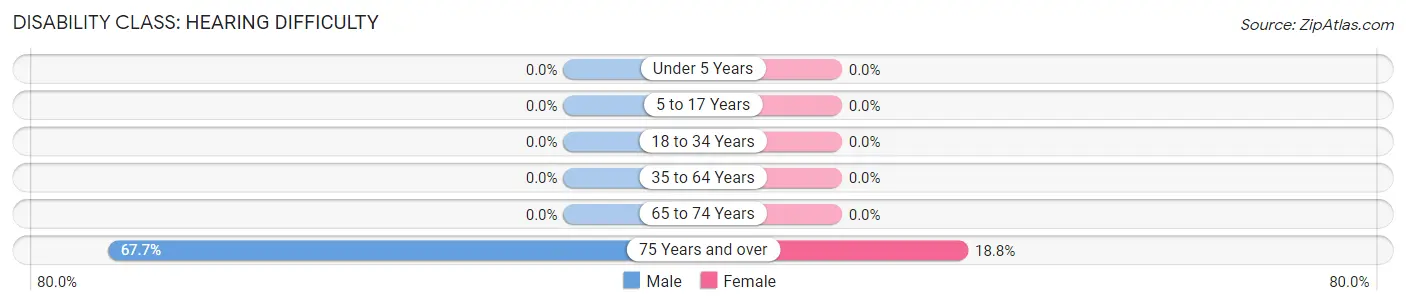
| Age Bracket | Male | Female |
| Under 5 Years | 0 (0.0%) | 0 (0.0%) |
| 5 to 17 Years | 0 (0.0%) | 0 (0.0%) |
| 18 to 34 Years | 0 (0.0%) | 0 (0.0%) |
| 35 to 64 Years | 0 (0.0%) | 0 (0.0%) |
| 65 to 74 Years | 0 (0.0%) | 0 (0.0%) |
| 75 Years and over | 23 (67.6%) | 3 (18.8%) |
Disability Class: Vision Difficulty
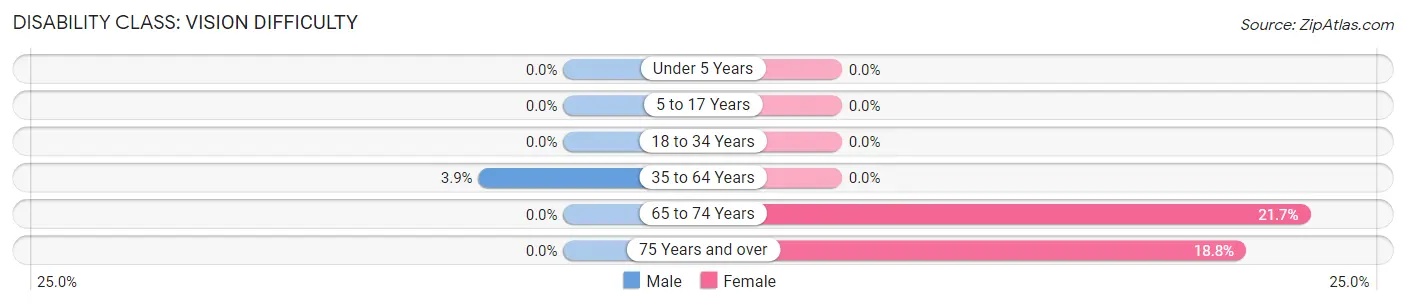
| Age Bracket | Male | Female |
| Under 5 Years | 0 (0.0%) | 0 (0.0%) |
| 5 to 17 Years | 0 (0.0%) | 0 (0.0%) |
| 18 to 34 Years | 0 (0.0%) | 0 (0.0%) |
| 35 to 64 Years | 5 (3.9%) | 0 (0.0%) |
| 65 to 74 Years | 0 (0.0%) | 5 (21.7%) |
| 75 Years and over | 0 (0.0%) | 3 (18.8%) |
Disability Class: Cognitive Difficulty
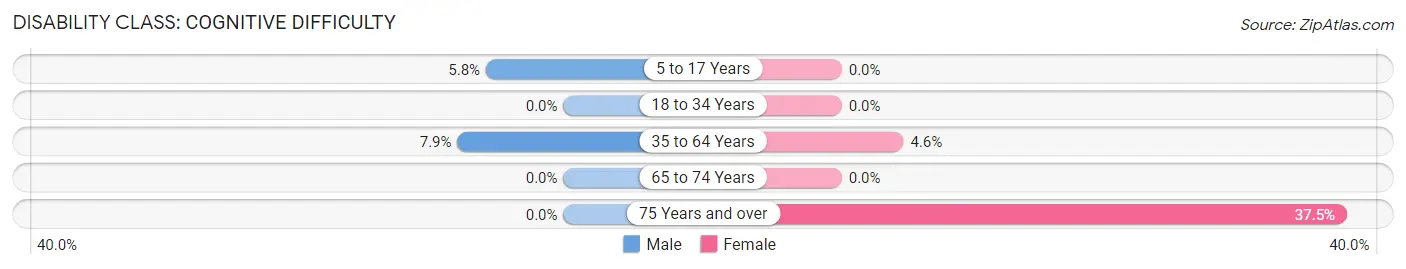
| Age Bracket | Male | Female |
| 5 to 17 Years | 5 (5.8%) | 0 (0.0%) |
| 18 to 34 Years | 0 (0.0%) | 0 (0.0%) |
| 35 to 64 Years | 10 (7.9%) | 7 (4.6%) |
| 65 to 74 Years | 0 (0.0%) | 0 (0.0%) |
| 75 Years and over | 0 (0.0%) | 6 (37.5%) |
Disability Class: Ambulatory Difficulty
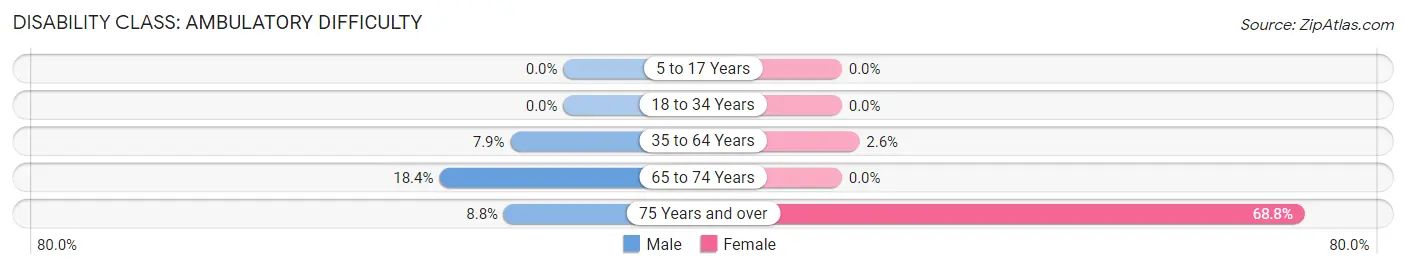
| Age Bracket | Male | Female |
| 5 to 17 Years | 0 (0.0%) | 0 (0.0%) |
| 18 to 34 Years | 0 (0.0%) | 0 (0.0%) |
| 35 to 64 Years | 10 (7.9%) | 4 (2.6%) |
| 65 to 74 Years | 7 (18.4%) | 0 (0.0%) |
| 75 Years and over | 3 (8.8%) | 11 (68.8%) |
Disability Class: Self-Care Difficulty
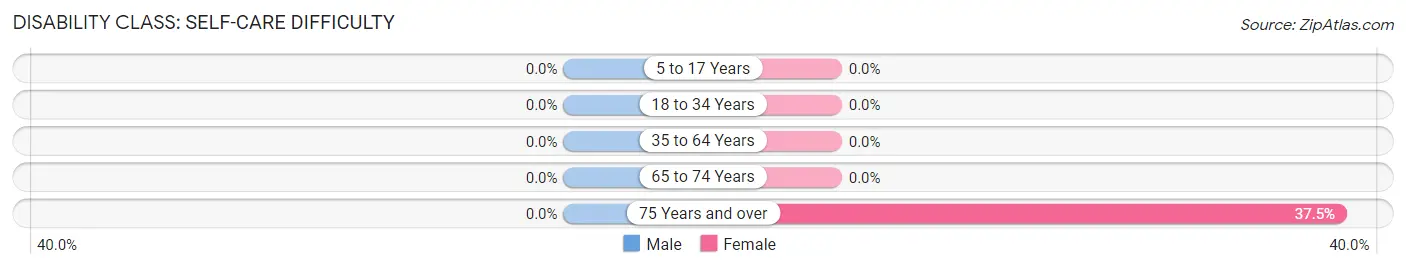
| Age Bracket | Male | Female |
| 5 to 17 Years | 0 (0.0%) | 0 (0.0%) |
| 18 to 34 Years | 0 (0.0%) | 0 (0.0%) |
| 35 to 64 Years | 0 (0.0%) | 0 (0.0%) |
| 65 to 74 Years | 0 (0.0%) | 0 (0.0%) |
| 75 Years and over | 0 (0.0%) | 6 (37.5%) |
Technology Access in Point Arena
Computing Device Access in Point Arena
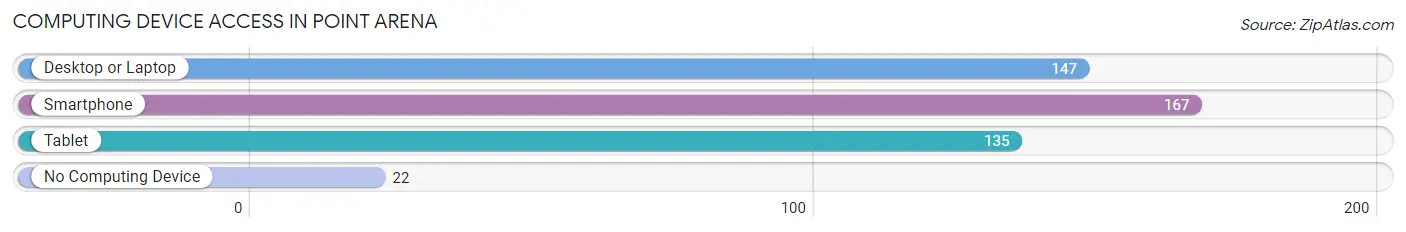
| Device Type | # Households | % Households |
| Desktop or Laptop | 147 | 67.1% |
| Smartphone | 167 | 76.3% |
| Tablet | 135 | 61.6% |
| No Computing Device | 22 | 10.1% |
| Total | 219 | 100.0% |
Internet Access in Point Arena
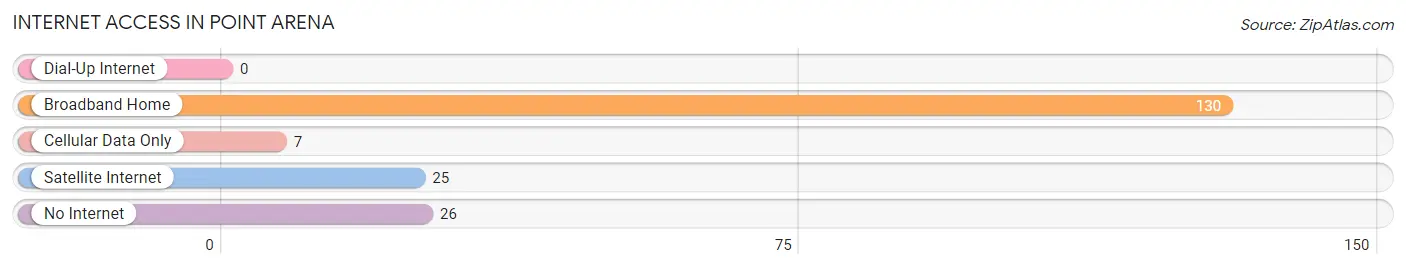
| Internet Type | # Households | % Households |
| Dial-Up Internet | 0 | 0.0% |
| Broadband Home | 130 | 59.4% |
| Cellular Data Only | 7 | 3.2% |
| Satellite Internet | 25 | 11.4% |
| No Internet | 26 | 11.9% |
| Total | 219 | 100.0% |
Point Arena Summary
Point Arena is a small coastal city located in Mendocino County, California. It is situated on the Pacific Coast, approximately 120 miles north of San Francisco. The city has a population of 454 people, according to the 2010 census.
History
Point Arena was originally inhabited by the Pomo people, who lived in the area for thousands of years. The first Europeans to arrive in the area were Spanish explorers in the late 1700s. The area was later settled by American settlers in the mid-1800s. The town was officially founded in 1854 and was named after the nearby Point Arena Lighthouse.
The town grew slowly over the years, and by the early 1900s, it had become a popular tourist destination. The town was also home to a thriving fishing industry, which provided employment for many of the town’s residents.
In the 1950s, the town began to decline as the fishing industry declined and tourism decreased. The town was further impacted by the closure of the Point Arena Lighthouse in 1977.
Geography
Point Arena is located on the Pacific Coast, approximately 120 miles north of San Francisco. The city is situated on a peninsula, surrounded by the Pacific Ocean to the west and the Garcia River to the east. The city is located at an elevation of approximately 200 feet above sea level.
The climate in Point Arena is mild and temperate, with average temperatures ranging from the mid-50s to the mid-70s throughout the year. The area receives an average of 40 inches of rain per year.
Economy
The economy of Point Arena is largely based on tourism and fishing. The town is home to a number of small businesses, including restaurants, shops, and galleries. The town is also home to a number of bed and breakfasts, which attract visitors from around the world.
The town is also home to a number of fishing boats, which provide employment for many of the town’s residents. The town is also home to a number of small farms, which produce a variety of fruits and vegetables.
Demographics
According to the 2010 census, the population of Point Arena was 454 people. The population is largely white (90.3%), with small percentages of Hispanic (3.3%), Asian (2.2%), and African American (1.3%) residents. The median household income in the town is $41,250, and the median age is 48.
Conclusion
Point Arena is a small coastal city located in Mendocino County, California. It is situated on the Pacific Coast, approximately 120 miles north of San Francisco. The city has a population of 454 people, according to the 2010 census. The economy of Point Arena is largely based on tourism and fishing, and the town is home to a number of small businesses, restaurants, shops, and galleries. The population is largely white, with small percentages of Hispanic, Asian, and African American residents.
Common Questions
What is Per Capita Income in Point Arena?
Per Capita income in Point Arena is $26,290.
What is the Median Family Income in Point Arena?
Median Family Income in Point Arena is $101,875.
What is the Median Household income in Point Arena?
Median Household Income in Point Arena is $51,719.
What is Inequality or Gini Index in Point Arena?
Inequality or Gini Index in Point Arena is 0.39.
What is the Total Population of Point Arena?
Total Population of Point Arena is 661.
What is the Total Male Population of Point Arena?
Total Male Population of Point Arena is 339.
What is the Total Female Population of Point Arena?
Total Female Population of Point Arena is 322.
What is the Ratio of Males per 100 Females in Point Arena?
There are 105.28 Males per 100 Females in Point Arena.
What is the Ratio of Females per 100 Males in Point Arena?
There are 94.99 Females per 100 Males in Point Arena.
What is the Median Population Age in Point Arena?
Median Population Age in Point Arena is 44.4 Years.
What is the Average Family Size in Point Arena
Average Family Size in Point Arena is 3.8 People.
What is the Average Household Size in Point Arena
Average Household Size in Point Arena is 3.0 People.
How Large is the Labor Force in Point Arena?
There are 342 People in the Labor Forcein in Point Arena.
What is the Percentage of People in the Labor Force in Point Arena?
70.1% of People are in the Labor Force in Point Arena.
What is the Unemployment Rate in Point Arena?
Unemployment Rate in Point Arena is 8.8%.