Cities with the Highest Percentage of Population Employed in Real Estate, Rental & Leasing in New Mexico
RELATED REPORTS & OPTIONS
Real Estate, Rental & Leasing
New Mexico
Compare Cities
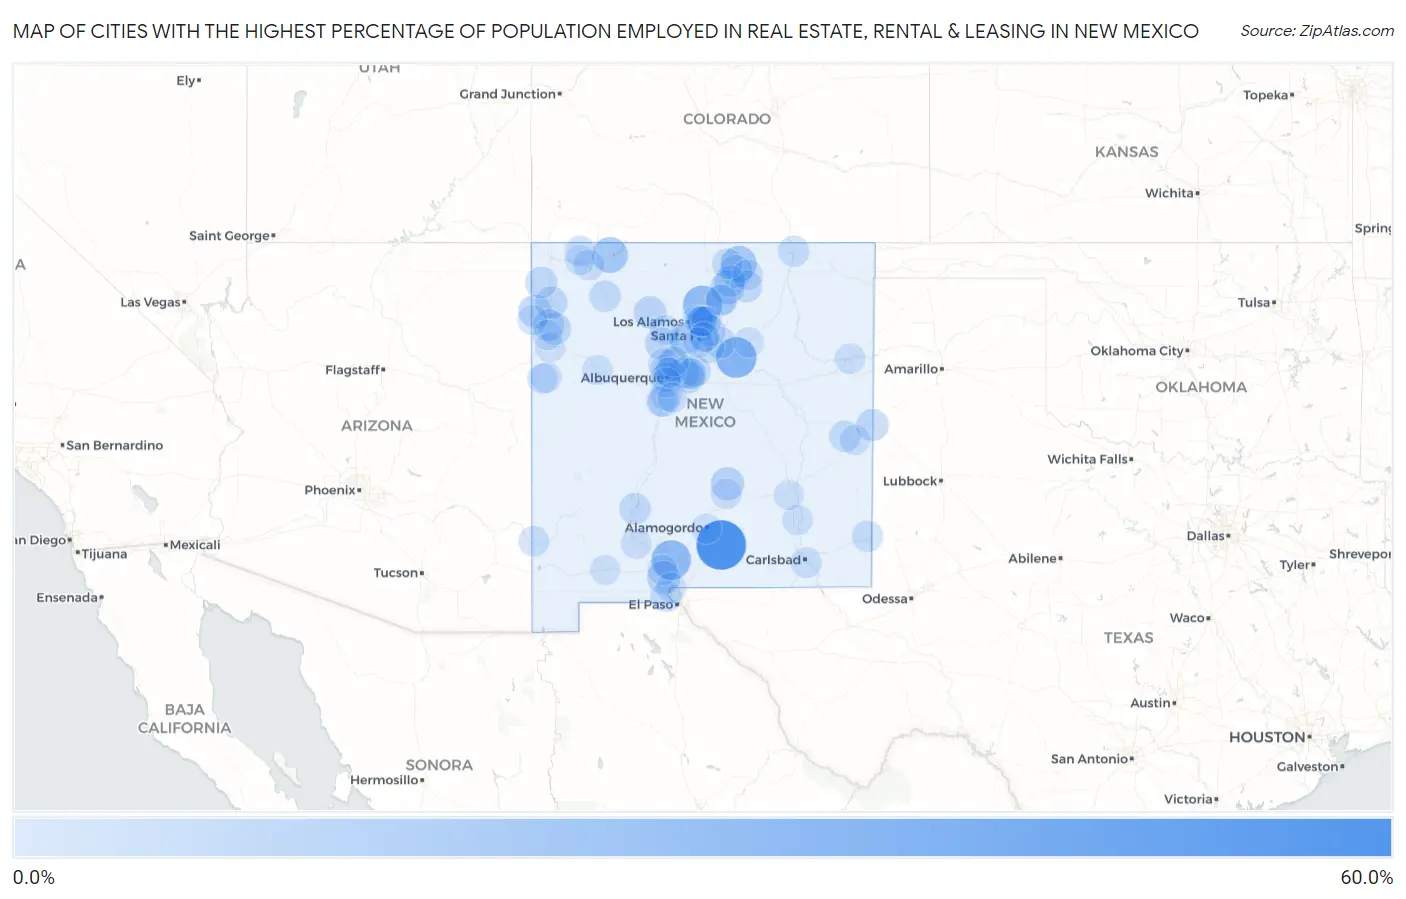
Map of Cities with the Highest Percentage of Population Employed in Real Estate, Rental & Leasing in New Mexico
0.0%
60.0%
Cities with the Highest Percentage of Population Employed in Real Estate, Rental & Leasing in New Mexico
| City | % Employed | vs State | vs National | |
| 1. | Timberon | 51.9% | 1.6%(+50.3)#1 | 1.9%(+50.0)#22 |
| 2. | Ribera | 27.8% | 1.6%(+26.2)#2 | 1.9%(+25.9)#80 |
| 3. | La Tierra | 26.5% | 1.6%(+24.9)#3 | 1.9%(+24.6)#92 |
| 4. | Organ | 25.0% | 1.6%(+23.4)#4 | 1.9%(+23.1)#105 |
| 5. | Los Luceros | 23.8% | 1.6%(+22.2)#5 | 1.9%(+21.9)#111 |
| 6. | Red River | 15.4% | 1.6%(+13.8)#6 | 1.9%(+13.5)#237 |
| 7. | Navajo Dam | 15.2% | 1.6%(+13.6)#7 | 1.9%(+13.3)#241 |
| 8. | Ranchos De Taos | 10.5% | 1.6%(+8.87)#8 | 1.9%(+8.57)#488 |
| 9. | Turley | 10.1% | 1.6%(+8.52)#9 | 1.9%(+8.21)#523 |
| 10. | Isleta | 8.8% | 1.6%(+7.26)#10 | 1.9%(+6.95)#670 |
| 11. | San Miguel | 8.8% | 1.6%(+7.22)#11 | 1.9%(+6.91)#677 |
| 12. | Capitan | 8.5% | 1.6%(+6.95)#12 | 1.9%(+6.64)#716 |
| 13. | Las Campanas | 8.5% | 1.6%(+6.90)#13 | 1.9%(+6.59)#726 |
| 14. | Crystal | 8.0% | 1.6%(+6.42)#14 | 1.9%(+6.11)#828 |
| 15. | Cuba | 7.4% | 1.6%(+5.82)#15 | 1.9%(+5.52)#949 |
| 16. | Sandia Knolls | 7.1% | 1.6%(+5.48)#16 | 1.9%(+5.18)#1,027 |
| 17. | Paa-Ko | 6.7% | 1.6%(+5.16)#17 | 1.9%(+4.85)#1,106 |
| 18. | Taos Ski Valley | 6.7% | 1.6%(+5.08)#18 | 1.9%(+4.77)#1,130 |
| 19. | San Ysidro | 6.6% | 1.6%(+5.01)#19 | 1.9%(+4.70)#1,155 |
| 20. | Picuris Pueblo | 6.5% | 1.6%(+4.87)#20 | 1.9%(+4.56)#1,204 |
| 21. | Texico | 6.4% | 1.6%(+4.85)#21 | 1.9%(+4.55)#1,206 |
| 22. | Picacho Hills | 6.3% | 1.6%(+4.75)#22 | 1.9%(+4.45)#1,239 |
| 23. | Brimhall Nizhoni | 6.2% | 1.6%(+4.60)#23 | 1.9%(+4.29)#1,302 |
| 24. | Sheep Springs | 5.9% | 1.6%(+4.36)#24 | 1.9%(+4.05)#1,403 |
| 25. | Tohatchi | 5.8% | 1.6%(+4.25)#25 | 1.9%(+3.94)#1,448 |
| 26. | Pueblo Of Sandia Village | 5.8% | 1.6%(+4.24)#26 | 1.9%(+3.93)#1,449 |
| 27. | Center Point | 5.6% | 1.6%(+3.98)#27 | 1.9%(+3.67)#1,561 |
| 28. | Sedillo | 5.4% | 1.6%(+3.78)#28 | 1.9%(+3.47)#1,660 |
| 29. | Cuyamungue | 5.2% | 1.6%(+3.65)#29 | 1.9%(+3.35)#1,724 |
| 30. | La Cueva | 5.2% | 1.6%(+3.61)#30 | 1.9%(+3.31)#1,745 |
| 31. | Angel Fire | 5.2% | 1.6%(+3.59)#31 | 1.9%(+3.28)#1,764 |
| 32. | Sanostee | 5.1% | 1.6%(+3.50)#32 | 1.9%(+3.19)#1,818 |
| 33. | Elephant Butte | 5.1% | 1.6%(+3.50)#33 | 1.9%(+3.19)#1,821 |
| 34. | Kirtland Afb | 4.9% | 1.6%(+3.28)#34 | 1.9%(+2.98)#1,946 |
| 35. | Floyd | 4.8% | 1.6%(+3.18)#35 | 1.9%(+2.87)#2,013 |
| 36. | Nageezi | 4.4% | 1.6%(+2.84)#36 | 1.9%(+2.53)#2,270 |
| 37. | Sandia Park | 4.3% | 1.6%(+2.74)#37 | 1.9%(+2.44)#2,347 |
| 38. | Cochiti Lake | 4.3% | 1.6%(+2.68)#38 | 1.9%(+2.38)#2,384 |
| 39. | Cedar Grove | 4.2% | 1.6%(+2.60)#39 | 1.9%(+2.29)#2,460 |
| 40. | Taos Pueblo | 4.1% | 1.6%(+2.52)#40 | 1.9%(+2.21)#2,548 |
| 41. | Eldorado At Santa Fe | 4.1% | 1.6%(+2.47)#41 | 1.9%(+2.16)#2,606 |
| 42. | North Hobbs | 4.0% | 1.6%(+2.37)#42 | 1.9%(+2.06)#2,715 |
| 43. | Santa Teresa | 3.9% | 1.6%(+2.36)#43 | 1.9%(+2.05)#2,722 |
| 44. | Tome | 3.9% | 1.6%(+2.35)#44 | 1.9%(+2.04)#2,737 |
| 45. | Cochiti | 3.9% | 1.6%(+2.30)#45 | 1.9%(+1.99)#2,796 |
| 46. | Peralta | 3.8% | 1.6%(+2.21)#46 | 1.9%(+1.90)#2,893 |
| 47. | Santa Fe Foothills | 3.7% | 1.6%(+2.12)#47 | 1.9%(+1.81)#3,010 |
| 48. | Tesuque | 3.7% | 1.6%(+2.10)#48 | 1.9%(+1.79)#3,044 |
| 49. | Raton | 3.6% | 1.6%(+2.05)#49 | 1.9%(+1.74)#3,113 |
| 50. | Thunder Mountain | 3.4% | 1.6%(+1.79)#50 | 1.9%(+1.49)#3,458 |
| 51. | Rio Rancho | 3.2% | 1.6%(+1.59)#51 | 1.9%(+1.29)#3,803 |
| 52. | Questa | 2.9% | 1.6%(+1.34)#52 | 1.9%(+1.03)#4,273 |
| 53. | Placitas Cdp Sandoval County | 2.9% | 1.6%(+1.30)#53 | 1.9%(+0.996)#4,345 |
| 54. | Eagle Nest | 2.8% | 1.6%(+1.23)#54 | 1.9%(+0.925)#4,512 |
| 55. | La Plata | 2.8% | 1.6%(+1.23)#55 | 1.9%(+0.923)#4,519 |
| 56. | Tano Road | 2.8% | 1.6%(+1.21)#56 | 1.9%(+0.904)#4,558 |
| 57. | Carlsbad | 2.6% | 1.6%(+1.02)#57 | 1.9%(+0.713)#5,051 |
| 58. | San Antonito Cdp Bernalillo County | 2.6% | 1.6%(+1.01)#58 | 1.9%(+0.706)#5,068 |
| 59. | West Hammond | 2.6% | 1.6%(+0.997)#59 | 1.9%(+0.690)#5,114 |
| 60. | Edgewood | 2.5% | 1.6%(+0.913)#60 | 1.9%(+0.605)#5,349 |
| 61. | Virden | 2.5% | 1.6%(+0.885)#61 | 1.9%(+0.577)#5,427 |
| 62. | Dona Ana | 2.4% | 1.6%(+0.841)#62 | 1.9%(+0.534)#5,559 |
| 63. | Black Rock | 2.4% | 1.6%(+0.818)#63 | 1.9%(+0.510)#5,636 |
| 64. | Ruidoso | 2.3% | 1.6%(+0.740)#64 | 1.9%(+0.433)#5,895 |
| 65. | Los Chaves | 2.2% | 1.6%(+0.645)#65 | 1.9%(+0.337)#6,215 |
| 66. | Santa Fe | 2.2% | 1.6%(+0.622)#66 | 1.9%(+0.315)#6,288 |
| 67. | Logan | 2.1% | 1.6%(+0.529)#67 | 1.9%(+0.221)#6,631 |
| 68. | University Park | 2.1% | 1.6%(+0.495)#68 | 1.9%(+0.188)#6,742 |
| 69. | Portales | 2.0% | 1.6%(+0.443)#69 | 1.9%(+0.135)#6,939 |
| 70. | Hatch | 1.9% | 1.6%(+0.342)#70 | 1.9%(+0.034)#7,346 |
| 71. | San Ildefonso Pueblo | 1.9% | 1.6%(+0.334)#71 | 1.9%(+0.026)#7,383 |
| 72. | Jaconita | 1.9% | 1.6%(+0.312)#72 | 1.9%(+0.004)#7,460 |
| 73. | Paradise Hills | 1.9% | 1.6%(+0.308)#73 | 1.9%(+0.001)#7,471 |
| 74. | El Rancho | 1.9% | 1.6%(+0.308)#74 | 1.9%(+0.001)#7,473 |
| 75. | Nambe | 1.9% | 1.6%(+0.298)#75 | 1.9%(-0.010)#7,520 |
| 76. | Lake Arthur | 1.8% | 1.6%(+0.234)#76 | 1.9%(-0.074)#7,772 |
| 77. | Zuni Pueblo | 1.8% | 1.6%(+0.228)#77 | 1.9%(-0.079)#7,799 |
| 78. | Los Ranchos De Albuquerque | 1.8% | 1.6%(+0.193)#78 | 1.9%(-0.115)#7,930 |
| 79. | Jacona | 1.8% | 1.6%(+0.170)#79 | 1.9%(-0.137)#8,030 |
| 80. | Navajo | 1.7% | 1.6%(+0.140)#80 | 1.9%(-0.168)#8,161 |
| 81. | Albuquerque | 1.7% | 1.6%(+0.128)#81 | 1.9%(-0.180)#8,217 |
| 82. | Milan | 1.7% | 1.6%(+0.073)#82 | 1.9%(-0.234)#8,496 |
| 83. | Barton | 1.6% | 1.6%(+0.055)#83 | 1.9%(-0.252)#8,578 |
| 84. | Anthony | 1.5% | 1.6%(-0.060)#84 | 1.9%(-0.368)#9,174 |
| 85. | Agua Fria | 1.5% | 1.6%(-0.119)#85 | 1.9%(-0.427)#9,483 |
| 86. | Alamogordo | 1.5% | 1.6%(-0.124)#86 | 1.9%(-0.432)#9,505 |
| 87. | Bernalillo | 1.4% | 1.6%(-0.135)#87 | 1.9%(-0.443)#9,574 |
| 88. | Gallup | 1.4% | 1.6%(-0.157)#88 | 1.9%(-0.465)#9,669 |
| 89. | Roswell | 1.4% | 1.6%(-0.161)#89 | 1.9%(-0.469)#9,692 |
| 90. | Rio Lucio | 1.4% | 1.6%(-0.169)#90 | 1.9%(-0.477)#9,736 |
| 91. | South Valley | 1.4% | 1.6%(-0.226)#91 | 1.9%(-0.534)#10,017 |
| 92. | North Valley | 1.4% | 1.6%(-0.231)#92 | 1.9%(-0.538)#10,040 |
| 93. | Twin Lakes | 1.3% | 1.6%(-0.251)#93 | 1.9%(-0.558)#10,142 |
| 94. | La Cienega | 1.3% | 1.6%(-0.279)#94 | 1.9%(-0.587)#10,290 |
| 95. | Las Vegas | 1.3% | 1.6%(-0.308)#95 | 1.9%(-0.616)#10,448 |
| 96. | Meadow Lake | 1.2% | 1.6%(-0.378)#96 | 1.9%(-0.685)#10,844 |
| 97. | Jemez Springs | 1.2% | 1.6%(-0.408)#97 | 1.9%(-0.715)#11,020 |
| 98. | Farmington | 1.2% | 1.6%(-0.427)#98 | 1.9%(-0.734)#11,124 |
| 99. | Crouch Mesa | 1.1% | 1.6%(-0.479)#99 | 1.9%(-0.786)#11,388 |
| 100. | Deming | 1.1% | 1.6%(-0.491)#100 | 1.9%(-0.798)#11,464 |
Common Questions
What are the Top 10 Cities with the Highest Percentage of Population Employed in Real Estate, Rental & Leasing in New Mexico?
Top 10 Cities with the Highest Percentage of Population Employed in Real Estate, Rental & Leasing in New Mexico are:
#1
51.9%
#2
27.8%
#3
25.0%
#4
23.8%
#5
15.4%
#6
15.2%
#7
10.5%
#8
8.8%
#9
8.5%
#10
8.0%
What city has the Highest Percentage of Population Employed in Real Estate, Rental & Leasing in New Mexico?
Timberon has the Highest Percentage of Population Employed in Real Estate, Rental & Leasing in New Mexico with 51.9%.
What is the Percentage of Population Employed in Real Estate, Rental & Leasing in the State of New Mexico?
Percentage of Population Employed in Real Estate, Rental & Leasing in New Mexico is 1.6%.
What is the Percentage of Population Employed in Real Estate, Rental & Leasing in the United States?
Percentage of Population Employed in Real Estate, Rental & Leasing in the United States is 1.9%.