Lake San Marcos, CA Map & Demographics
Lake San Marcos Map
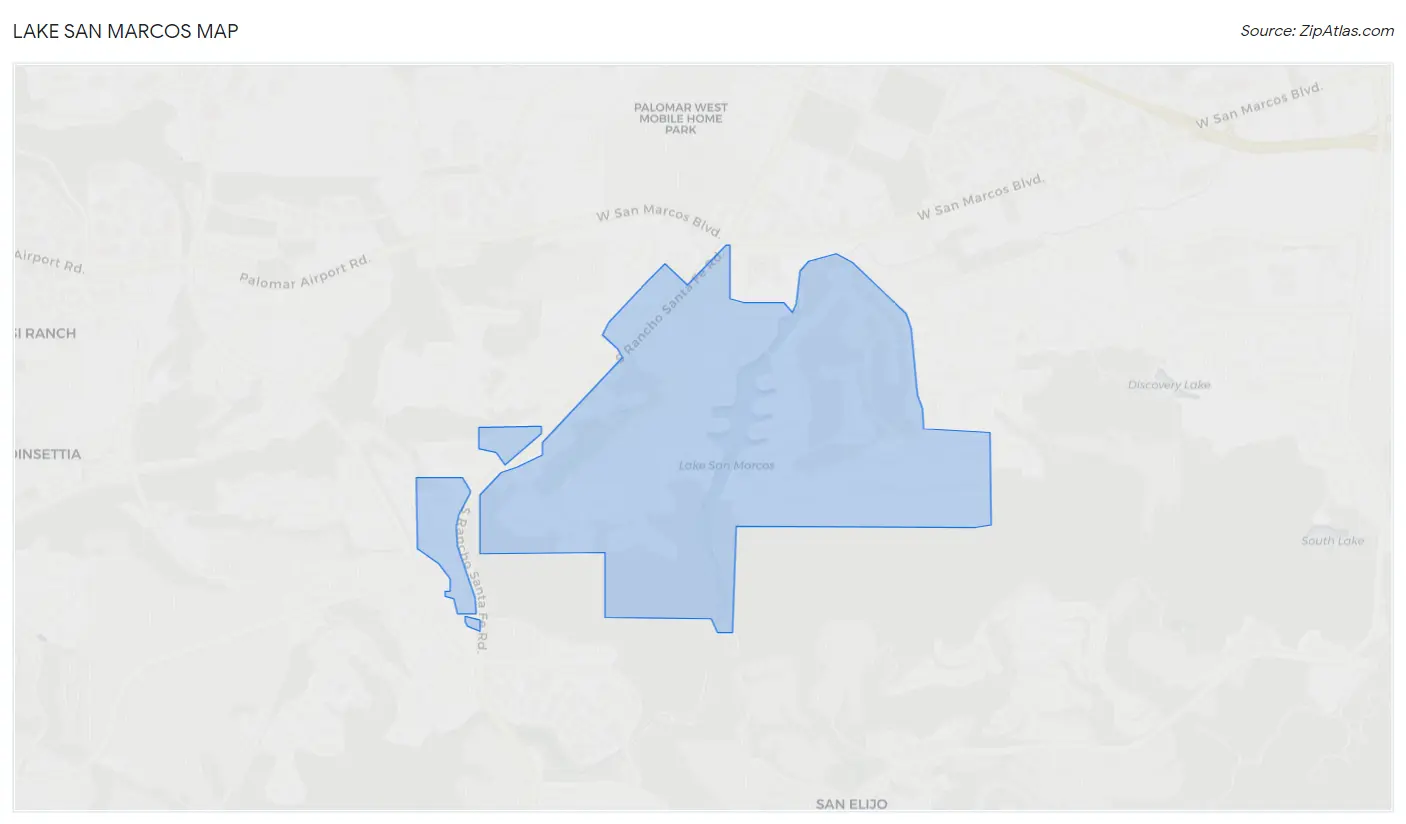
Lake San Marcos Overview
$64,055
PER CAPITA INCOME
$102,297
AVG FAMILY INCOME
$94,811
AVG HOUSEHOLD INCOME
43.9%
WAGE / INCOME GAP [ % ]
56.1¢/ $1
WAGE / INCOME GAP [ $ ]
0.40
INEQUALITY / GINI INDEX
4,080
TOTAL POPULATION
1,930
MALE POPULATION
2,150
FEMALE POPULATION
89.77
MALES / 100 FEMALES
111.40
FEMALES / 100 MALES
64.5
MEDIAN AGE
2.4
AVG FAMILY SIZE
1.9
AVG HOUSEHOLD SIZE
1,800
LABOR FORCE [ PEOPLE ]
47.7%
PERCENT IN LABOR FORCE
4.5%
UNEMPLOYMENT RATE
Income in Lake San Marcos
Income Overview in Lake San Marcos
Per Capita Income in Lake San Marcos is $64,055, while median incomes of families and households are $102,297 and $94,811 respectively.
| Characteristic | Number | Measure |
| Per Capita Income | 4,080 | $64,055 |
| Median Family Income | 1,164 | $102,297 |
| Mean Family Income | 1,164 | $137,816 |
| Median Household Income | 2,136 | $94,811 |
| Mean Household Income | 2,136 | $119,917 |
| Income Deficit | 1,164 | $0 |
| Wage / Income Gap (%) | 4,080 | 43.88% |
| Wage / Income Gap ($) | 4,080 | 56.12¢ per $1 |
| Gini / Inequality Index | 4,080 | 0.40 |
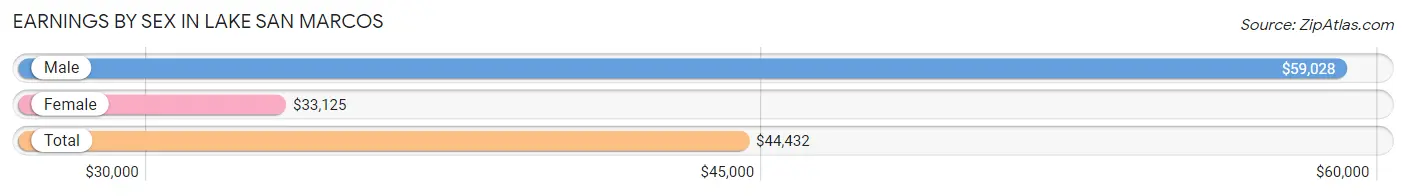
Earnings by Sex in Lake San Marcos
Average Earnings in Lake San Marcos are $44,432, $59,028 for men and $33,125 for women, a difference of 43.9%.
| Sex | Number | Average Earnings |
| Male | 949 (51.0%) | $59,028 |
| Female | 911 (49.0%) | $33,125 |
| Total | 1,860 (100.0%) | $44,432 |
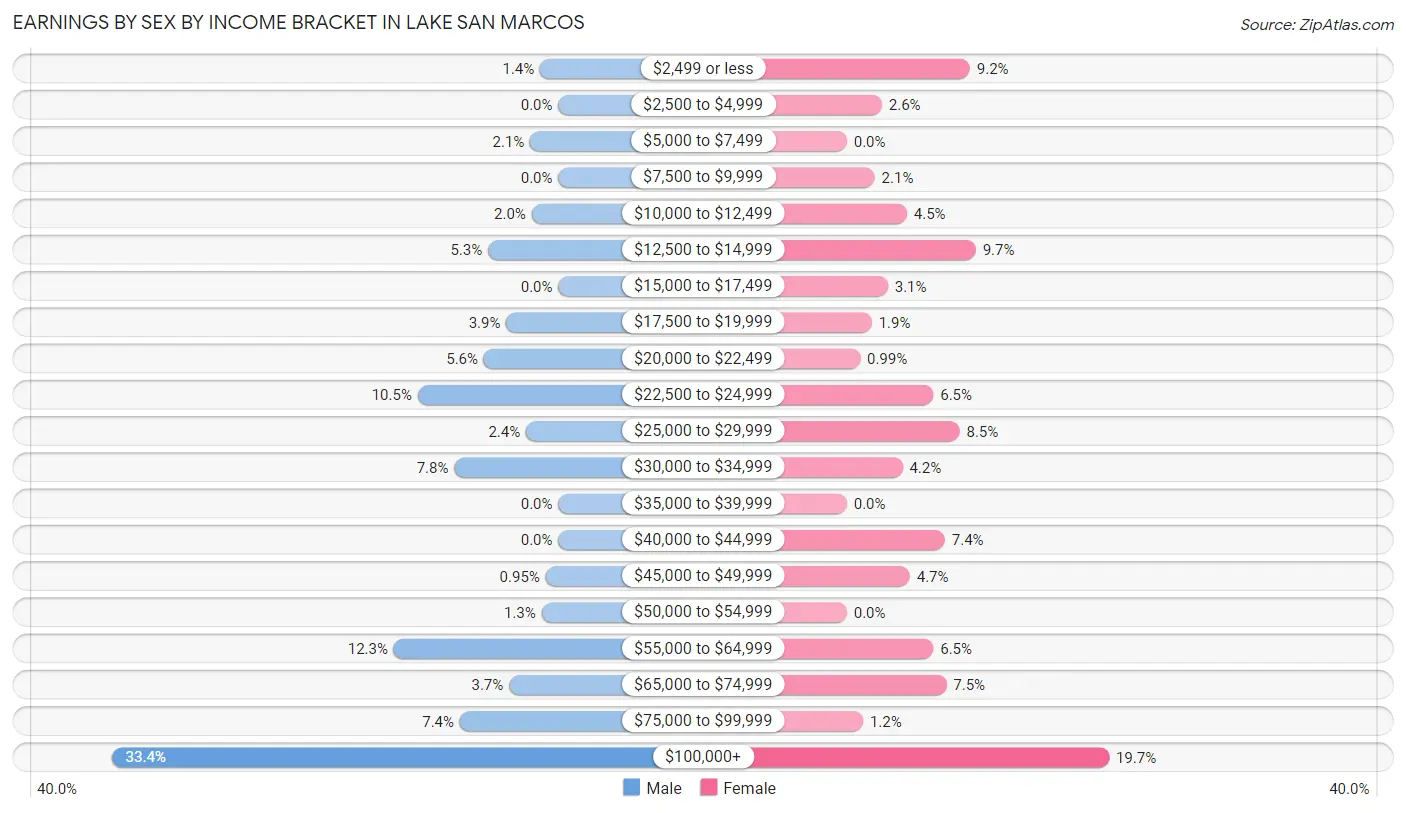
Earnings by Sex by Income Bracket in Lake San Marcos
The most common earnings brackets in Lake San Marcos are $100,000+ for men (317 | 33.4%) and $100,000+ for women (179 | 19.7%).
| Income | Male | Female |
| $2,499 or less | 13 (1.4%) | 84 (9.2%) |
| $2,500 to $4,999 | 0 (0.0%) | 24 (2.6%) |
| $5,000 to $7,499 | 20 (2.1%) | 0 (0.0%) |
| $7,500 to $9,999 | 0 (0.0%) | 19 (2.1%) |
| $10,000 to $12,499 | 19 (2.0%) | 41 (4.5%) |
| $12,500 to $14,999 | 50 (5.3%) | 88 (9.7%) |
| $15,000 to $17,499 | 0 (0.0%) | 28 (3.1%) |
| $17,500 to $19,999 | 37 (3.9%) | 17 (1.9%) |
| $20,000 to $22,499 | 53 (5.6%) | 9 (1.0%) |
| $22,500 to $24,999 | 100 (10.5%) | 59 (6.5%) |
| $25,000 to $29,999 | 23 (2.4%) | 77 (8.5%) |
| $30,000 to $34,999 | 74 (7.8%) | 38 (4.2%) |
| $35,000 to $39,999 | 0 (0.0%) | 0 (0.0%) |
| $40,000 to $44,999 | 0 (0.0%) | 67 (7.3%) |
| $45,000 to $49,999 | 9 (0.9%) | 43 (4.7%) |
| $50,000 to $54,999 | 12 (1.3%) | 0 (0.0%) |
| $55,000 to $64,999 | 117 (12.3%) | 59 (6.5%) |
| $65,000 to $74,999 | 35 (3.7%) | 68 (7.5%) |
| $75,000 to $99,999 | 70 (7.4%) | 11 (1.2%) |
| $100,000+ | 317 (33.4%) | 179 (19.7%) |
| Total | 949 (100.0%) | 911 (100.0%) |
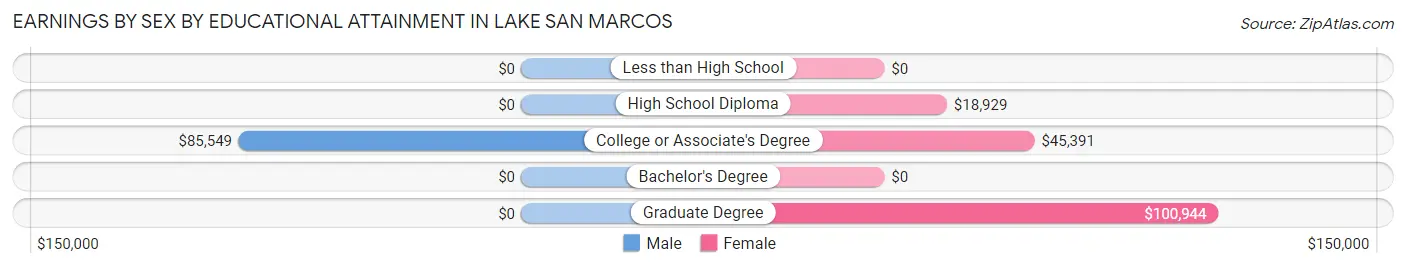
Earnings by Sex by Educational Attainment in Lake San Marcos
Average earnings in Lake San Marcos are $64,196 for men and $33,618 for women, a difference of 47.6%. Men with an educational attainment of college or associate's degree enjoy the highest average annual earnings of $85,549, while those with college or associate's degree education earn the least with $85,549. Women with an educational attainment of graduate degree earn the most with the average annual earnings of $100,944, while those with high school diploma education have the smallest earnings of $18,929.
| Educational Attainment | Male Income | Female Income |
| Less than High School | - | - |
| High School Diploma | - | - |
| College or Associate's Degree | $85,549 | $45,391 |
| Bachelor's Degree | - | - |
| Graduate Degree | - | - |
| Total | $64,196 | $33,618 |
Family Income in Lake San Marcos
Family Income Brackets in Lake San Marcos
According to the Lake San Marcos family income data, there are 320 families falling into the $100,000 to $149,999 income range, which is the most common income bracket and makes up 27.5% of all families.
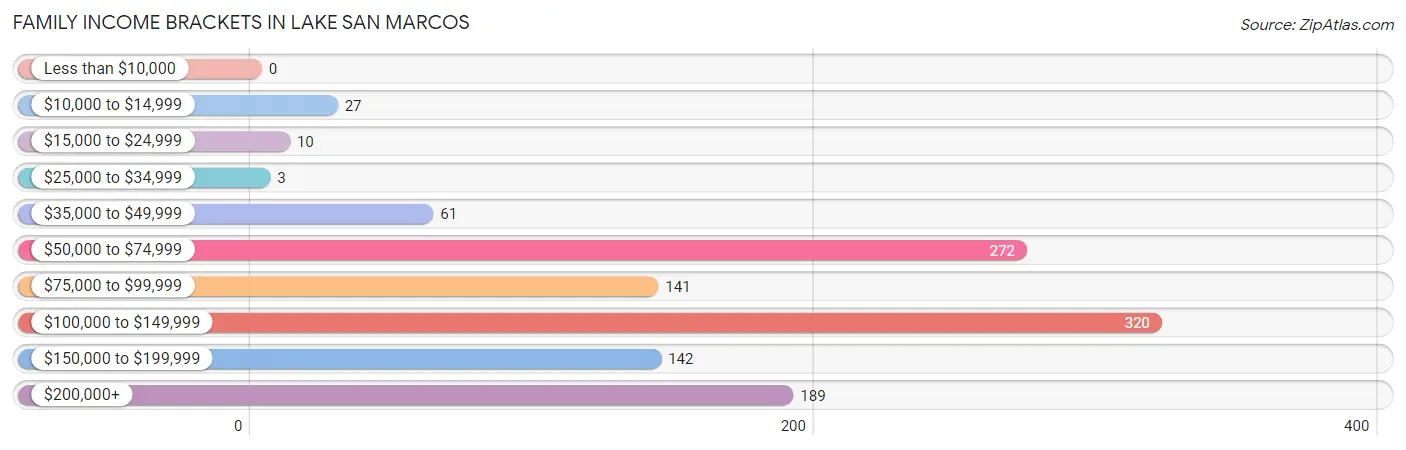
| Income Bracket | # Families | % Families |
| Less than $10,000 | 0 | 0.0% |
| $10,000 to $14,999 | 27 | 2.3% |
| $15,000 to $24,999 | 10 | 0.9% |
| $25,000 to $34,999 | 3 | 0.3% |
| $35,000 to $49,999 | 61 | 5.2% |
| $50,000 to $74,999 | 272 | 23.4% |
| $75,000 to $99,999 | 141 | 12.1% |
| $100,000 to $149,999 | 320 | 27.5% |
| $150,000 to $199,999 | 142 | 12.2% |
| $200,000+ | 189 | 16.2% |
Family Income by Famaliy Size in Lake San Marcos
4-person families (98 | 8.4%) account for the highest median family income in Lake San Marcos with $250,001 per family, while 4-person families (98 | 8.4%) have the highest median income of $62,500 per family member.
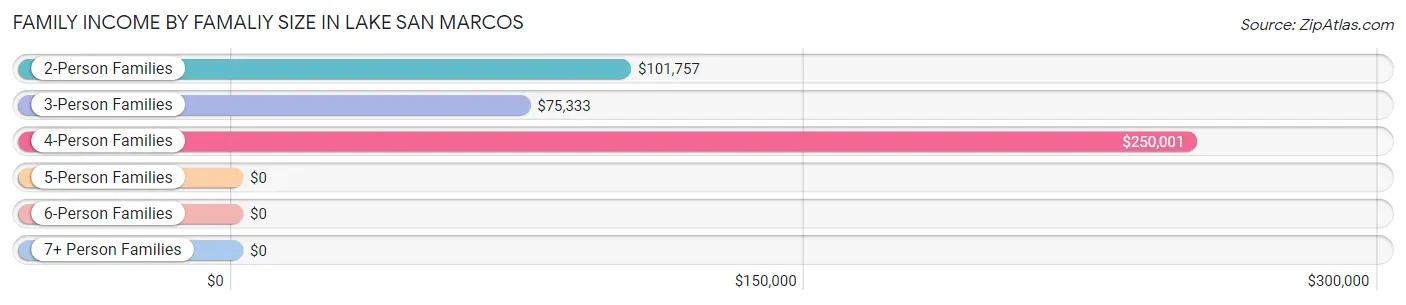
| Income Bracket | # Families | Median Income |
| 2-Person Families | 890 (76.5%) | $101,757 |
| 3-Person Families | 166 (14.3%) | $75,333 |
| 4-Person Families | 98 (8.4%) | $250,001 |
| 5-Person Families | 10 (0.9%) | $0 |
| 6-Person Families | 0 (0.0%) | $0 |
| 7+ Person Families | 0 (0.0%) | $0 |
| Total | 1,164 (100.0%) | $102,297 |
Family Income by Number of Earners in Lake San Marcos
The median family income in Lake San Marcos is $102,297, with families comprising 3+ earners (36) having the highest median family income of $186,250, while families with no earners (342) have the lowest median family income of $74,833, accounting for 3.1% and 29.4% of families, respectively.
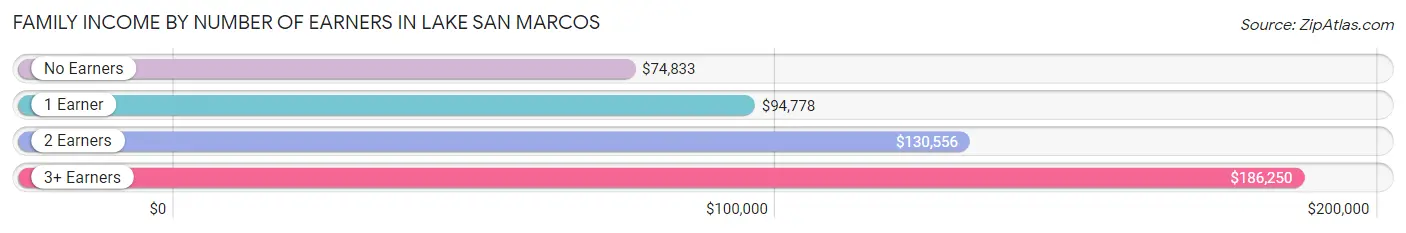
| Number of Earners | # Families | Median Income |
| No Earners | 342 (29.4%) | $74,833 |
| 1 Earner | 430 (36.9%) | $94,778 |
| 2 Earners | 356 (30.6%) | $130,556 |
| 3+ Earners | 36 (3.1%) | $186,250 |
| Total | 1,164 (100.0%) | $102,297 |
Household Income in Lake San Marcos
Household Income Brackets in Lake San Marcos
With 442 households falling in the category, the $50,000 to $74,999 income range is the most frequent in Lake San Marcos, accounting for 20.7% of all households. In contrast, only 9 households (0.4%) fall into the $10,000 to $14,999 income bracket, making it the least populous group.
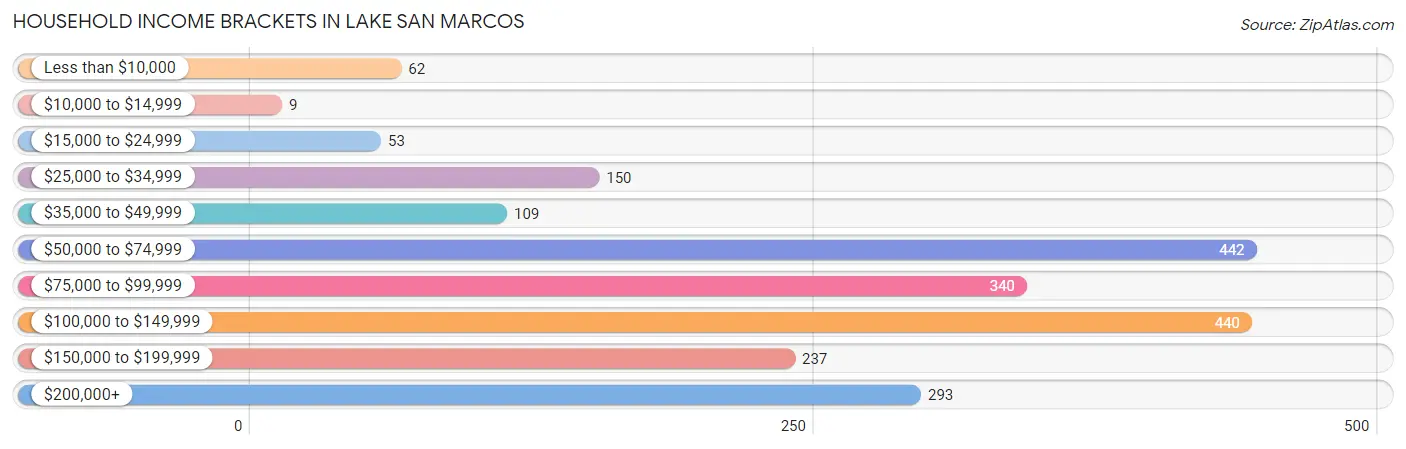
| Income Bracket | # Households | % Households |
| Less than $10,000 | 62 | 2.9% |
| $10,000 to $14,999 | 9 | 0.4% |
| $15,000 to $24,999 | 53 | 2.5% |
| $25,000 to $34,999 | 150 | 7.0% |
| $35,000 to $49,999 | 109 | 5.1% |
| $50,000 to $74,999 | 442 | 20.7% |
| $75,000 to $99,999 | 340 | 15.9% |
| $100,000 to $149,999 | 440 | 20.6% |
| $150,000 to $199,999 | 237 | 11.1% |
| $200,000+ | 293 | 13.7% |
Household Income by Householder Age in Lake San Marcos
The median household income in Lake San Marcos is $94,811, with the highest median household income of $186,991 found in the 25 to 44 years age bracket for the primary householder. A total of 239 households (11.2%) fall into this category. Meanwhile, the 15 to 24 years age bracket for the primary householder has the lowest median household income of $0, with 19 households (0.9%) in this group.
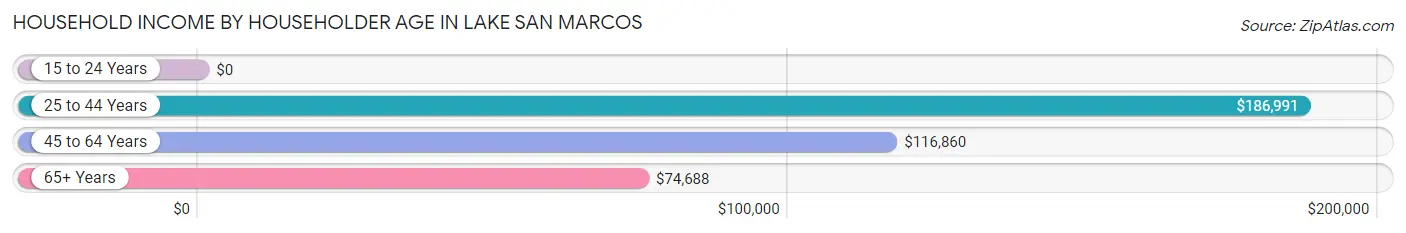
| Income Bracket | # Households | Median Income |
| 15 to 24 Years | 19 (0.9%) | $0 |
| 25 to 44 Years | 239 (11.2%) | $186,991 |
| 45 to 64 Years | 563 (26.4%) | $116,860 |
| 65+ Years | 1,315 (61.6%) | $74,688 |
| Total | 2,136 (100.0%) | $94,811 |
Poverty in Lake San Marcos
Income Below Poverty by Sex and Age in Lake San Marcos
With 5.1% poverty level for males and 5.2% for females among the residents of Lake San Marcos, 12 to 14 year old males and 45 to 54 year old females are the most vulnerable to poverty, with 36 males (38.3%) and 27 females (12.2%) in their respective age groups living below the poverty level.
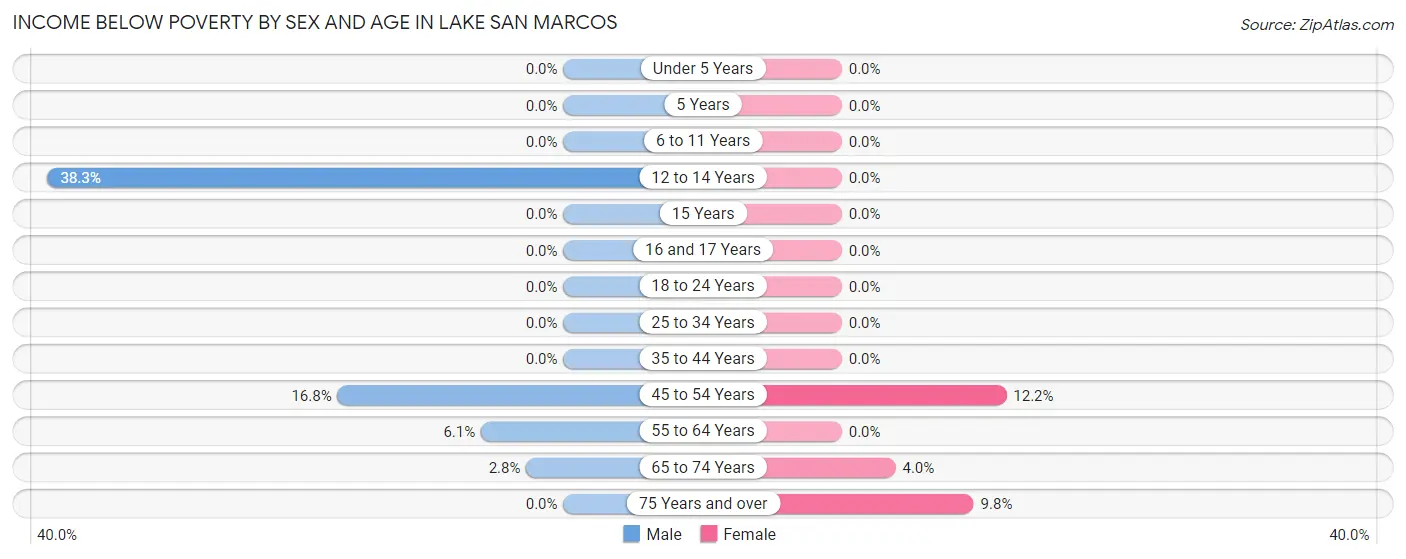
| Age Bracket | Male | Female |
| Under 5 Years | 0 (0.0%) | 0 (0.0%) |
| 5 Years | 0 (0.0%) | 0 (0.0%) |
| 6 to 11 Years | 0 (0.0%) | 0 (0.0%) |
| 12 to 14 Years | 36 (38.3%) | 0 (0.0%) |
| 15 Years | 0 (0.0%) | 0 (0.0%) |
| 16 and 17 Years | 0 (0.0%) | 0 (0.0%) |
| 18 to 24 Years | 0 (0.0%) | 0 (0.0%) |
| 25 to 34 Years | 0 (0.0%) | 0 (0.0%) |
| 35 to 44 Years | 0 (0.0%) | 0 (0.0%) |
| 45 to 54 Years | 28 (16.8%) | 27 (12.2%) |
| 55 to 64 Years | 22 (6.1%) | 0 (0.0%) |
| 65 to 74 Years | 11 (2.8%) | 24 (4.0%) |
| 75 Years and over | 0 (0.0%) | 60 (9.8%) |
| Total | 97 (5.1%) | 111 (5.2%) |
Income Above Poverty by Sex and Age in Lake San Marcos
According to the poverty statistics in Lake San Marcos, males aged under 5 years and females aged under 5 years are the age groups that are most secure financially, with 100.0% of males and 100.0% of females in these age groups living above the poverty line.
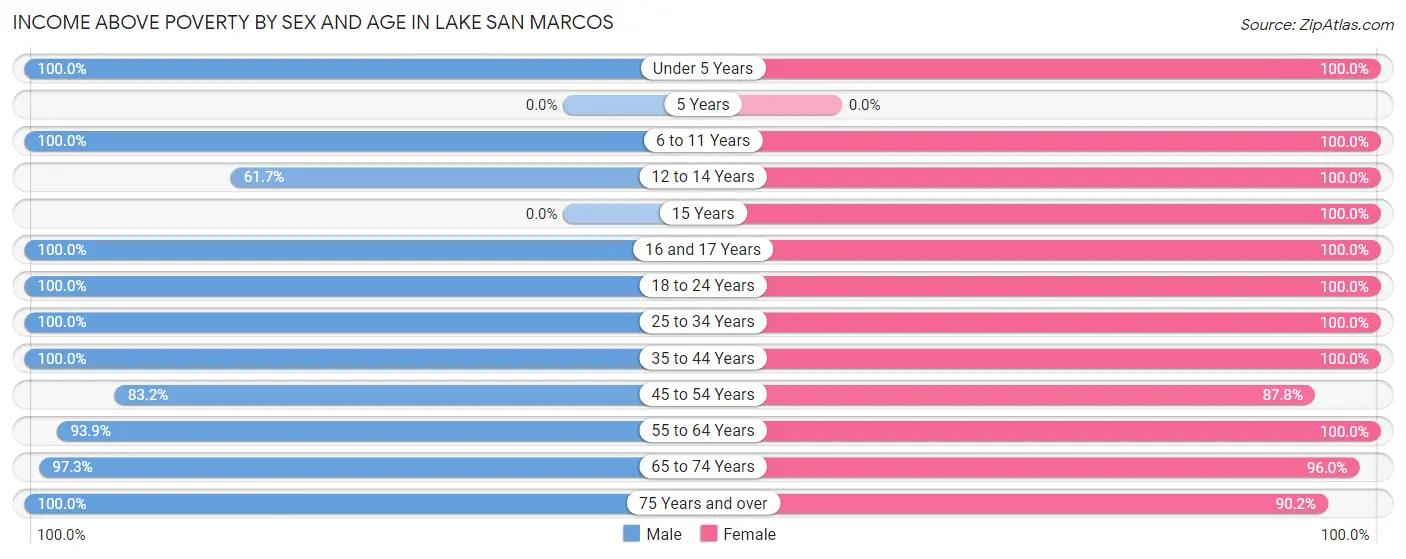
| Age Bracket | Male | Female |
| Under 5 Years | 45 (100.0%) | 49 (100.0%) |
| 5 Years | 0 (0.0%) | 0 (0.0%) |
| 6 to 11 Years | 50 (100.0%) | 13 (100.0%) |
| 12 to 14 Years | 58 (61.7%) | 28 (100.0%) |
| 15 Years | 0 (0.0%) | 28 (100.0%) |
| 16 and 17 Years | 56 (100.0%) | 13 (100.0%) |
| 18 to 24 Years | 74 (100.0%) | 21 (100.0%) |
| 25 to 34 Years | 110 (100.0%) | 139 (100.0%) |
| 35 to 44 Years | 170 (100.0%) | 141 (100.0%) |
| 45 to 54 Years | 139 (83.2%) | 194 (87.8%) |
| 55 to 64 Years | 338 (93.9%) | 273 (100.0%) |
| 65 to 74 Years | 389 (97.3%) | 577 (96.0%) |
| 75 Years and over | 363 (100.0%) | 553 (90.2%) |
| Total | 1,792 (94.9%) | 2,029 (94.8%) |
Income Below Poverty Among Married-Couple Families in Lake San Marcos
The poverty statistics for married-couple families in Lake San Marcos show that 2.9% or 27 of the total 914 families live below the poverty line. Families with 1 or 2 children have the highest poverty rate of 19.3%, comprising of 27 families. On the other hand, families with no children have the lowest poverty rate of 0.0%, which includes 0 families.
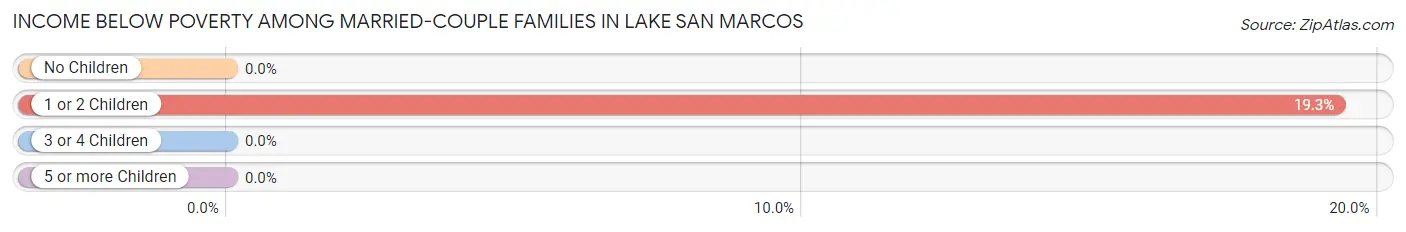
| Children | Above Poverty | Below Poverty |
| No Children | 774 (100.0%) | 0 (0.0%) |
| 1 or 2 Children | 113 (80.7%) | 27 (19.3%) |
| 3 or 4 Children | 0 (0.0%) | 0 (0.0%) |
| 5 or more Children | 0 (0.0%) | 0 (0.0%) |
| Total | 887 (97.1%) | 27 (2.9%) |
Income Below Poverty Among Single-Parent Households in Lake San Marcos
| Children | Single Father | Single Mother |
| No Children | 0 (0.0%) | 0 (0.0%) |
| 1 or 2 Children | 0 (0.0%) | 0 (0.0%) |
| 3 or 4 Children | 0 (0.0%) | 0 (0.0%) |
| 5 or more Children | 0 (0.0%) | 0 (0.0%) |
| Total | 0 (0.0%) | 0 (0.0%) |
Income Below Poverty Among Married-Couple vs Single-Parent Households in Lake San Marcos
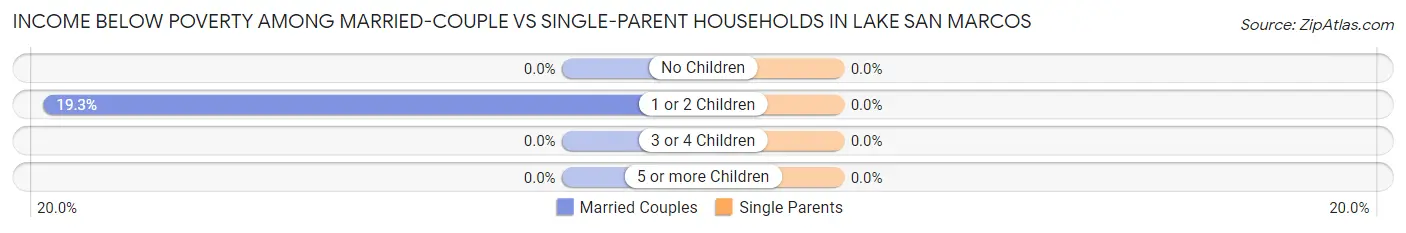
| Children | Married-Couple Families | Single-Parent Households |
| No Children | 0 (0.0%) | 0 (0.0%) |
| 1 or 2 Children | 27 (19.3%) | 0 (0.0%) |
| 3 or 4 Children | 0 (0.0%) | 0 (0.0%) |
| 5 or more Children | 0 (0.0%) | 0 (0.0%) |
| Total | 27 (2.9%) | 0 (0.0%) |
Race in Lake San Marcos
The most populous races in Lake San Marcos are White / Caucasian (3,581 | 87.8%), Hispanic or Latino (279 | 6.8%), and Two or more Races (178 | 4.4%).
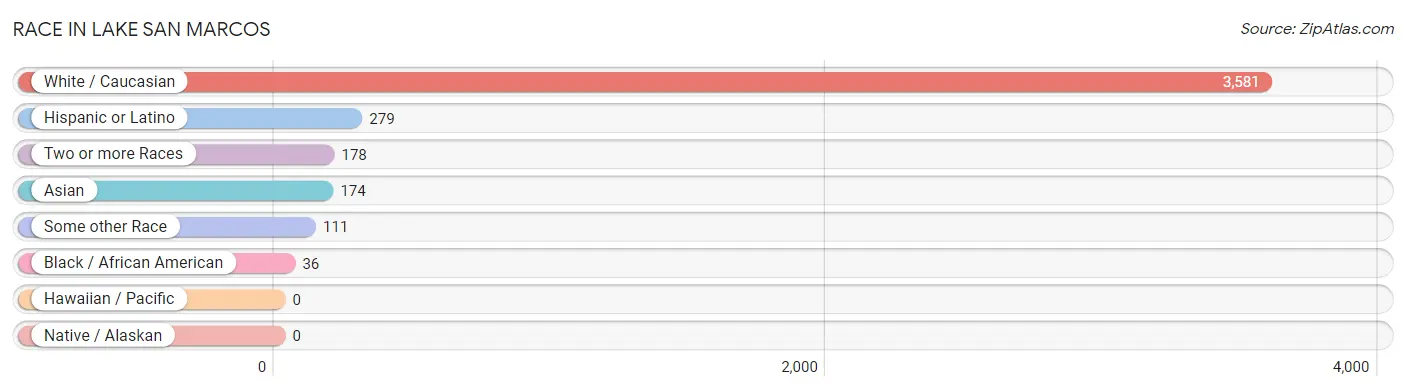
| Race | # Population | % Population |
| Asian | 174 | 4.3% |
| Black / African American | 36 | 0.9% |
| Hawaiian / Pacific | 0 | 0.0% |
| Hispanic or Latino | 279 | 6.8% |
| Native / Alaskan | 0 | 0.0% |
| White / Caucasian | 3,581 | 87.8% |
| Two or more Races | 178 | 4.4% |
| Some other Race | 111 | 2.7% |
| Total | 4,080 | 100.0% |
Ancestry in Lake San Marcos
The most populous ancestries reported in Lake San Marcos are English (642 | 15.7%), German (551 | 13.5%), Irish (546 | 13.4%), American (235 | 5.8%), and French (225 | 5.5%), together accounting for 53.9% of all Lake San Marcos residents.
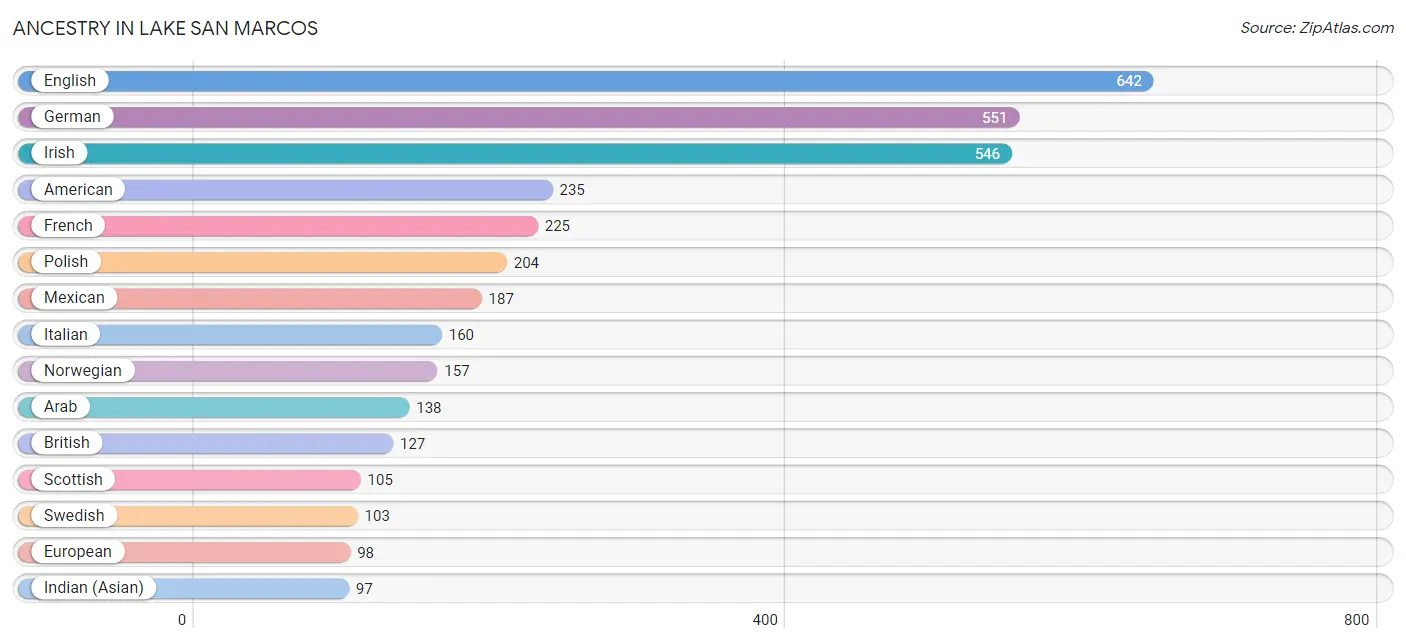
| Ancestry | # Population | % Population |
| American | 235 | 5.8% |
| Arab | 138 | 3.4% |
| Armenian | 71 | 1.7% |
| Austrian | 9 | 0.2% |
| British | 127 | 3.1% |
| Burmese | 7 | 0.2% |
| Canadian | 18 | 0.4% |
| Central American | 30 | 0.7% |
| Danish | 35 | 0.9% |
| Dutch | 85 | 2.1% |
| Eastern European | 16 | 0.4% |
| English | 642 | 15.7% |
| European | 98 | 2.4% |
| Finnish | 90 | 2.2% |
| French | 225 | 5.5% |
| French Canadian | 46 | 1.1% |
| German | 551 | 13.5% |
| Greek | 24 | 0.6% |
| Hungarian | 19 | 0.5% |
| Indian (Asian) | 97 | 2.4% |
| Iranian | 11 | 0.3% |
| Iraqi | 15 | 0.4% |
| Irish | 546 | 13.4% |
| Italian | 160 | 3.9% |
| Korean | 49 | 1.2% |
| Lebanese | 69 | 1.7% |
| Lithuanian | 26 | 0.6% |
| Mexican | 187 | 4.6% |
| Nicaraguan | 30 | 0.7% |
| Norwegian | 157 | 3.8% |
| Peruvian | 22 | 0.5% |
| Polish | 204 | 5.0% |
| Romanian | 8 | 0.2% |
| Scotch-Irish | 71 | 1.7% |
| Scottish | 105 | 2.6% |
| South African | 11 | 0.3% |
| South American | 22 | 0.5% |
| Spaniard | 10 | 0.3% |
| Spanish | 30 | 0.7% |
| Sri Lankan | 16 | 0.4% |
| Subsaharan African | 11 | 0.3% |
| Swedish | 103 | 2.5% |
| Swiss | 93 | 2.3% |
| Syrian | 44 | 1.1% |
| Thai | 16 | 0.4% |
| Ukrainian | 41 | 1.0% |
| Welsh | 40 | 1.0% |
| Yugoslavian | 77 | 1.9% | View All 48 Rows |
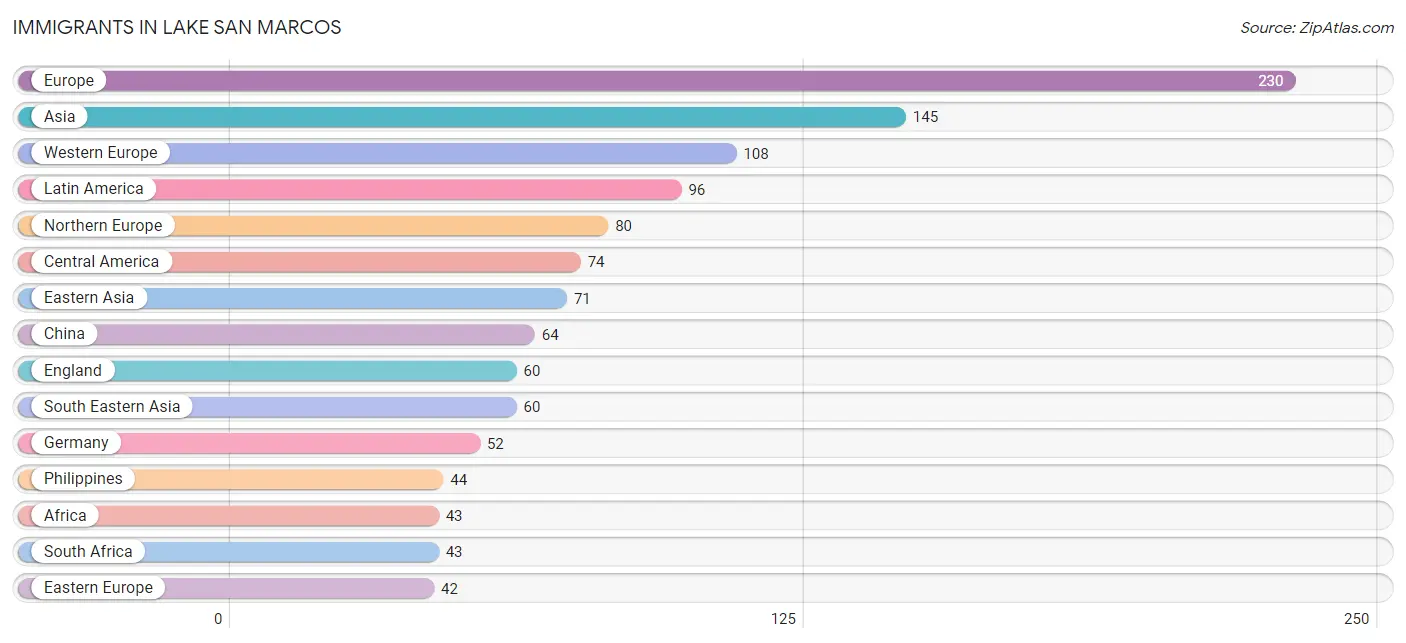
Immigrants in Lake San Marcos
The most numerous immigrant groups reported in Lake San Marcos came from Europe (230 | 5.6%), Asia (145 | 3.5%), Western Europe (108 | 2.6%), Latin America (96 | 2.4%), and Northern Europe (80 | 2.0%), together accounting for 16.2% of all Lake San Marcos residents.
| Immigration Origin | # Population | % Population |
| Africa | 43 | 1.1% |
| Asia | 145 | 3.5% |
| Canada | 34 | 0.8% |
| Central America | 74 | 1.8% |
| China | 64 | 1.6% |
| Eastern Asia | 71 | 1.7% |
| Eastern Europe | 42 | 1.0% |
| England | 60 | 1.5% |
| Europe | 230 | 5.6% |
| France | 37 | 0.9% |
| Germany | 52 | 1.3% |
| Hong Kong | 34 | 0.8% |
| India | 6 | 0.2% |
| Iran | 5 | 0.1% |
| Iraq | 3 | 0.1% |
| Korea | 7 | 0.2% |
| Latin America | 96 | 2.4% |
| Mexico | 18 | 0.4% |
| Nicaragua | 30 | 0.7% |
| Northern Europe | 80 | 2.0% |
| Panama | 26 | 0.6% |
| Peru | 22 | 0.5% |
| Philippines | 44 | 1.1% |
| Romania | 8 | 0.2% |
| Scotland | 11 | 0.3% |
| Serbia | 34 | 0.8% |
| South Africa | 43 | 1.1% |
| South America | 22 | 0.5% |
| South Central Asia | 11 | 0.3% |
| South Eastern Asia | 60 | 1.5% |
| Switzerland | 19 | 0.5% |
| Taiwan | 10 | 0.3% |
| Vietnam | 16 | 0.4% |
| Western Asia | 3 | 0.1% |
| Western Europe | 108 | 2.6% | View All 35 Rows |
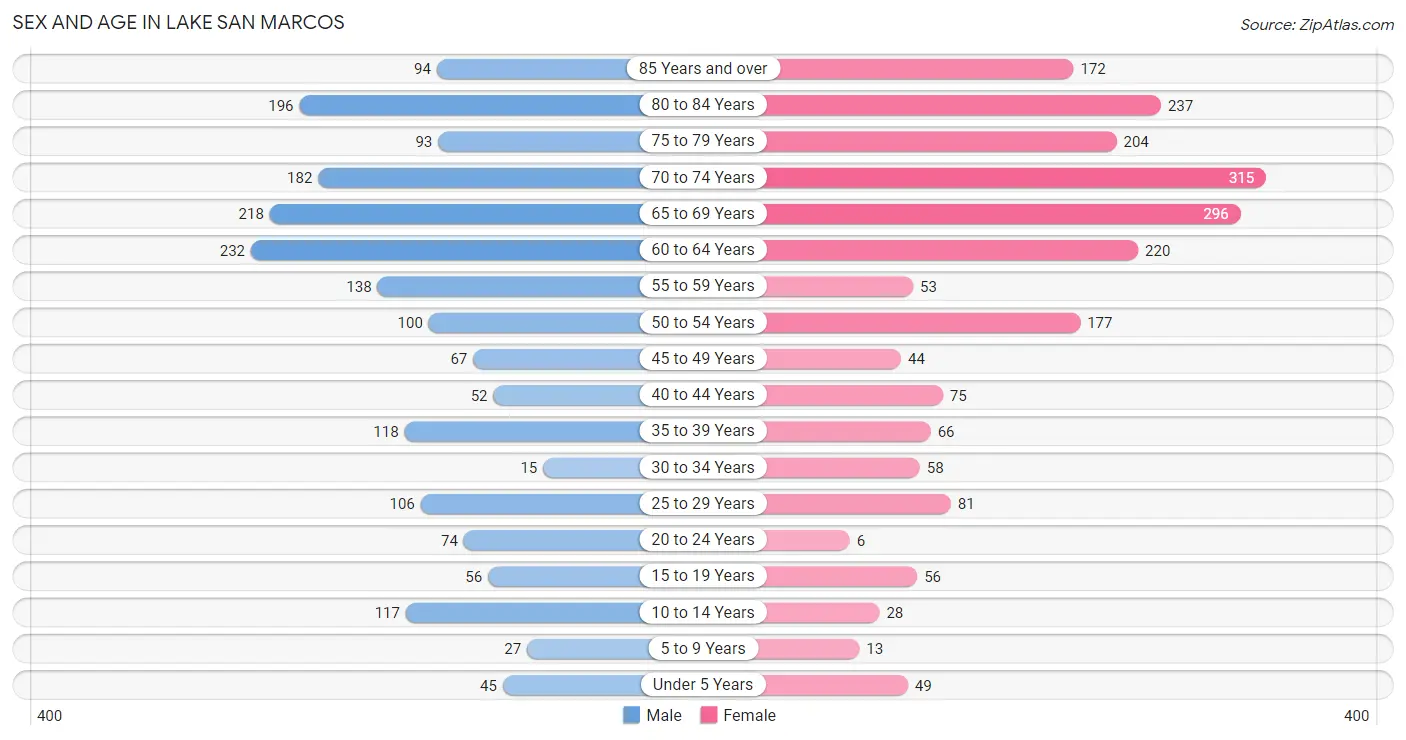
Sex and Age in Lake San Marcos
Sex and Age in Lake San Marcos
The most populous age groups in Lake San Marcos are 60 to 64 Years (232 | 12.0%) for men and 70 to 74 Years (315 | 14.6%) for women.
| Age Bracket | Male | Female |
| Under 5 Years | 45 (2.3%) | 49 (2.3%) |
| 5 to 9 Years | 27 (1.4%) | 13 (0.6%) |
| 10 to 14 Years | 117 (6.1%) | 28 (1.3%) |
| 15 to 19 Years | 56 (2.9%) | 56 (2.6%) |
| 20 to 24 Years | 74 (3.8%) | 6 (0.3%) |
| 25 to 29 Years | 106 (5.5%) | 81 (3.8%) |
| 30 to 34 Years | 15 (0.8%) | 58 (2.7%) |
| 35 to 39 Years | 118 (6.1%) | 66 (3.1%) |
| 40 to 44 Years | 52 (2.7%) | 75 (3.5%) |
| 45 to 49 Years | 67 (3.5%) | 44 (2.1%) |
| 50 to 54 Years | 100 (5.2%) | 177 (8.2%) |
| 55 to 59 Years | 138 (7.1%) | 53 (2.5%) |
| 60 to 64 Years | 232 (12.0%) | 220 (10.2%) |
| 65 to 69 Years | 218 (11.3%) | 296 (13.8%) |
| 70 to 74 Years | 182 (9.4%) | 315 (14.6%) |
| 75 to 79 Years | 93 (4.8%) | 204 (9.5%) |
| 80 to 84 Years | 196 (10.2%) | 237 (11.0%) |
| 85 Years and over | 94 (4.9%) | 172 (8.0%) |
| Total | 1,930 (100.0%) | 2,150 (100.0%) |
Families and Households in Lake San Marcos
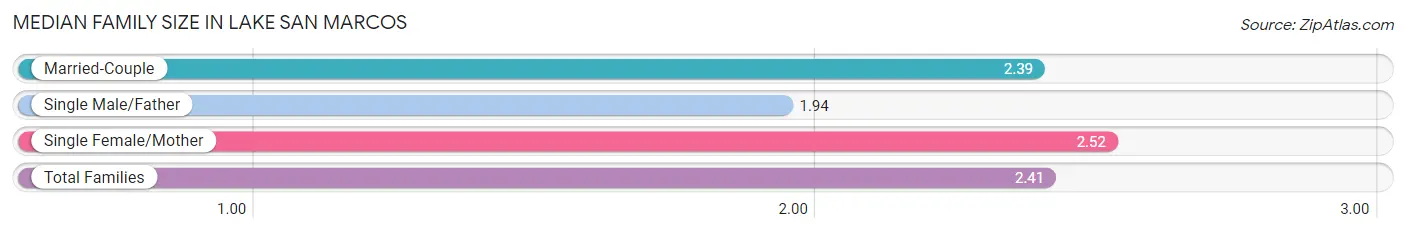
Median Family Size in Lake San Marcos
The median family size in Lake San Marcos is 2.41 persons per family, with single female/mother families (234 | 20.1%) accounting for the largest median family size of 2.52 persons per family. On the other hand, single male/father families (16 | 1.4%) represent the smallest median family size with 1.94 persons per family.
| Family Type | # Families | Family Size |
| Married-Couple | 914 (78.5%) | 2.39 |
| Single Male/Father | 16 (1.4%) | 1.94 |
| Single Female/Mother | 234 (20.1%) | 2.52 |
| Total Families | 1,164 (100.0%) | 2.41 |
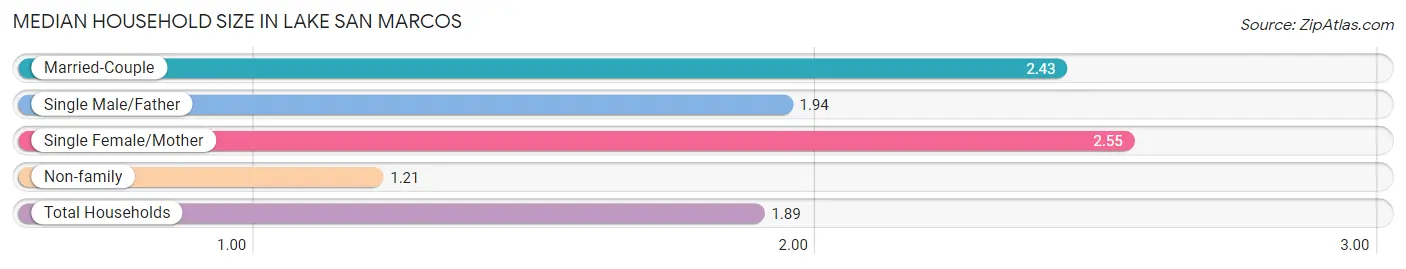
Median Household Size in Lake San Marcos
The median household size in Lake San Marcos is 1.89 persons per household, with single female/mother households (234 | 11.0%) accounting for the largest median household size of 2.55 persons per household. non-family households (972 | 45.5%) represent the smallest median household size with 1.21 persons per household.
| Household Type | # Households | Household Size |
| Married-Couple | 914 (42.8%) | 2.43 |
| Single Male/Father | 16 (0.7%) | 1.94 |
| Single Female/Mother | 234 (11.0%) | 2.55 |
| Non-family | 972 (45.5%) | 1.21 |
| Total Households | 2,136 (100.0%) | 1.89 |
Household Size by Marriage Status in Lake San Marcos
Out of a total of 2,136 households in Lake San Marcos, 1,164 (54.5%) are family households, while 972 (45.5%) are nonfamily households. The most numerous type of family households are 2-person households, comprising 884, and the most common type of nonfamily households are 1-person households, comprising 782.
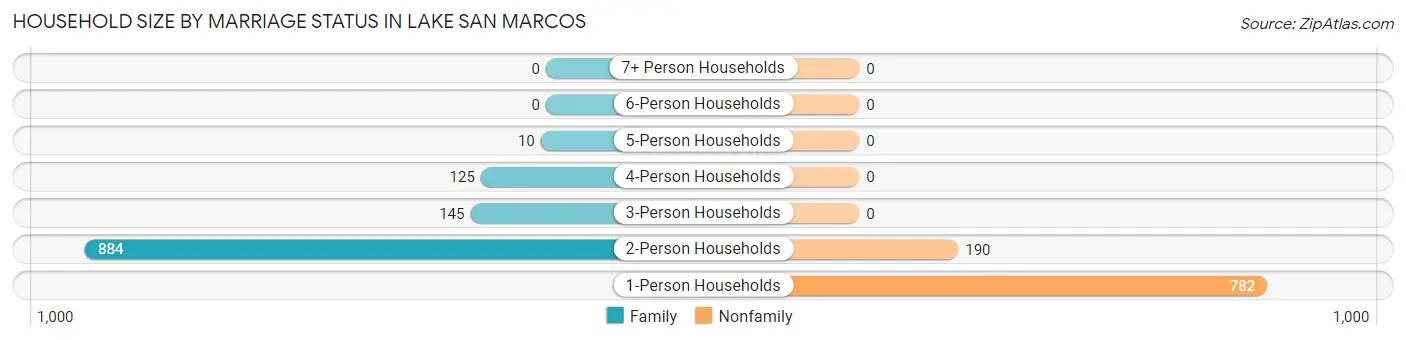
| Household Size | Family Households | Nonfamily Households |
| 1-Person Households | - | 782 (36.6%) |
| 2-Person Households | 884 (41.4%) | 190 (8.9%) |
| 3-Person Households | 145 (6.8%) | 0 (0.0%) |
| 4-Person Households | 125 (5.9%) | 0 (0.0%) |
| 5-Person Households | 10 (0.5%) | 0 (0.0%) |
| 6-Person Households | 0 (0.0%) | 0 (0.0%) |
| 7+ Person Households | 0 (0.0%) | 0 (0.0%) |
| Total | 1,164 (54.5%) | 972 (45.5%) |
Female Fertility in Lake San Marcos
Fertility by Age in Lake San Marcos
Average fertility rate in Lake San Marcos is 28.0 births per 1,000 women. Women in the age bracket of 35 to 50 years have the highest fertility rate with 59.0 births per 1,000 women. Women in the age bracket of 35 to 50 years acount for 100.0% of all women with births.
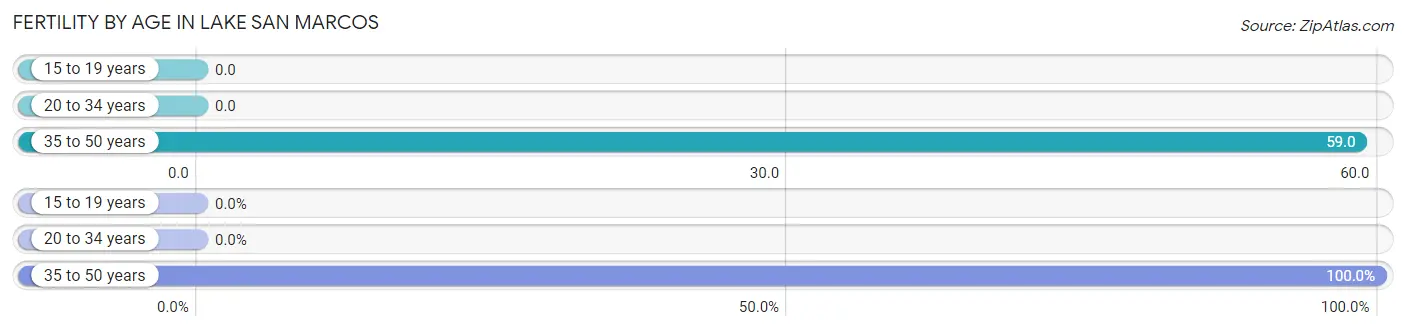
| Age Bracket | Women with Births | Births / 1,000 Women |
| 15 to 19 years | 0 (0.0%) | 0.0 |
| 20 to 34 years | 0 (0.0%) | 0.0 |
| 35 to 50 years | 11 (100.0%) | 59.0 |
| Total | 11 (100.0%) | 28.0 |
Fertility by Age by Marriage Status in Lake San Marcos
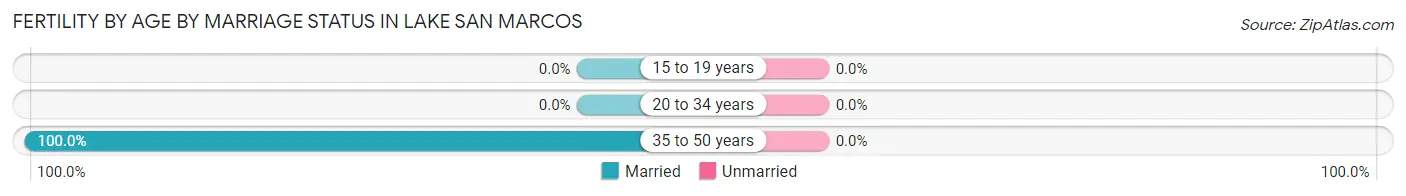
| Age Bracket | Married | Unmarried |
| 15 to 19 years | 0 (0.0%) | 0 (0.0%) |
| 20 to 34 years | 0 (0.0%) | 0 (0.0%) |
| 35 to 50 years | 11 (100.0%) | 0 (0.0%) |
| Total | 11 (100.0%) | 0 (0.0%) |
Fertility by Education in Lake San Marcos
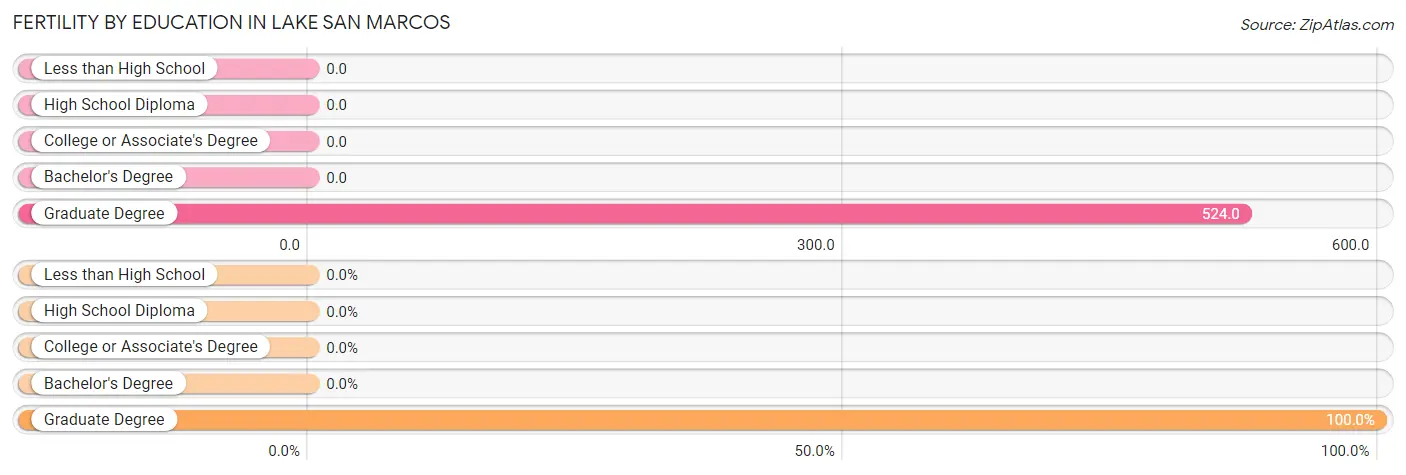
| Educational Attainment | Women with Births | Births / 1,000 Women |
| Less than High School | 0 (0.0%) | 0.0 |
| High School Diploma | 0 (0.0%) | 0.0 |
| College or Associate's Degree | 0 (0.0%) | 0.0 |
| Bachelor's Degree | 0 (0.0%) | 0.0 |
| Graduate Degree | 11 (100.0%) | 524.0 |
| Total | 11 (100.0%) | 28.0 |
Fertility by Education by Marriage Status in Lake San Marcos
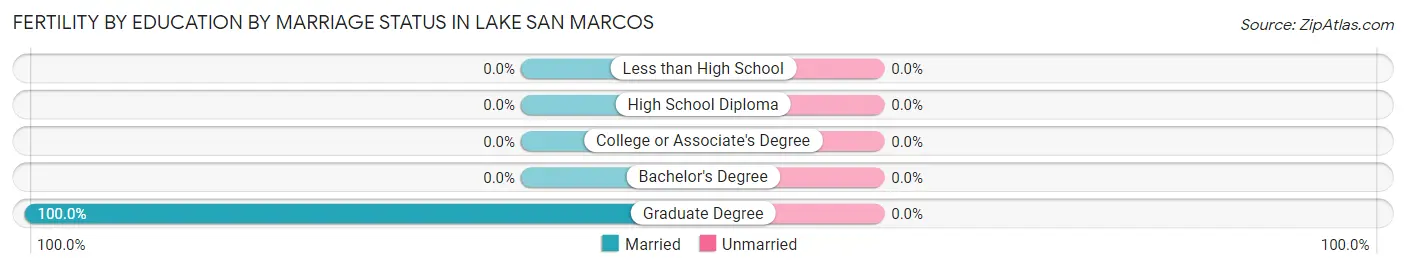
| Educational Attainment | Married | Unmarried |
| Less than High School | 0 (0.0%) | 0 (0.0%) |
| High School Diploma | 0 (0.0%) | 0 (0.0%) |
| College or Associate's Degree | 0 (0.0%) | 0 (0.0%) |
| Bachelor's Degree | 0 (0.0%) | 0 (0.0%) |
| Graduate Degree | 11 (100.0%) | 0 (0.0%) |
| Total | 11 (100.0%) | 0 (0.0%) |
Employment Characteristics in Lake San Marcos
Employment by Class of Employer in Lake San Marcos
Among the 1,645 employed individuals in Lake San Marcos, private company employees (909 | 55.3%), self-employed (not incorporated) (332 | 20.2%), and local government employees (164 | 10.0%) make up the most common classes of employment.
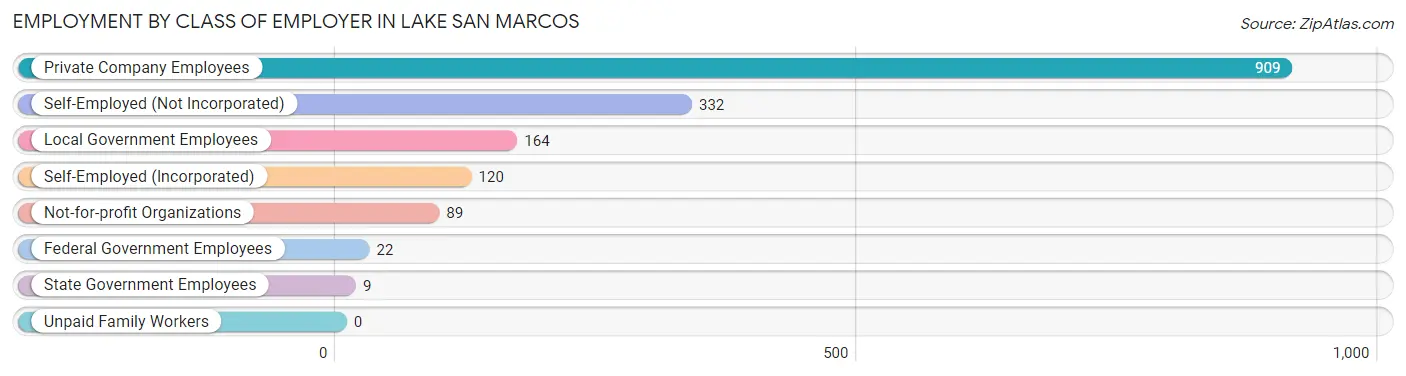
| Employer Class | # Employees | % Employees |
| Private Company Employees | 909 | 55.3% |
| Self-Employed (Incorporated) | 120 | 7.3% |
| Self-Employed (Not Incorporated) | 332 | 20.2% |
| Not-for-profit Organizations | 89 | 5.4% |
| Local Government Employees | 164 | 10.0% |
| State Government Employees | 9 | 0.5% |
| Federal Government Employees | 22 | 1.3% |
| Unpaid Family Workers | 0 | 0.0% |
| Total | 1,645 | 100.0% |
Employment Status by Age in Lake San Marcos
According to the labor force statistics for Lake San Marcos, out of the total population over 16 years of age (3,773), 47.7% or 1,800 individuals are in the labor force, with 4.5% or 81 of them unemployed. The age group with the highest labor force participation rate is 30 to 34 years, with 100.0% or 73 individuals in the labor force. Within the labor force, the 65 to 74 years age range has the highest percentage of unemployed individuals, with 10.8% or 44 of them being unemployed.
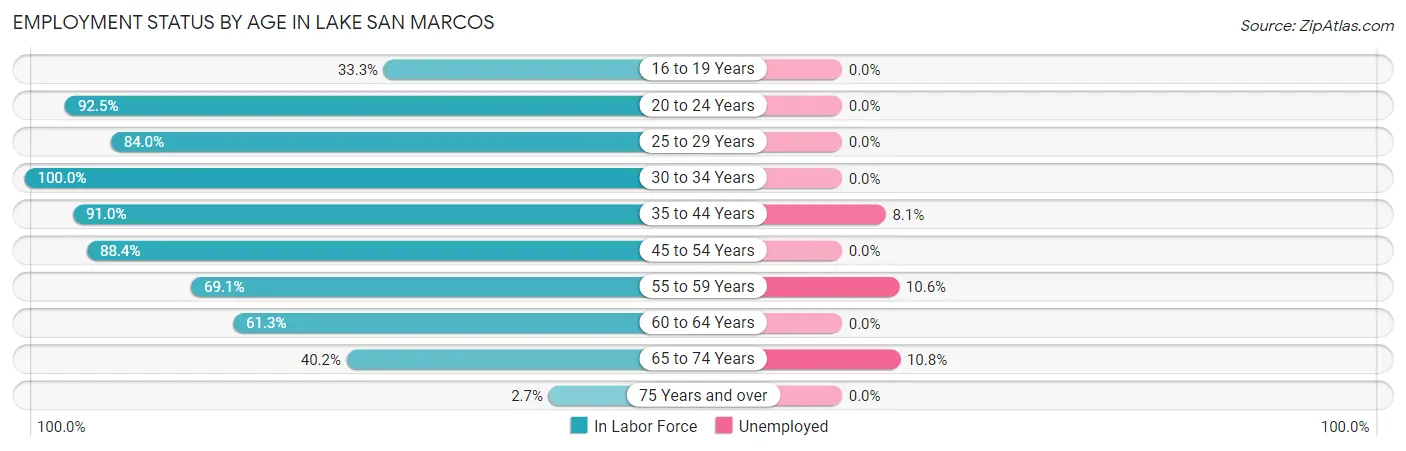
| Age Bracket | In Labor Force | Unemployed |
| 16 to 19 Years | 28 (33.3%) | 0 (0.0%) |
| 20 to 24 Years | 74 (92.5%) | 0 (0.0%) |
| 25 to 29 Years | 157 (84.0%) | 0 (0.0%) |
| 30 to 34 Years | 73 (100.0%) | 0 (0.0%) |
| 35 to 44 Years | 283 (91.0%) | 23 (8.1%) |
| 45 to 54 Years | 343 (88.4%) | 0 (0.0%) |
| 55 to 59 Years | 132 (69.1%) | 14 (10.6%) |
| 60 to 64 Years | 277 (61.3%) | 0 (0.0%) |
| 65 to 74 Years | 406 (40.2%) | 44 (10.8%) |
| 75 Years and over | 27 (2.7%) | 0 (0.0%) |
| Total | 1,800 (47.7%) | 81 (4.5%) |
Employment Status by Educational Attainment in Lake San Marcos
According to labor force statistics for Lake San Marcos, 79.0% of individuals (1,266) out of the total population between 25 and 64 years of age (1,602) are in the labor force, with 2.9% or 37 of them being unemployed. The group with the highest labor force participation rate are those with the educational attainment of high school diploma, with 84.8% or 195 individuals in the labor force. Within the labor force, individuals with high school diploma education have the highest percentage of unemployment, with 8.7% or 17 of them being unemployed.
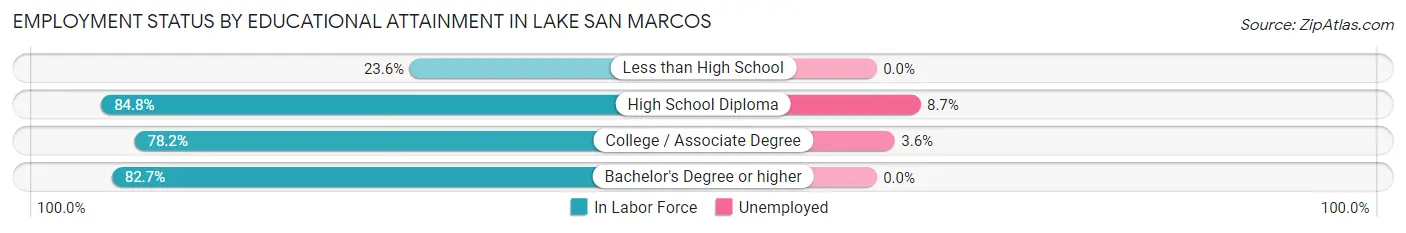
| Educational Attainment | In Labor Force | Unemployed |
| Less than High School | 13 (23.6%) | 0 (0.0%) |
| High School Diploma | 195 (84.8%) | 20 (8.7%) |
| College / Associate Degree | 555 (78.2%) | 26 (3.6%) |
| Bachelor's Degree or higher | 502 (82.7%) | 0 (0.0%) |
| Total | 1,266 (79.0%) | 46 (2.9%) |
Employment Occupations by Sex in Lake San Marcos
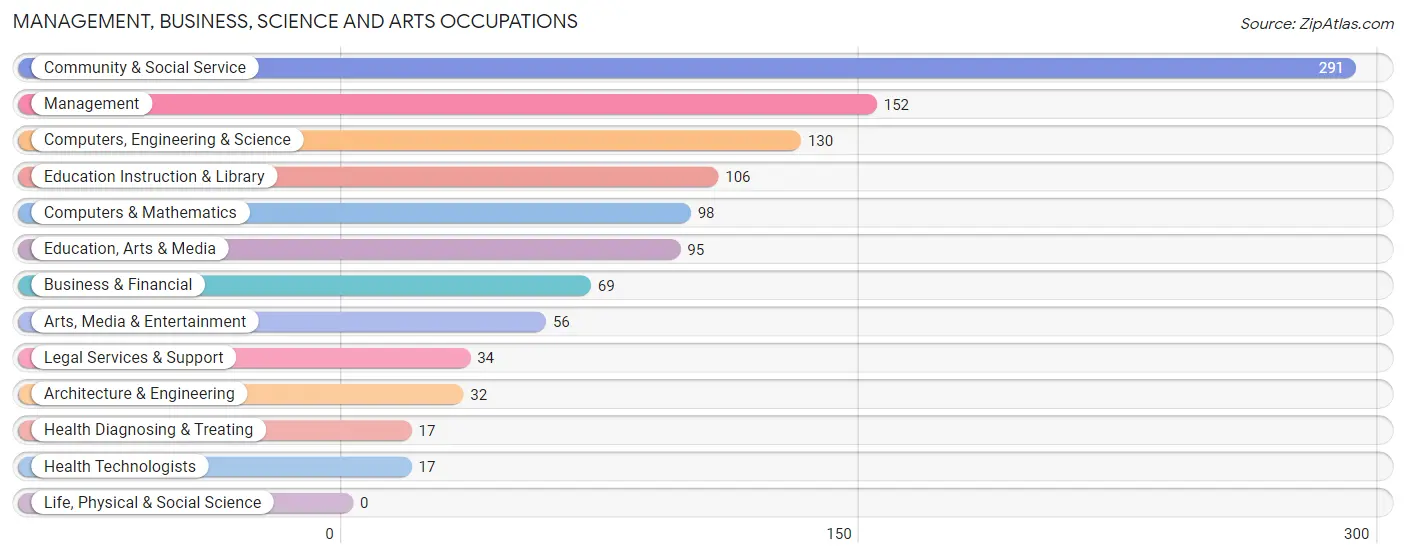
Management, Business, Science and Arts Occupations
The most common Management, Business, Science and Arts occupations in Lake San Marcos are Community & Social Service (291 | 16.9%), Management (152 | 8.8%), Computers, Engineering & Science (130 | 7.6%), Education Instruction & Library (106 | 6.2%), and Computers & Mathematics (98 | 5.7%).
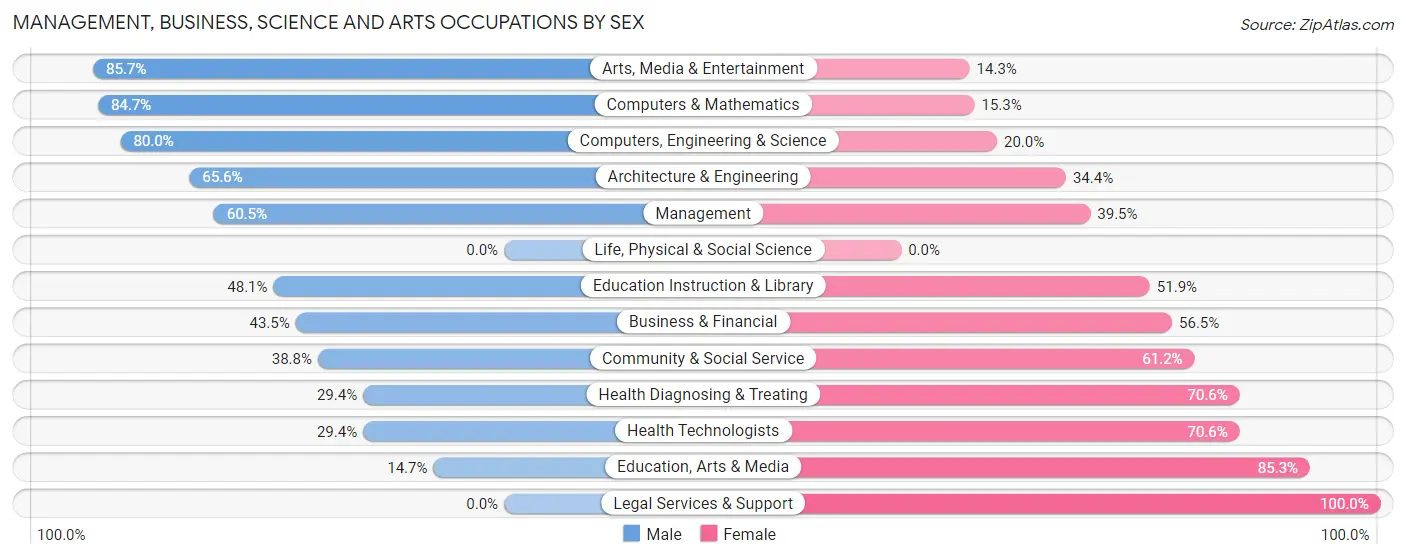
Management, Business, Science and Arts Occupations by Sex
Within the Management, Business, Science and Arts occupations in Lake San Marcos, the most male-oriented occupations are Arts, Media & Entertainment (85.7%), Computers & Mathematics (84.7%), and Computers, Engineering & Science (80.0%), while the most female-oriented occupations are Legal Services & Support (100.0%), Education, Arts & Media (85.3%), and Health Diagnosing & Treating (70.6%).
| Occupation | Male | Female |
| Management | 92 (60.5%) | 60 (39.5%) |
| Business & Financial | 30 (43.5%) | 39 (56.5%) |
| Computers, Engineering & Science | 104 (80.0%) | 26 (20.0%) |
| Computers & Mathematics | 83 (84.7%) | 15 (15.3%) |
| Architecture & Engineering | 21 (65.6%) | 11 (34.4%) |
| Life, Physical & Social Science | 0 (0.0%) | 0 (0.0%) |
| Community & Social Service | 113 (38.8%) | 178 (61.2%) |
| Education, Arts & Media | 14 (14.7%) | 81 (85.3%) |
| Legal Services & Support | 0 (0.0%) | 34 (100.0%) |
| Education Instruction & Library | 51 (48.1%) | 55 (51.9%) |
| Arts, Media & Entertainment | 48 (85.7%) | 8 (14.3%) |
| Health Diagnosing & Treating | 5 (29.4%) | 12 (70.6%) |
| Health Technologists | 5 (29.4%) | 12 (70.6%) |
| Total (Category) | 344 (52.2%) | 315 (47.8%) |
| Total (Overall) | 889 (51.7%) | 830 (48.3%) |
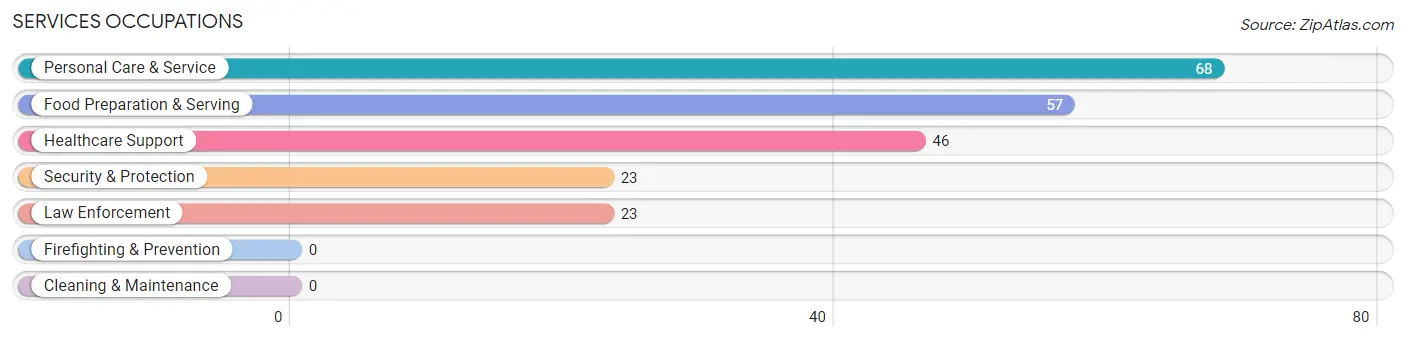
Services Occupations
The most common Services occupations in Lake San Marcos are Personal Care & Service (68 | 4.0%), Food Preparation & Serving (57 | 3.3%), Healthcare Support (46 | 2.7%), Security & Protection (23 | 1.3%), and Law Enforcement (23 | 1.3%).
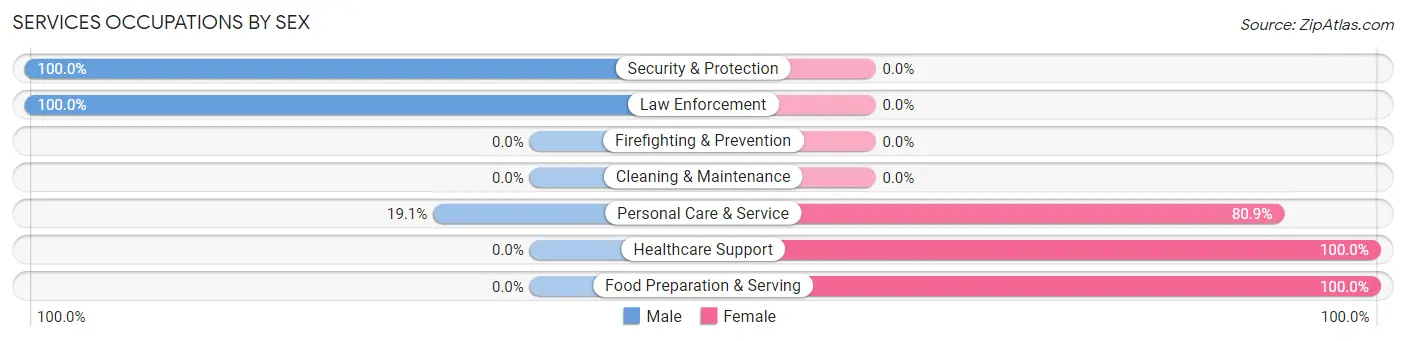
Services Occupations by Sex
Within the Services occupations in Lake San Marcos, the most male-oriented occupations are Security & Protection (100.0%), Law Enforcement (100.0%), and Personal Care & Service (19.1%), while the most female-oriented occupations are Healthcare Support (100.0%), Food Preparation & Serving (100.0%), and Personal Care & Service (80.9%).
| Occupation | Male | Female |
| Healthcare Support | 0 (0.0%) | 46 (100.0%) |
| Security & Protection | 23 (100.0%) | 0 (0.0%) |
| Firefighting & Prevention | 0 (0.0%) | 0 (0.0%) |
| Law Enforcement | 23 (100.0%) | 0 (0.0%) |
| Food Preparation & Serving | 0 (0.0%) | 57 (100.0%) |
| Cleaning & Maintenance | 0 (0.0%) | 0 (0.0%) |
| Personal Care & Service | 13 (19.1%) | 55 (80.9%) |
| Total (Category) | 36 (18.6%) | 158 (81.4%) |
| Total (Overall) | 889 (51.7%) | 830 (48.3%) |
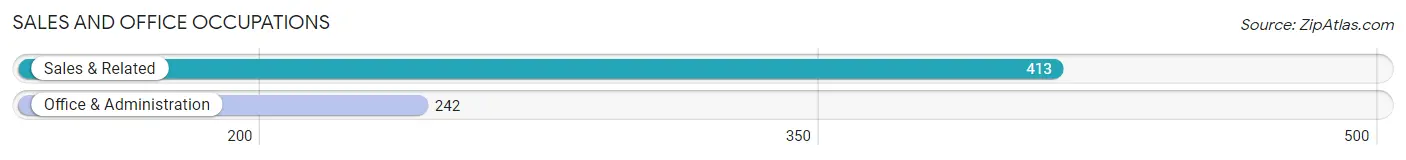
Sales and Office Occupations
The most common Sales and Office occupations in Lake San Marcos are Sales & Related (413 | 24.0%), and Office & Administration (242 | 14.1%).
Sales and Office Occupations by Sex
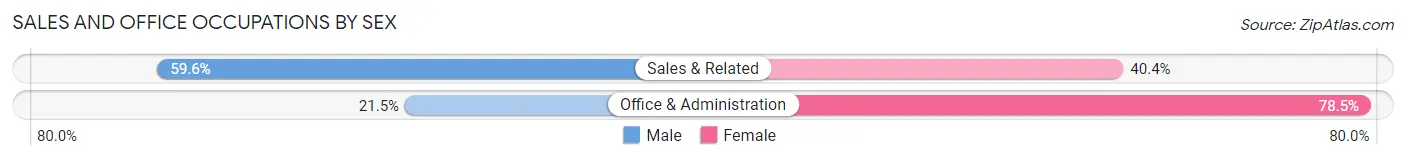
| Occupation | Male | Female |
| Sales & Related | 246 (59.6%) | 167 (40.4%) |
| Office & Administration | 52 (21.5%) | 190 (78.5%) |
| Total (Category) | 298 (45.5%) | 357 (54.5%) |
| Total (Overall) | 889 (51.7%) | 830 (48.3%) |
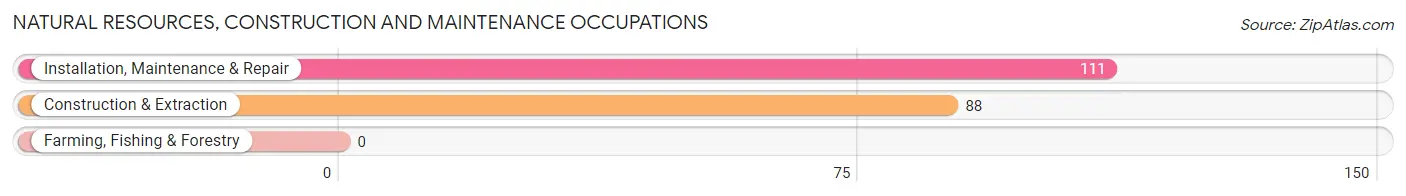
Natural Resources, Construction and Maintenance Occupations
The most common Natural Resources, Construction and Maintenance occupations in Lake San Marcos are Installation, Maintenance & Repair (111 | 6.5%), and Construction & Extraction (88 | 5.1%).
Natural Resources, Construction and Maintenance Occupations by Sex
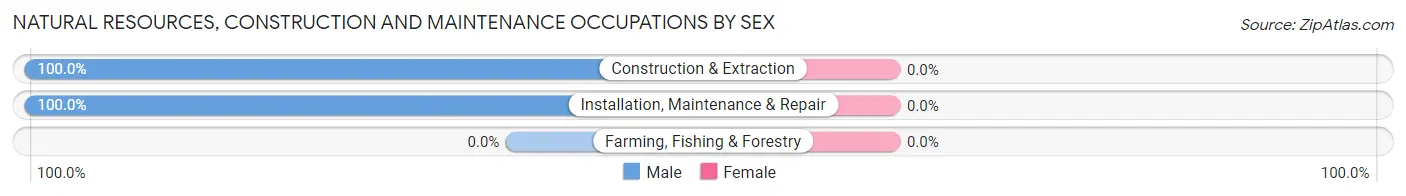
| Occupation | Male | Female |
| Farming, Fishing & Forestry | 0 (0.0%) | 0 (0.0%) |
| Construction & Extraction | 88 (100.0%) | 0 (0.0%) |
| Installation, Maintenance & Repair | 111 (100.0%) | 0 (0.0%) |
| Total (Category) | 199 (100.0%) | 0 (0.0%) |
| Total (Overall) | 889 (51.7%) | 830 (48.3%) |
Production, Transportation and Moving Occupations
The most common Production, Transportation and Moving occupations in Lake San Marcos are , and Material Moving (12 | 0.7%).
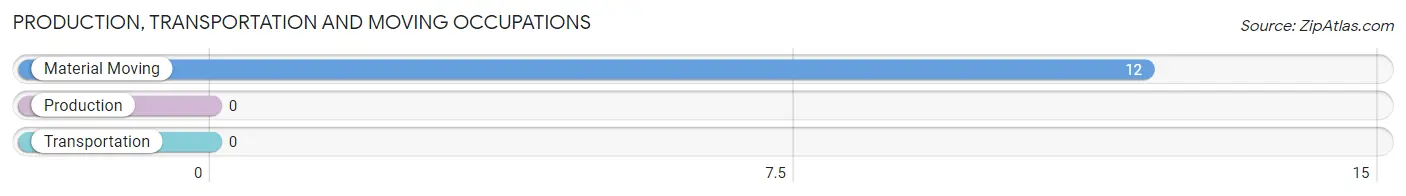
Production, Transportation and Moving Occupations by Sex
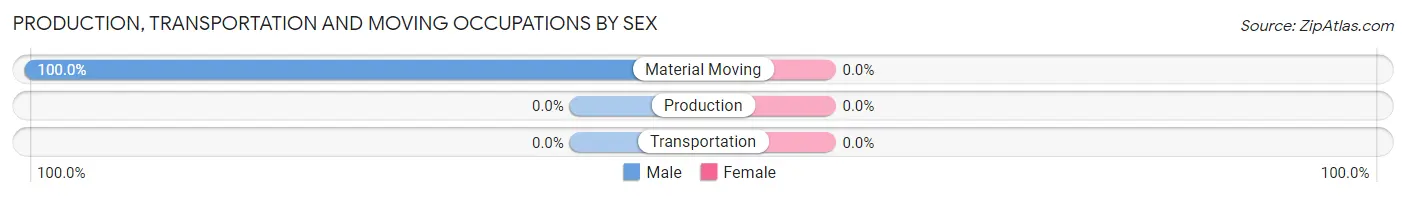
| Occupation | Male | Female |
| Production | 0 (0.0%) | 0 (0.0%) |
| Transportation | 0 (0.0%) | 0 (0.0%) |
| Material Moving | 12 (100.0%) | 0 (0.0%) |
| Total (Category) | 12 (100.0%) | 0 (0.0%) |
| Total (Overall) | 889 (51.7%) | 830 (48.3%) |
Employment Industries by Sex in Lake San Marcos
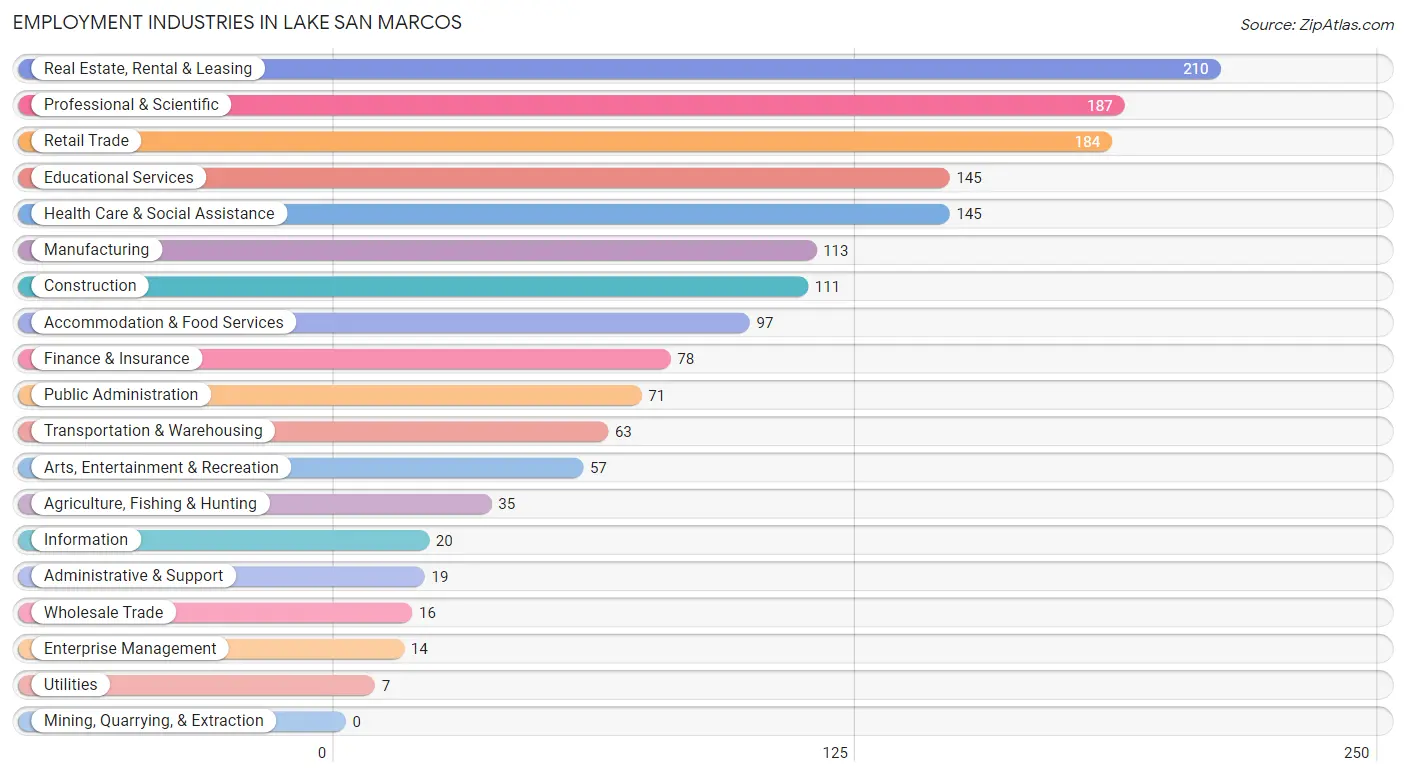
Employment Industries in Lake San Marcos
The major employment industries in Lake San Marcos include Real Estate, Rental & Leasing (210 | 12.2%), Professional & Scientific (187 | 10.9%), Retail Trade (184 | 10.7%), Educational Services (145 | 8.4%), and Health Care & Social Assistance (145 | 8.4%).
Employment Industries by Sex in Lake San Marcos
The Lake San Marcos industries that see more men than women are Utilities (100.0%), Information (100.0%), and Administrative & Support (100.0%), whereas the industries that tend to have a higher number of women are Agriculture, Fishing & Hunting (100.0%), Wholesale Trade (100.0%), and Finance & Insurance (100.0%).
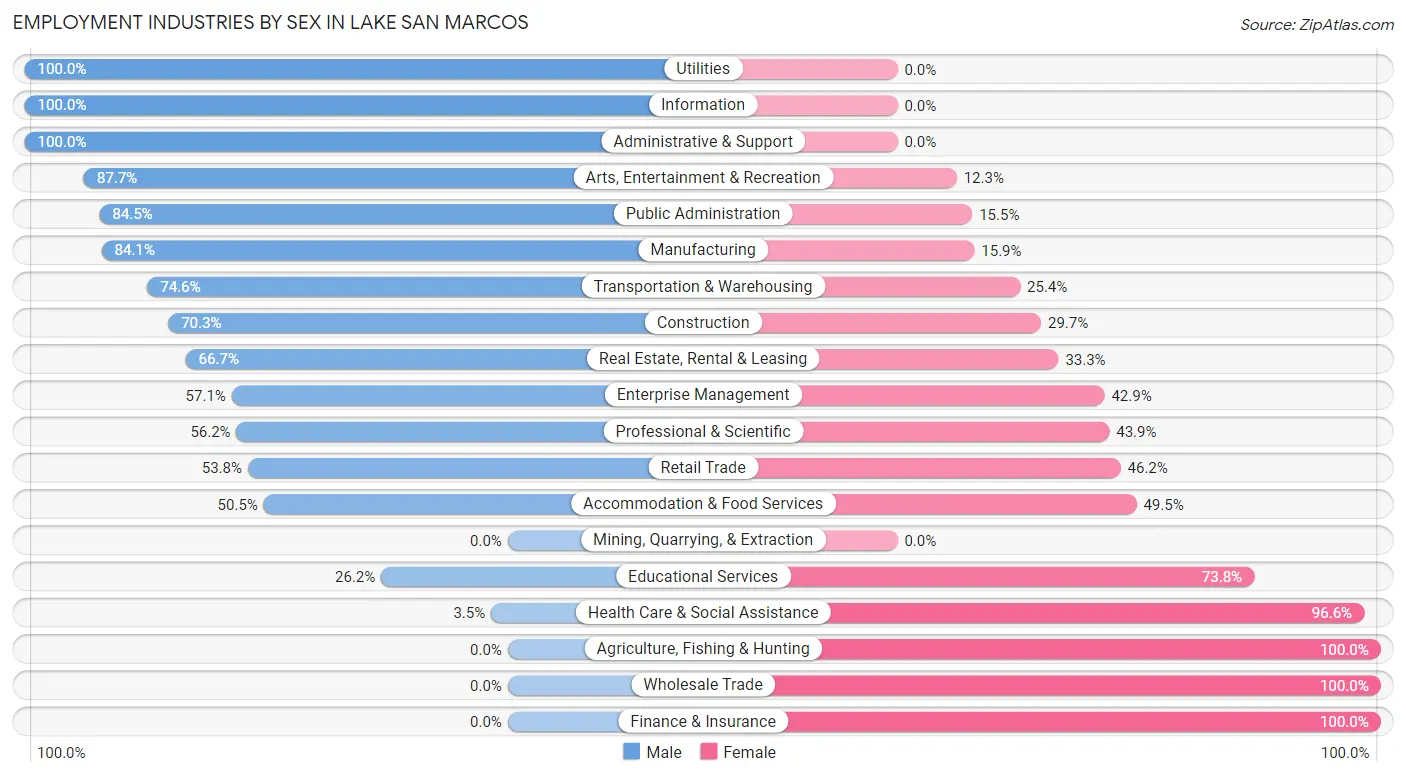
| Industry | Male | Female |
| Agriculture, Fishing & Hunting | 0 (0.0%) | 35 (100.0%) |
| Mining, Quarrying, & Extraction | 0 (0.0%) | 0 (0.0%) |
| Construction | 78 (70.3%) | 33 (29.7%) |
| Manufacturing | 95 (84.1%) | 18 (15.9%) |
| Wholesale Trade | 0 (0.0%) | 16 (100.0%) |
| Retail Trade | 99 (53.8%) | 85 (46.2%) |
| Transportation & Warehousing | 47 (74.6%) | 16 (25.4%) |
| Utilities | 7 (100.0%) | 0 (0.0%) |
| Information | 20 (100.0%) | 0 (0.0%) |
| Finance & Insurance | 0 (0.0%) | 78 (100.0%) |
| Real Estate, Rental & Leasing | 140 (66.7%) | 70 (33.3%) |
| Professional & Scientific | 105 (56.1%) | 82 (43.9%) |
| Enterprise Management | 8 (57.1%) | 6 (42.9%) |
| Administrative & Support | 19 (100.0%) | 0 (0.0%) |
| Educational Services | 38 (26.2%) | 107 (73.8%) |
| Health Care & Social Assistance | 5 (3.5%) | 140 (96.6%) |
| Arts, Entertainment & Recreation | 50 (87.7%) | 7 (12.3%) |
| Accommodation & Food Services | 49 (50.5%) | 48 (49.5%) |
| Public Administration | 60 (84.5%) | 11 (15.5%) |
| Total | 889 (51.7%) | 830 (48.3%) |
Education in Lake San Marcos
School Enrollment in Lake San Marcos
The most common levels of schooling among the 443 students in Lake San Marcos are middle school (122 | 27.5%), high school (120 | 27.1%), and college / undergraduate (89 | 20.1%).
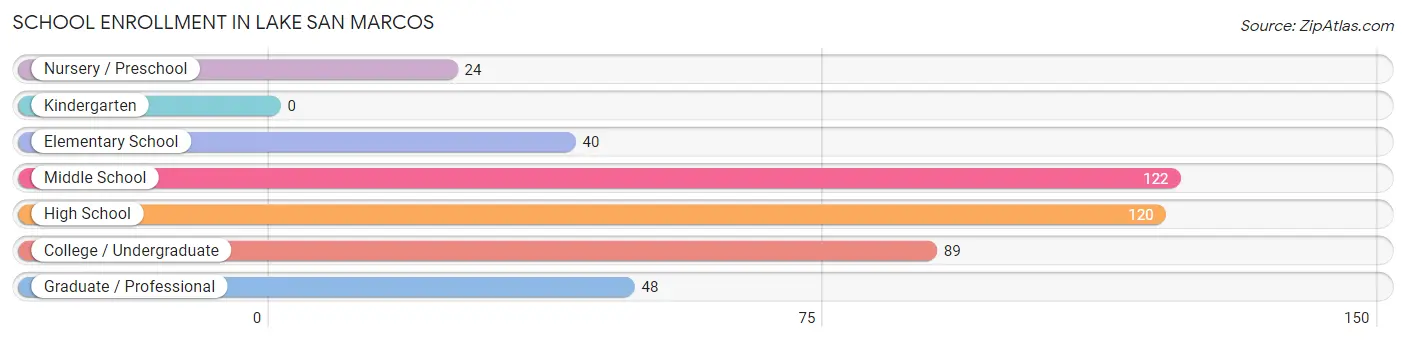
| School Level | # Students | % Students |
| Nursery / Preschool | 24 | 5.4% |
| Kindergarten | 0 | 0.0% |
| Elementary School | 40 | 9.0% |
| Middle School | 122 | 27.5% |
| High School | 120 | 27.1% |
| College / Undergraduate | 89 | 20.1% |
| Graduate / Professional | 48 | 10.8% |
| Total | 443 | 100.0% |
School Enrollment by Age by Funding Source in Lake San Marcos
Out of a total of 443 students who are enrolled in schools in Lake San Marcos, 77 (17.4%) attend a private institution, while the remaining 366 (82.6%) are enrolled in public schools. The age group of 3 to 4 year olds has the highest likelihood of being enrolled in private schools, with 20 (83.3% in the age bracket) enrolled. Conversely, the age group of 5 to 9 year old has the lowest likelihood of being enrolled in a private school, with 40 (100.0% in the age bracket) attending a public institution.
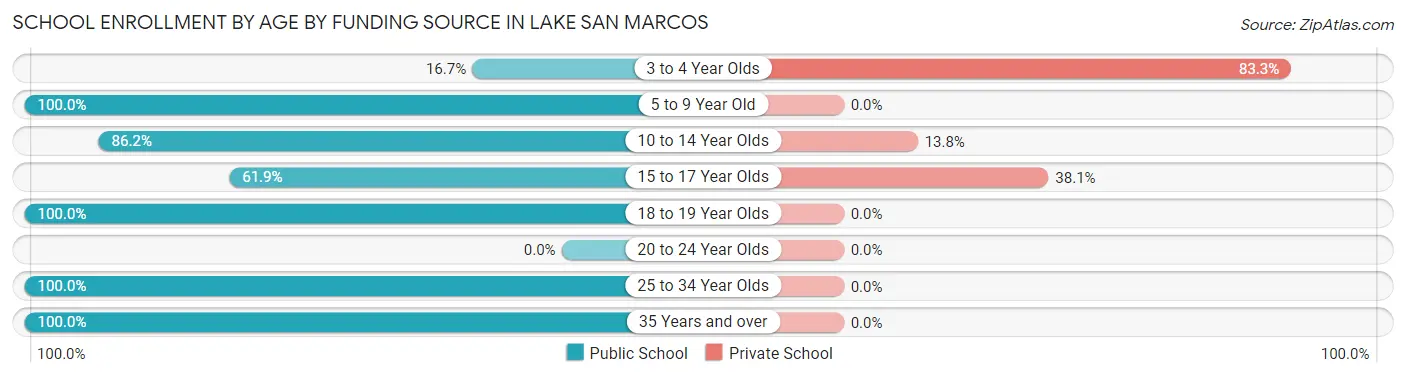
| Age Bracket | Public School | Private School |
| 3 to 4 Year Olds | 4 (16.7%) | 20 (83.3%) |
| 5 to 9 Year Old | 40 (100.0%) | 0 (0.0%) |
| 10 to 14 Year Olds | 125 (86.2%) | 20 (13.8%) |
| 15 to 17 Year Olds | 60 (61.9%) | 37 (38.1%) |
| 18 to 19 Year Olds | 15 (100.0%) | 0 (0.0%) |
| 20 to 24 Year Olds | 0 (0.0%) | 0 (0.0%) |
| 25 to 34 Year Olds | 87 (100.0%) | 0 (0.0%) |
| 35 Years and over | 35 (100.0%) | 0 (0.0%) |
| Total | 366 (82.6%) | 77 (17.4%) |
Educational Attainment by Field of Study in Lake San Marcos
Business (335 | 21.3%), social sciences (177 | 11.3%), education (164 | 10.4%), liberal arts & history (140 | 8.9%), and bio, nature & agricultural (137 | 8.7%) are the most common fields of study among 1,574 individuals in Lake San Marcos who have obtained a bachelor's degree or higher.
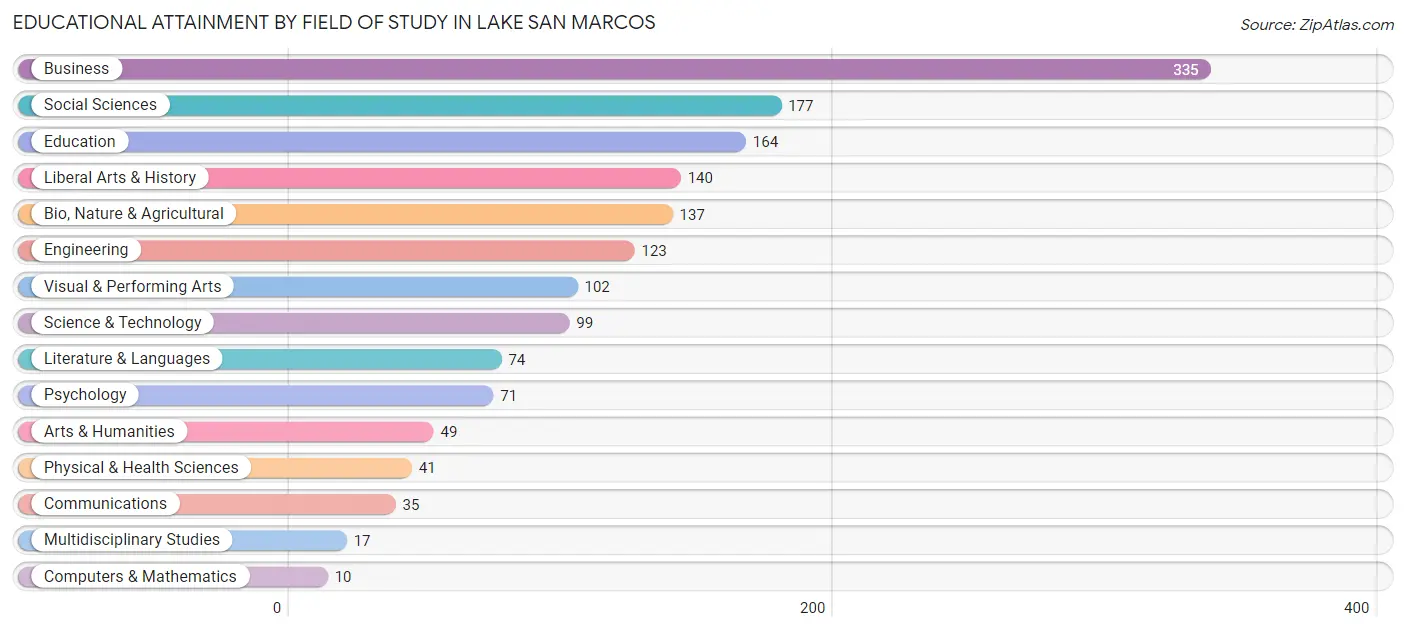
| Field of Study | # Graduates | % Graduates |
| Computers & Mathematics | 10 | 0.6% |
| Bio, Nature & Agricultural | 137 | 8.7% |
| Physical & Health Sciences | 41 | 2.6% |
| Psychology | 71 | 4.5% |
| Social Sciences | 177 | 11.3% |
| Engineering | 123 | 7.8% |
| Multidisciplinary Studies | 17 | 1.1% |
| Science & Technology | 99 | 6.3% |
| Business | 335 | 21.3% |
| Education | 164 | 10.4% |
| Literature & Languages | 74 | 4.7% |
| Liberal Arts & History | 140 | 8.9% |
| Visual & Performing Arts | 102 | 6.5% |
| Communications | 35 | 2.2% |
| Arts & Humanities | 49 | 3.1% |
| Total | 1,574 | 100.0% |
Transportation & Commute in Lake San Marcos
Vehicle Availability by Sex in Lake San Marcos
The most prevalent vehicle ownership categories in Lake San Marcos are males with 2 vehicles (405, accounting for 49.7%) and females with 2 vehicles (394, making up 48.8%).
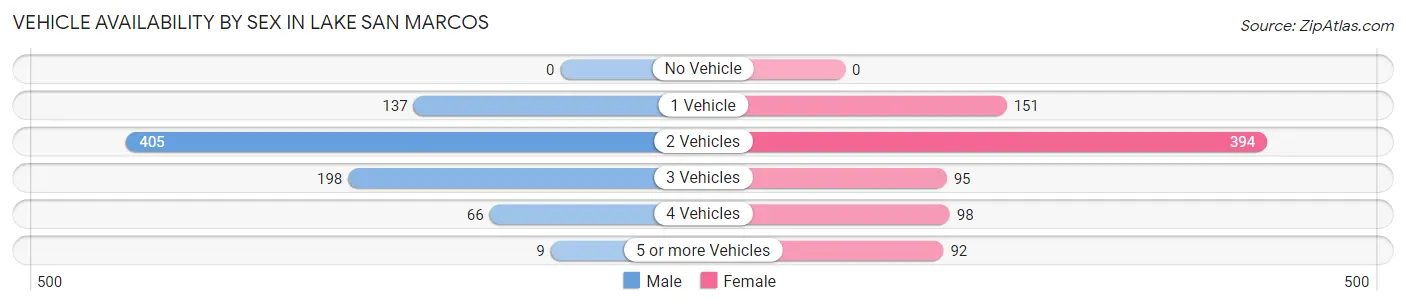
| Vehicles Available | Male | Female |
| No Vehicle | 0 (0.0%) | 0 (0.0%) |
| 1 Vehicle | 137 (16.8%) | 151 (18.2%) |
| 2 Vehicles | 405 (49.7%) | 394 (47.5%) |
| 3 Vehicles | 198 (24.3%) | 95 (11.5%) |
| 4 Vehicles | 66 (8.1%) | 98 (11.8%) |
| 5 or more Vehicles | 9 (1.1%) | 92 (11.1%) |
| Total | 815 (100.0%) | 830 (100.0%) |
Commute Time in Lake San Marcos
The most frequently occuring commute durations in Lake San Marcos are 20 to 24 minutes (315 commuters, 26.0%), 15 to 19 minutes (198 commuters, 16.4%), and 30 to 34 minutes (166 commuters, 13.7%).
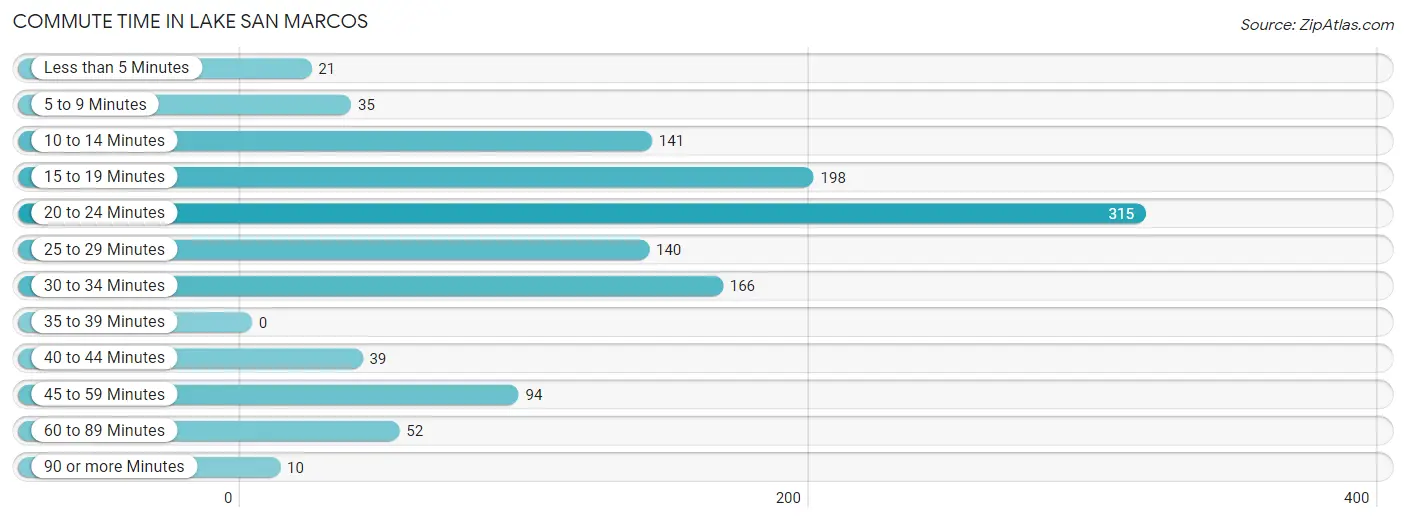
| Commute Time | # Commuters | % Commuters |
| Less than 5 Minutes | 21 | 1.7% |
| 5 to 9 Minutes | 35 | 2.9% |
| 10 to 14 Minutes | 141 | 11.6% |
| 15 to 19 Minutes | 198 | 16.4% |
| 20 to 24 Minutes | 315 | 26.0% |
| 25 to 29 Minutes | 140 | 11.6% |
| 30 to 34 Minutes | 166 | 13.7% |
| 35 to 39 Minutes | 0 | 0.0% |
| 40 to 44 Minutes | 39 | 3.2% |
| 45 to 59 Minutes | 94 | 7.8% |
| 60 to 89 Minutes | 52 | 4.3% |
| 90 or more Minutes | 10 | 0.8% |
Commute Time by Sex in Lake San Marcos
The most common commute times in Lake San Marcos are 20 to 24 minutes (170 commuters, 26.0%) for males and 20 to 24 minutes (145 commuters, 26.0%) for females.
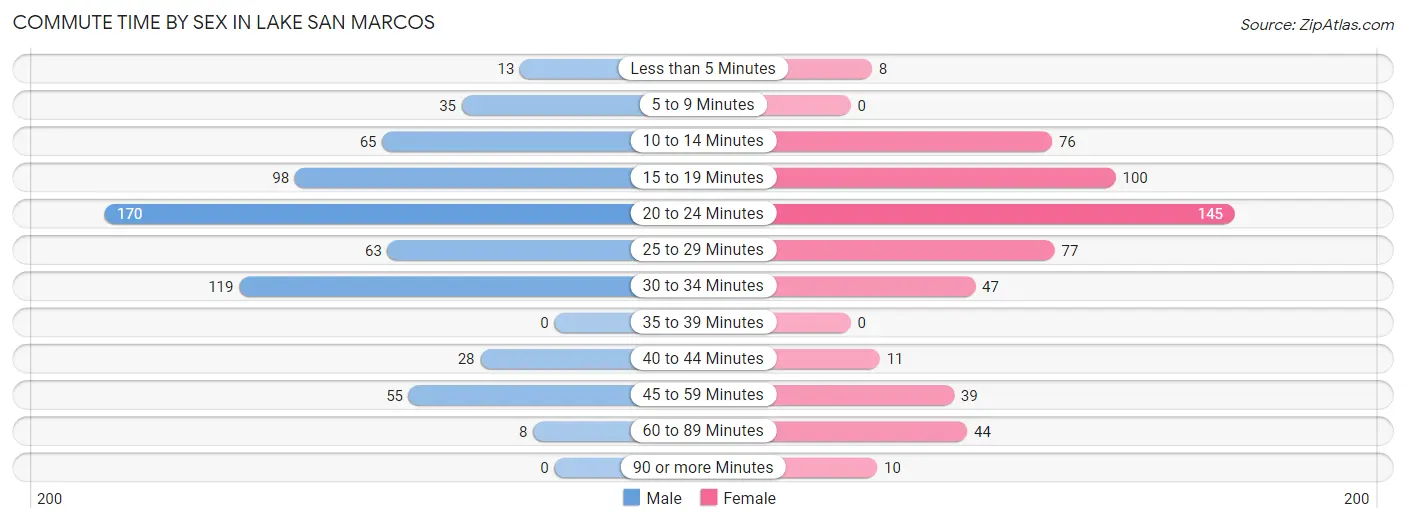
| Commute Time | Male | Female |
| Less than 5 Minutes | 13 (2.0%) | 8 (1.4%) |
| 5 to 9 Minutes | 35 (5.3%) | 0 (0.0%) |
| 10 to 14 Minutes | 65 (9.9%) | 76 (13.6%) |
| 15 to 19 Minutes | 98 (15.0%) | 100 (17.9%) |
| 20 to 24 Minutes | 170 (26.0%) | 145 (26.0%) |
| 25 to 29 Minutes | 63 (9.6%) | 77 (13.8%) |
| 30 to 34 Minutes | 119 (18.2%) | 47 (8.4%) |
| 35 to 39 Minutes | 0 (0.0%) | 0 (0.0%) |
| 40 to 44 Minutes | 28 (4.3%) | 11 (2.0%) |
| 45 to 59 Minutes | 55 (8.4%) | 39 (7.0%) |
| 60 to 89 Minutes | 8 (1.2%) | 44 (7.9%) |
| 90 or more Minutes | 0 (0.0%) | 10 (1.8%) |
Time of Departure to Work by Sex in Lake San Marcos
The most frequent times of departure to work in Lake San Marcos are 7:30 AM to 7:59 AM (221, 33.8%) for males and 6:30 AM to 6:59 AM (126, 22.6%) for females.
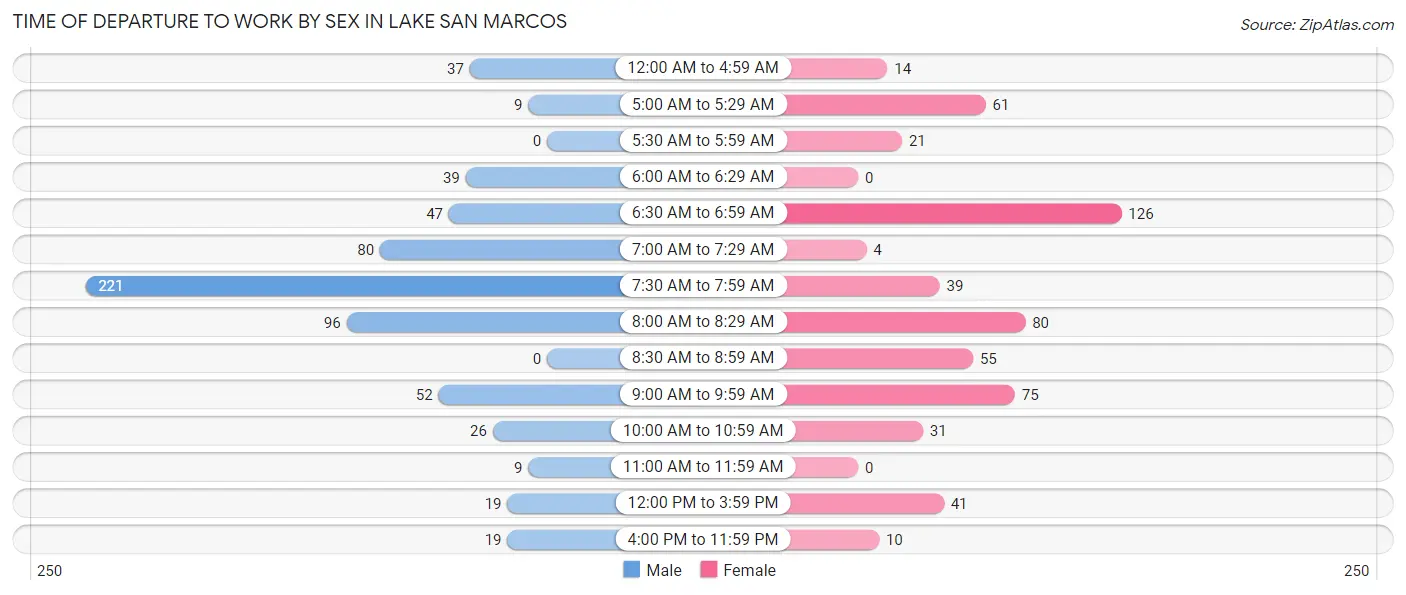
| Time of Departure | Male | Female |
| 12:00 AM to 4:59 AM | 37 (5.7%) | 14 (2.5%) |
| 5:00 AM to 5:29 AM | 9 (1.4%) | 61 (11.0%) |
| 5:30 AM to 5:59 AM | 0 (0.0%) | 21 (3.8%) |
| 6:00 AM to 6:29 AM | 39 (6.0%) | 0 (0.0%) |
| 6:30 AM to 6:59 AM | 47 (7.2%) | 126 (22.6%) |
| 7:00 AM to 7:29 AM | 80 (12.2%) | 4 (0.7%) |
| 7:30 AM to 7:59 AM | 221 (33.8%) | 39 (7.0%) |
| 8:00 AM to 8:29 AM | 96 (14.7%) | 80 (14.4%) |
| 8:30 AM to 8:59 AM | 0 (0.0%) | 55 (9.9%) |
| 9:00 AM to 9:59 AM | 52 (8.0%) | 75 (13.5%) |
| 10:00 AM to 10:59 AM | 26 (4.0%) | 31 (5.6%) |
| 11:00 AM to 11:59 AM | 9 (1.4%) | 0 (0.0%) |
| 12:00 PM to 3:59 PM | 19 (2.9%) | 41 (7.4%) |
| 4:00 PM to 11:59 PM | 19 (2.9%) | 10 (1.8%) |
| Total | 654 (100.0%) | 557 (100.0%) |
Housing Occupancy in Lake San Marcos
Occupancy by Ownership in Lake San Marcos
Of the total 2,136 dwellings in Lake San Marcos, owner-occupied units account for 1,737 (81.3%), while renter-occupied units make up 399 (18.7%).
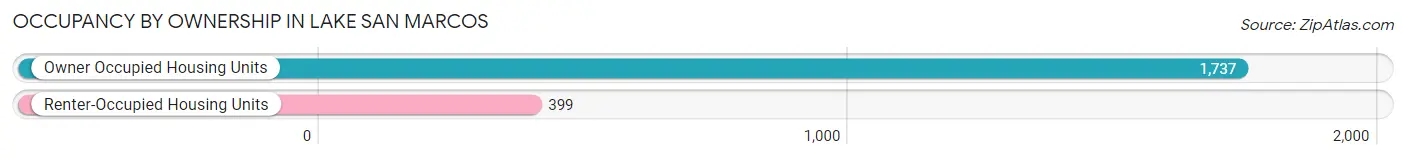
| Occupancy | # Housing Units | % Housing Units |
| Owner Occupied Housing Units | 1,737 | 81.3% |
| Renter-Occupied Housing Units | 399 | 18.7% |
| Total Occupied Housing Units | 2,136 | 100.0% |
Occupancy by Household Size in Lake San Marcos
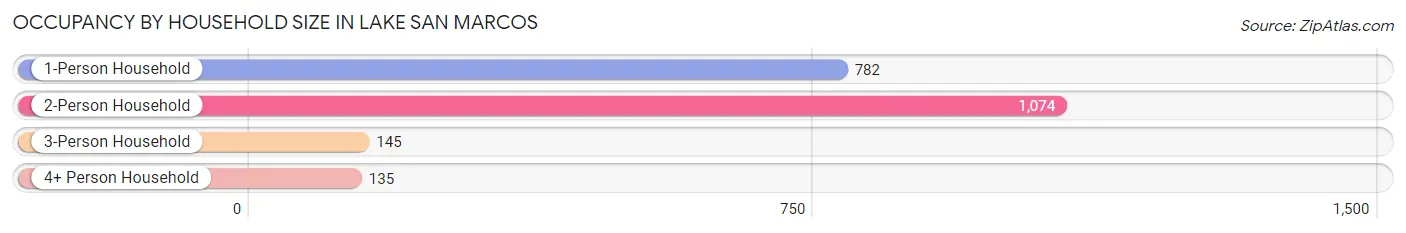
| Household Size | # Housing Units | % Housing Units |
| 1-Person Household | 782 | 36.6% |
| 2-Person Household | 1,074 | 50.3% |
| 3-Person Household | 145 | 6.8% |
| 4+ Person Household | 135 | 6.3% |
| Total Housing Units | 2,136 | 100.0% |
Occupancy by Ownership by Household Size in Lake San Marcos
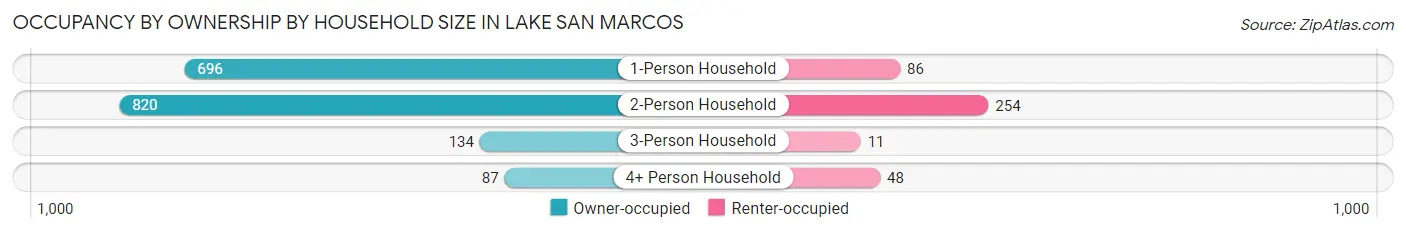
| Household Size | Owner-occupied | Renter-occupied |
| 1-Person Household | 696 (89.0%) | 86 (11.0%) |
| 2-Person Household | 820 (76.3%) | 254 (23.6%) |
| 3-Person Household | 134 (92.4%) | 11 (7.6%) |
| 4+ Person Household | 87 (64.4%) | 48 (35.6%) |
| Total Housing Units | 1,737 (81.3%) | 399 (18.7%) |
Occupancy by Educational Attainment in Lake San Marcos
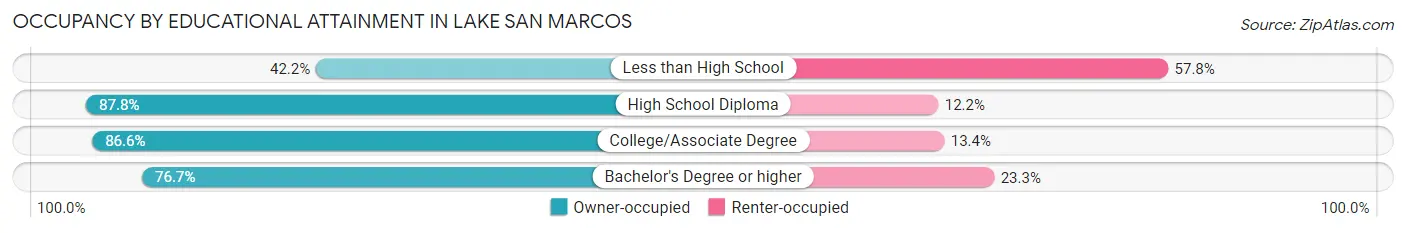
| Household Size | Owner-occupied | Renter-occupied |
| Less than High School | 19 (42.2%) | 26 (57.8%) |
| High School Diploma | 187 (87.8%) | 26 (12.2%) |
| College/Associate Degree | 794 (86.6%) | 123 (13.4%) |
| Bachelor's Degree or higher | 737 (76.7%) | 224 (23.3%) |
Occupancy by Age of Householder in Lake San Marcos
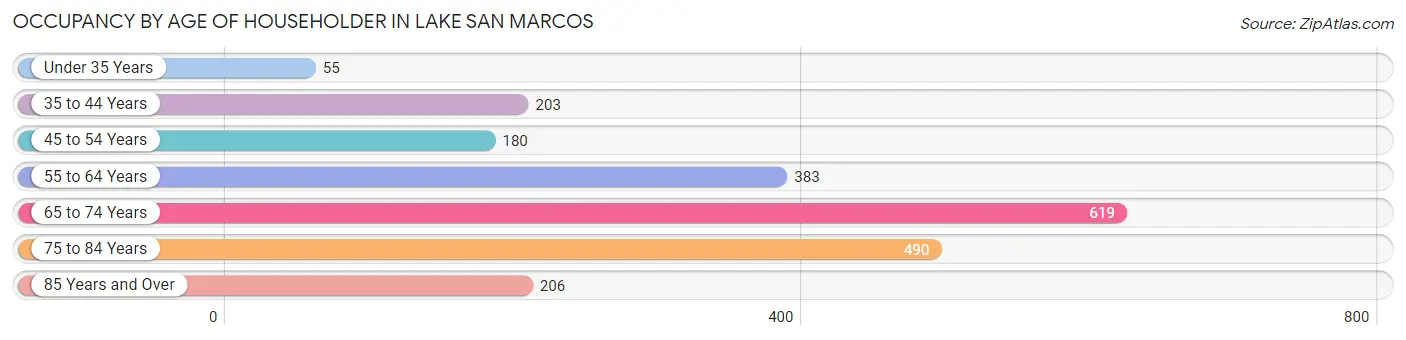
| Age Bracket | # Households | % Households |
| Under 35 Years | 55 | 2.6% |
| 35 to 44 Years | 203 | 9.5% |
| 45 to 54 Years | 180 | 8.4% |
| 55 to 64 Years | 383 | 17.9% |
| 65 to 74 Years | 619 | 29.0% |
| 75 to 84 Years | 490 | 22.9% |
| 85 Years and Over | 206 | 9.6% |
| Total | 2,136 | 100.0% |
Housing Finances in Lake San Marcos
Median Income by Occupancy in Lake San Marcos
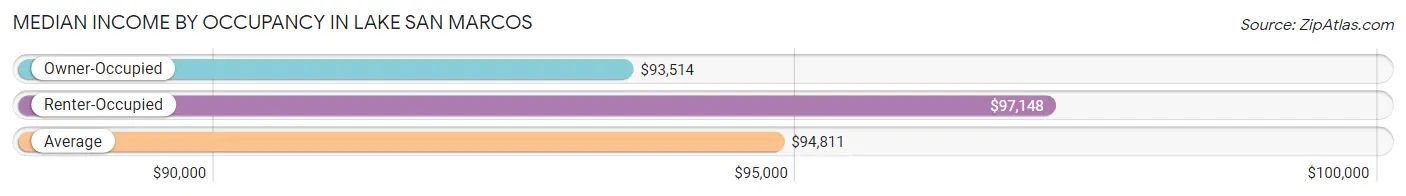
| Occupancy Type | # Households | Median Income |
| Owner-Occupied | 1,737 (81.3%) | $93,514 |
| Renter-Occupied | 399 (18.7%) | $97,148 |
| Average | 2,136 (100.0%) | $94,811 |
Occupancy by Householder Income Bracket in Lake San Marcos
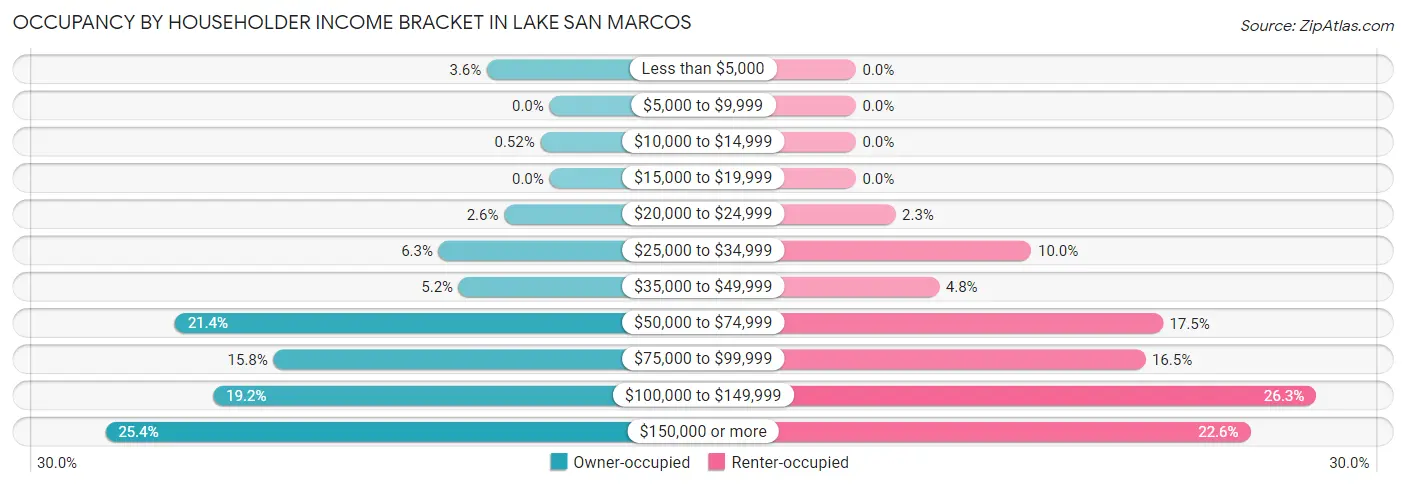
| Income Bracket | Owner-occupied | Renter-occupied |
| Less than $5,000 | 62 (3.6%) | 0 (0.0%) |
| $5,000 to $9,999 | 0 (0.0%) | 0 (0.0%) |
| $10,000 to $14,999 | 9 (0.5%) | 0 (0.0%) |
| $15,000 to $19,999 | 0 (0.0%) | 0 (0.0%) |
| $20,000 to $24,999 | 45 (2.6%) | 9 (2.3%) |
| $25,000 to $34,999 | 110 (6.3%) | 40 (10.0%) |
| $35,000 to $49,999 | 90 (5.2%) | 19 (4.8%) |
| $50,000 to $74,999 | 372 (21.4%) | 70 (17.5%) |
| $75,000 to $99,999 | 274 (15.8%) | 66 (16.5%) |
| $100,000 to $149,999 | 334 (19.2%) | 105 (26.3%) |
| $150,000 or more | 441 (25.4%) | 90 (22.6%) |
| Total | 1,737 (100.0%) | 399 (100.0%) |
Monthly Housing Cost Tiers in Lake San Marcos
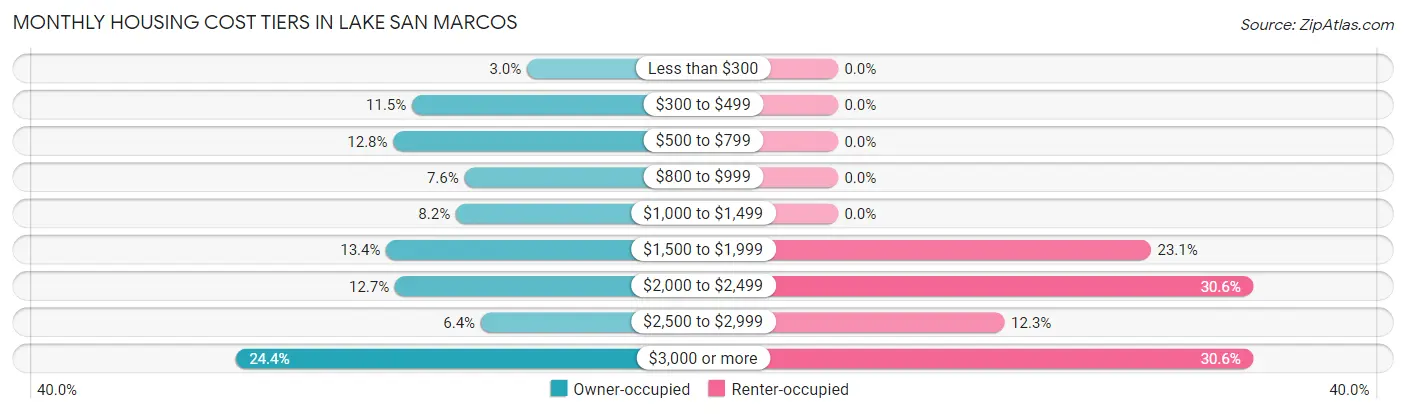
| Monthly Cost | Owner-occupied | Renter-occupied |
| Less than $300 | 52 (3.0%) | 0 (0.0%) |
| $300 to $499 | 199 (11.5%) | 0 (0.0%) |
| $500 to $799 | 223 (12.8%) | 0 (0.0%) |
| $800 to $999 | 132 (7.6%) | 0 (0.0%) |
| $1,000 to $1,499 | 143 (8.2%) | 0 (0.0%) |
| $1,500 to $1,999 | 232 (13.4%) | 92 (23.1%) |
| $2,000 to $2,499 | 221 (12.7%) | 122 (30.6%) |
| $2,500 to $2,999 | 111 (6.4%) | 49 (12.3%) |
| $3,000 or more | 424 (24.4%) | 122 (30.6%) |
| Total | 1,737 (100.0%) | 399 (100.0%) |
Physical Housing Characteristics in Lake San Marcos
Housing Structures in Lake San Marcos
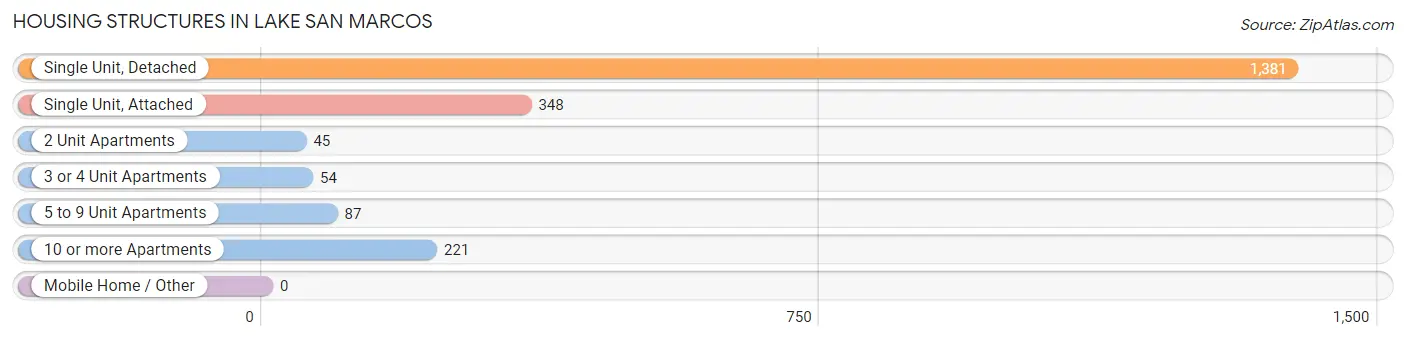
| Structure Type | # Housing Units | % Housing Units |
| Single Unit, Detached | 1,381 | 64.6% |
| Single Unit, Attached | 348 | 16.3% |
| 2 Unit Apartments | 45 | 2.1% |
| 3 or 4 Unit Apartments | 54 | 2.5% |
| 5 to 9 Unit Apartments | 87 | 4.1% |
| 10 or more Apartments | 221 | 10.3% |
| Mobile Home / Other | 0 | 0.0% |
| Total | 2,136 | 100.0% |
Housing Structures by Occupancy in Lake San Marcos
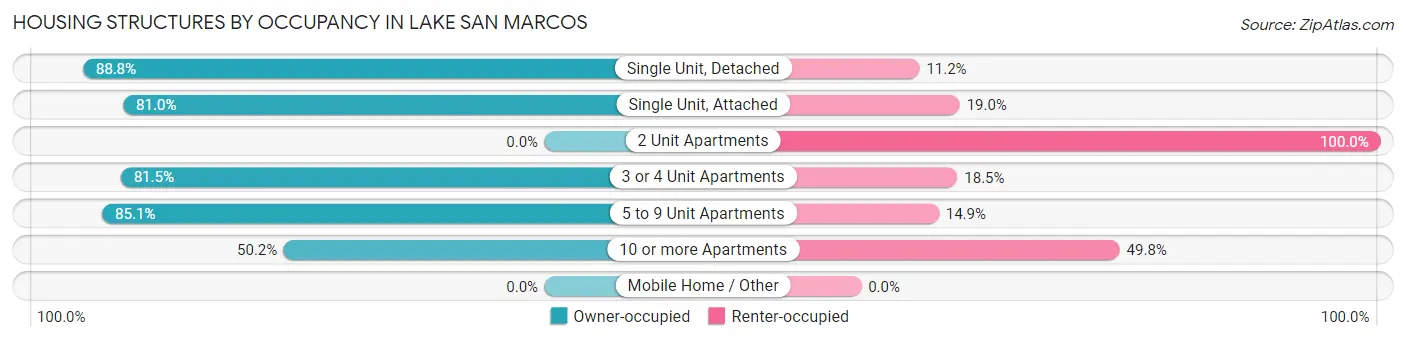
| Structure Type | Owner-occupied | Renter-occupied |
| Single Unit, Detached | 1,226 (88.8%) | 155 (11.2%) |
| Single Unit, Attached | 282 (81.0%) | 66 (19.0%) |
| 2 Unit Apartments | 0 (0.0%) | 45 (100.0%) |
| 3 or 4 Unit Apartments | 44 (81.5%) | 10 (18.5%) |
| 5 to 9 Unit Apartments | 74 (85.1%) | 13 (14.9%) |
| 10 or more Apartments | 111 (50.2%) | 110 (49.8%) |
| Mobile Home / Other | 0 (0.0%) | 0 (0.0%) |
| Total | 1,737 (81.3%) | 399 (18.7%) |
Housing Structures by Number of Rooms in Lake San Marcos
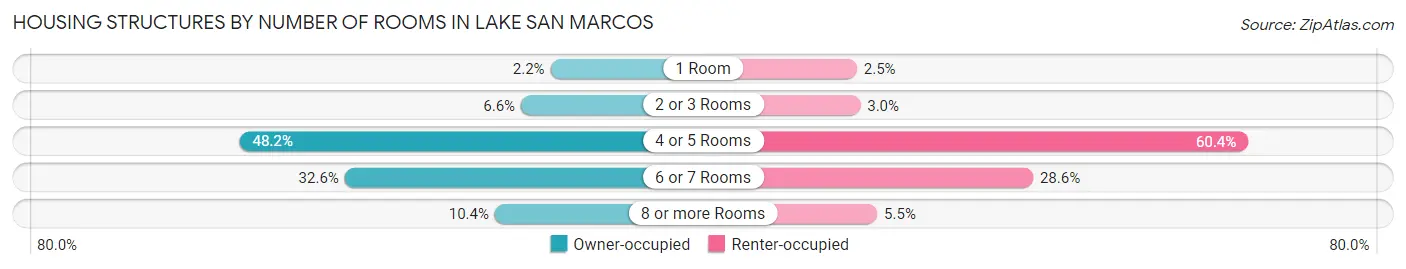
| Number of Rooms | Owner-occupied | Renter-occupied |
| 1 Room | 38 (2.2%) | 10 (2.5%) |
| 2 or 3 Rooms | 114 (6.6%) | 12 (3.0%) |
| 4 or 5 Rooms | 837 (48.2%) | 241 (60.4%) |
| 6 or 7 Rooms | 567 (32.6%) | 114 (28.6%) |
| 8 or more Rooms | 181 (10.4%) | 22 (5.5%) |
| Total | 1,737 (100.0%) | 399 (100.0%) |
Housing Structure by Heating Type in Lake San Marcos
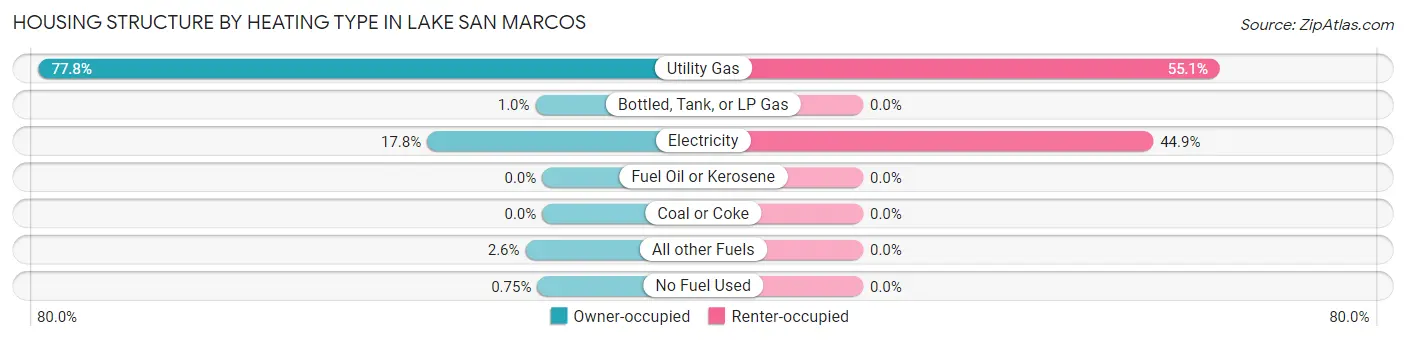
| Heating Type | Owner-occupied | Renter-occupied |
| Utility Gas | 1,352 (77.8%) | 220 (55.1%) |
| Bottled, Tank, or LP Gas | 18 (1.0%) | 0 (0.0%) |
| Electricity | 309 (17.8%) | 179 (44.9%) |
| Fuel Oil or Kerosene | 0 (0.0%) | 0 (0.0%) |
| Coal or Coke | 0 (0.0%) | 0 (0.0%) |
| All other Fuels | 45 (2.6%) | 0 (0.0%) |
| No Fuel Used | 13 (0.7%) | 0 (0.0%) |
| Total | 1,737 (100.0%) | 399 (100.0%) |
Household Vehicle Usage in Lake San Marcos
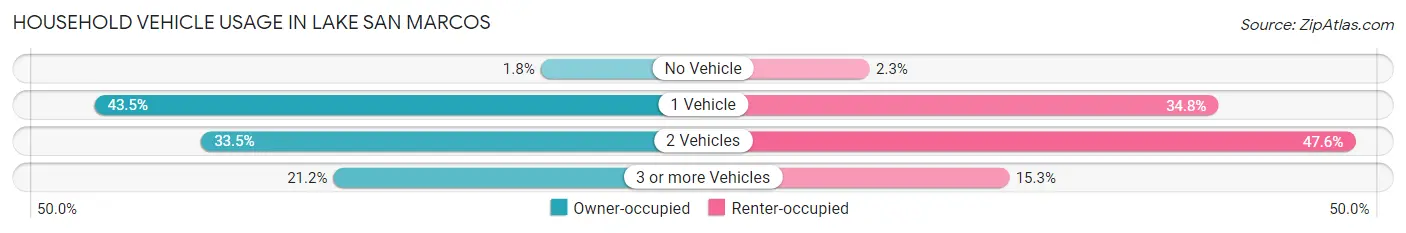
| Vehicles per Household | Owner-occupied | Renter-occupied |
| No Vehicle | 32 (1.8%) | 9 (2.3%) |
| 1 Vehicle | 755 (43.5%) | 139 (34.8%) |
| 2 Vehicles | 582 (33.5%) | 190 (47.6%) |
| 3 or more Vehicles | 368 (21.2%) | 61 (15.3%) |
| Total | 1,737 (100.0%) | 399 (100.0%) |
Real Estate & Mortgages in Lake San Marcos
Real Estate and Mortgage Overview in Lake San Marcos
| Characteristic | Without Mortgage | With Mortgage |
| Housing Units | 780 | 957 |
| Median Property Value | $650,700 | $791,900 |
| Median Household Income | $80,858 | $271 |
| Monthly Housing Costs | $714 | $379 |
| Real Estate Taxes | $3,353 | $0 |
Property Value by Mortgage Status in Lake San Marcos
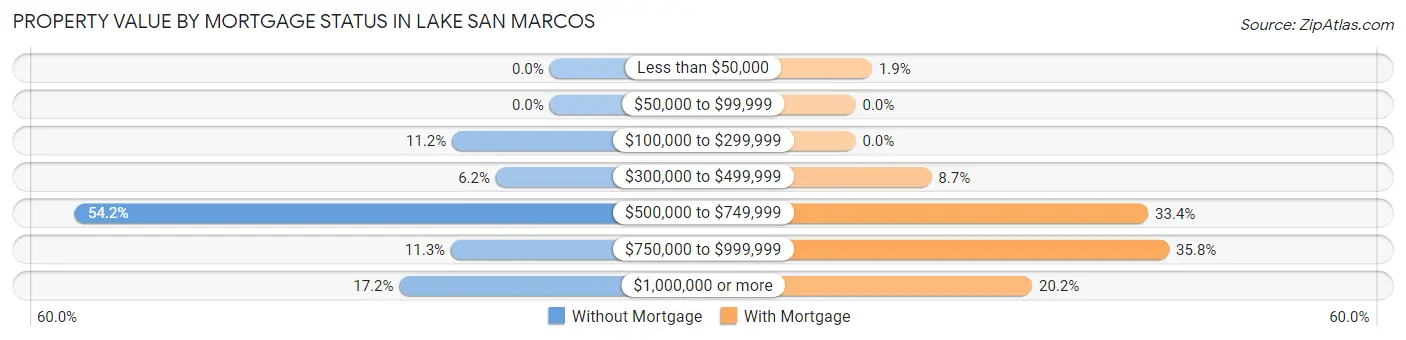
| Property Value | Without Mortgage | With Mortgage |
| Less than $50,000 | 0 (0.0%) | 18 (1.9%) |
| $50,000 to $99,999 | 0 (0.0%) | 0 (0.0%) |
| $100,000 to $299,999 | 87 (11.2%) | 0 (0.0%) |
| $300,000 to $499,999 | 48 (6.1%) | 83 (8.7%) |
| $500,000 to $749,999 | 423 (54.2%) | 320 (33.4%) |
| $750,000 to $999,999 | 88 (11.3%) | 343 (35.8%) |
| $1,000,000 or more | 134 (17.2%) | 193 (20.2%) |
| Total | 780 (100.0%) | 957 (100.0%) |
Household Income by Mortgage Status in Lake San Marcos
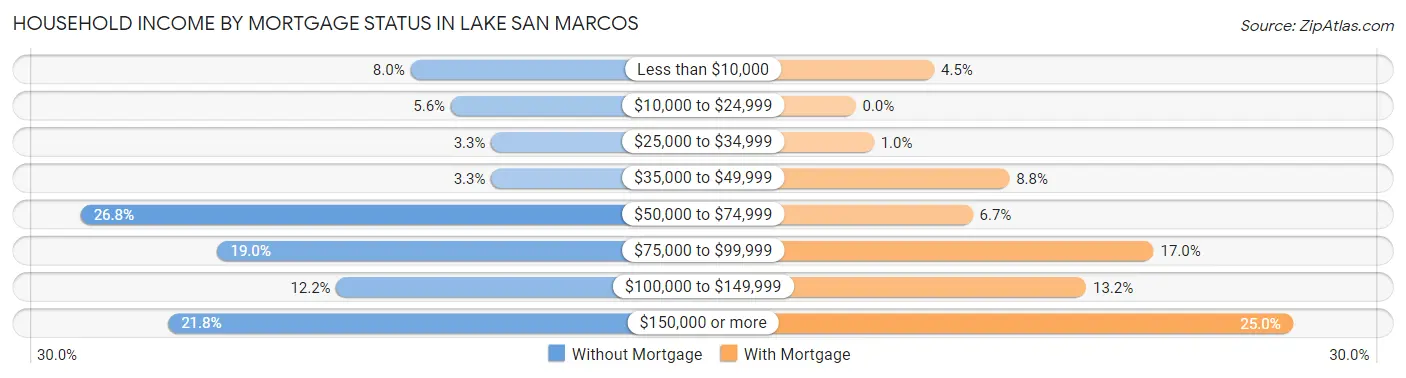
| Household Income | Without Mortgage | With Mortgage |
| Less than $10,000 | 62 (8.0%) | 43 (4.5%) |
| $10,000 to $24,999 | 44 (5.6%) | 0 (0.0%) |
| $25,000 to $34,999 | 26 (3.3%) | 10 (1.0%) |
| $35,000 to $49,999 | 26 (3.3%) | 84 (8.8%) |
| $50,000 to $74,999 | 209 (26.8%) | 64 (6.7%) |
| $75,000 to $99,999 | 148 (19.0%) | 163 (17.0%) |
| $100,000 to $149,999 | 95 (12.2%) | 126 (13.2%) |
| $150,000 or more | 170 (21.8%) | 239 (25.0%) |
| Total | 780 (100.0%) | 957 (100.0%) |
Property Value to Household Income Ratio in Lake San Marcos
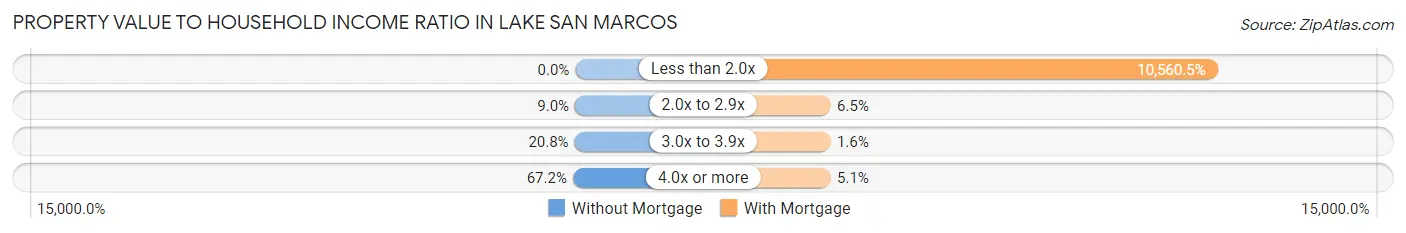
| Value-to-Income Ratio | Without Mortgage | With Mortgage |
| Less than 2.0x | 0 (0.0%) | 101,064 (10,560.5%) |
| 2.0x to 2.9x | 70 (9.0%) | 62 (6.5%) |
| 3.0x to 3.9x | 162 (20.8%) | 15 (1.6%) |
| 4.0x or more | 524 (67.2%) | 49 (5.1%) |
| Total | 780 (100.0%) | 957 (100.0%) |
Real Estate Taxes by Mortgage Status in Lake San Marcos
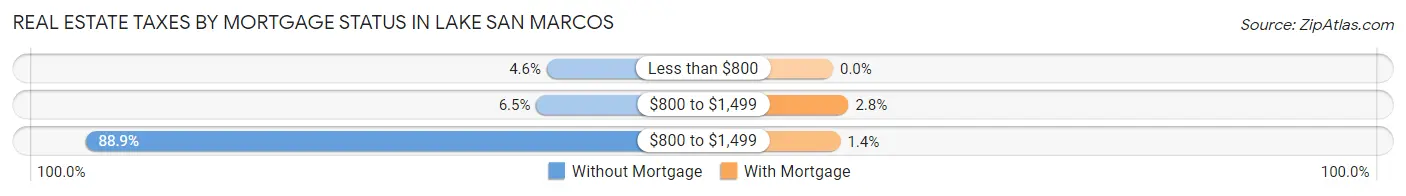
| Property Taxes | Without Mortgage | With Mortgage |
| Less than $800 | 36 (4.6%) | 0 (0.0%) |
| $800 to $1,499 | 51 (6.5%) | 27 (2.8%) |
| $800 to $1,499 | 693 (88.8%) | 13 (1.4%) |
| Total | 780 (100.0%) | 957 (100.0%) |
Health & Disability in Lake San Marcos
Health Insurance Coverage by Age in Lake San Marcos
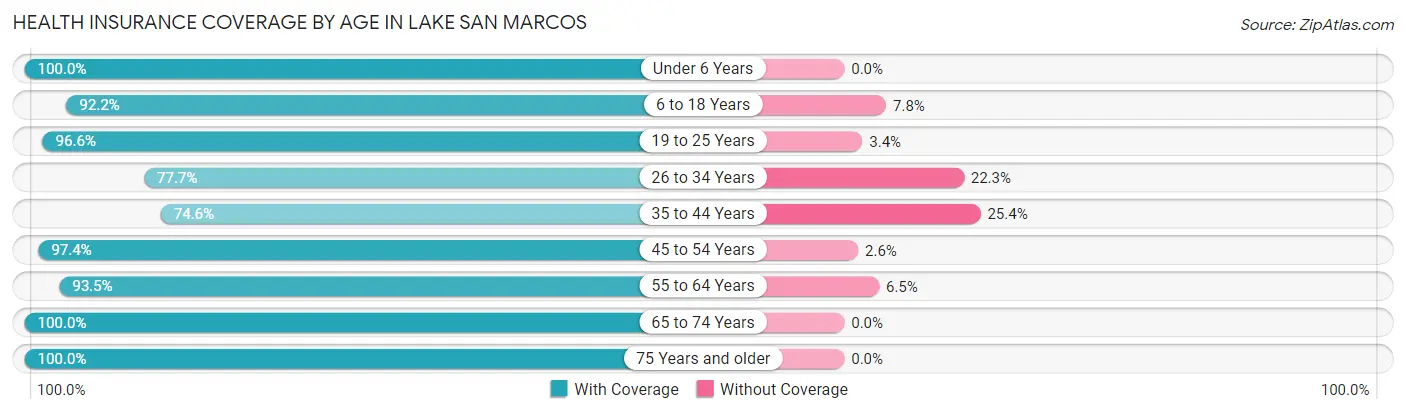
| Age Bracket | With Coverage | Without Coverage |
| Under 6 Years | 94 (100.0%) | 0 (0.0%) |
| 6 to 18 Years | 260 (92.2%) | 22 (7.8%) |
| 19 to 25 Years | 172 (96.6%) | 6 (3.4%) |
| 26 to 34 Years | 129 (77.7%) | 37 (22.3%) |
| 35 to 44 Years | 232 (74.6%) | 79 (25.4%) |
| 45 to 54 Years | 378 (97.4%) | 10 (2.6%) |
| 55 to 64 Years | 592 (93.5%) | 41 (6.5%) |
| 65 to 74 Years | 1,001 (100.0%) | 0 (0.0%) |
| 75 Years and older | 976 (100.0%) | 0 (0.0%) |
| Total | 3,834 (95.2%) | 195 (4.8%) |
Health Insurance Coverage by Citizenship Status in Lake San Marcos
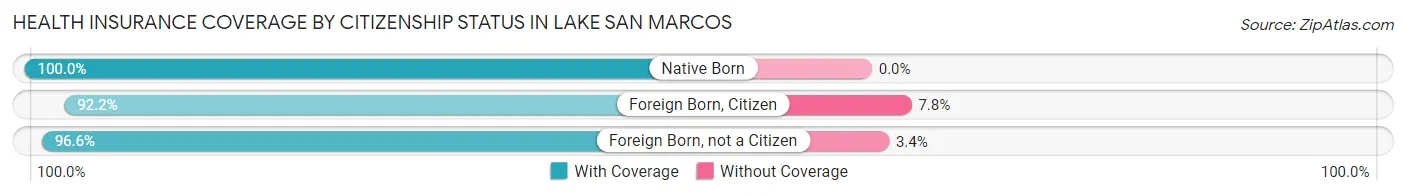
| Citizenship Status | With Coverage | Without Coverage |
| Native Born | 94 (100.0%) | 0 (0.0%) |
| Foreign Born, Citizen | 260 (92.2%) | 22 (7.8%) |
| Foreign Born, not a Citizen | 172 (96.6%) | 6 (3.4%) |
Health Insurance Coverage by Household Income in Lake San Marcos
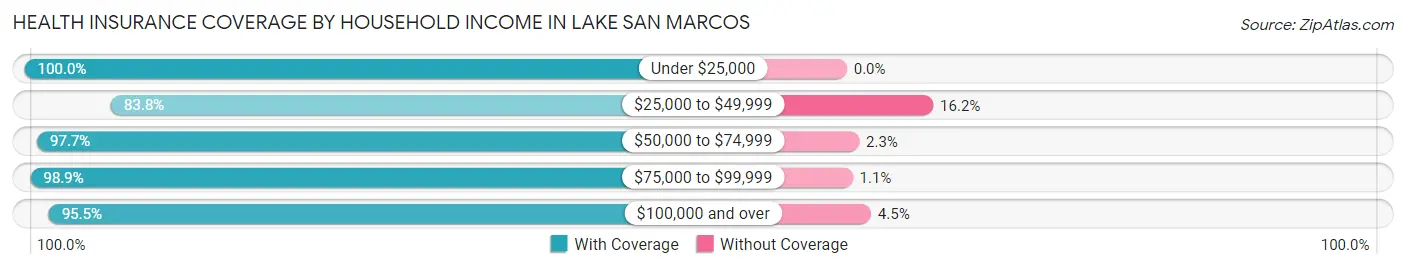
| Household Income | With Coverage | Without Coverage |
| Under $25,000 | 135 (100.0%) | 0 (0.0%) |
| $25,000 to $49,999 | 404 (83.8%) | 78 (16.2%) |
| $50,000 to $74,999 | 802 (97.7%) | 19 (2.3%) |
| $75,000 to $99,999 | 550 (98.9%) | 6 (1.1%) |
| $100,000 and over | 1,943 (95.5%) | 92 (4.5%) |
Public vs Private Health Insurance Coverage by Age in Lake San Marcos
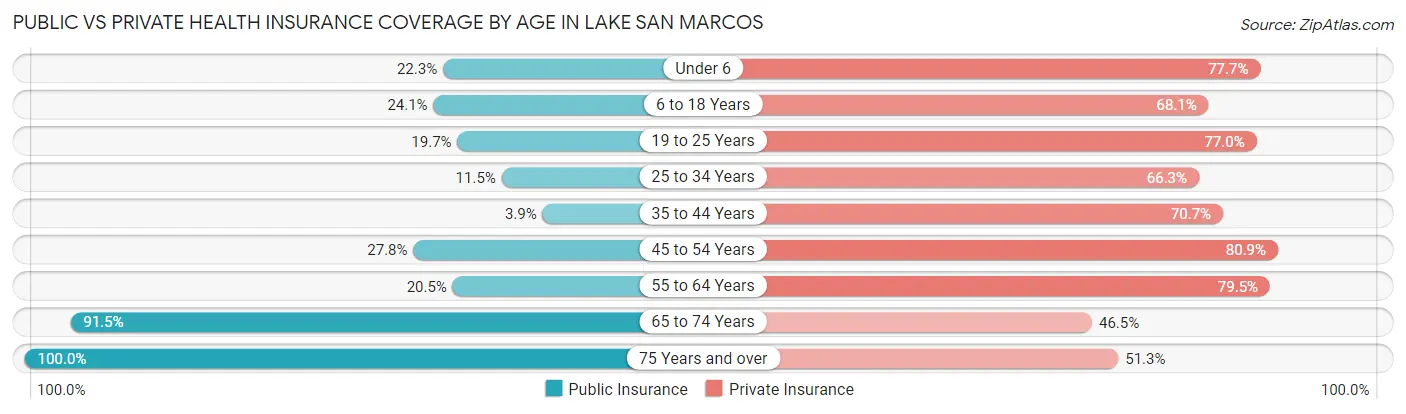
| Age Bracket | Public Insurance | Private Insurance |
| Under 6 | 21 (22.3%) | 73 (77.7%) |
| 6 to 18 Years | 68 (24.1%) | 192 (68.1%) |
| 19 to 25 Years | 35 (19.7%) | 137 (77.0%) |
| 25 to 34 Years | 19 (11.5%) | 110 (66.3%) |
| 35 to 44 Years | 12 (3.9%) | 220 (70.7%) |
| 45 to 54 Years | 108 (27.8%) | 314 (80.9%) |
| 55 to 64 Years | 130 (20.5%) | 503 (79.5%) |
| 65 to 74 Years | 916 (91.5%) | 465 (46.5%) |
| 75 Years and over | 976 (100.0%) | 501 (51.3%) |
| Total | 2,285 (56.7%) | 2,515 (62.4%) |
Disability Status by Sex by Age in Lake San Marcos
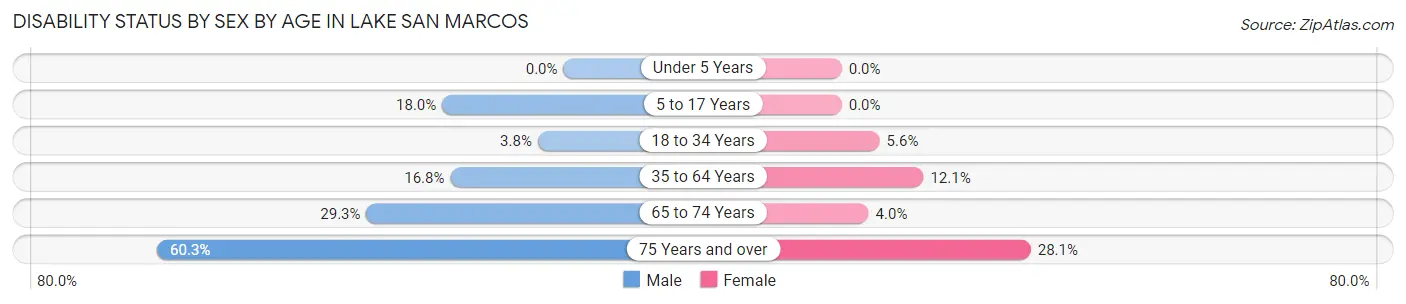
| Age Bracket | Male | Female |
| Under 5 Years | 0 (0.0%) | 0 (0.0%) |
| 5 to 17 Years | 36 (18.0%) | 0 (0.0%) |
| 18 to 34 Years | 7 (3.8%) | 9 (5.6%) |
| 35 to 64 Years | 117 (16.8%) | 77 (12.1%) |
| 65 to 74 Years | 117 (29.2%) | 24 (4.0%) |
| 75 Years and over | 219 (60.3%) | 172 (28.1%) |
Disability Class by Sex by Age in Lake San Marcos
Disability Class: Hearing Difficulty
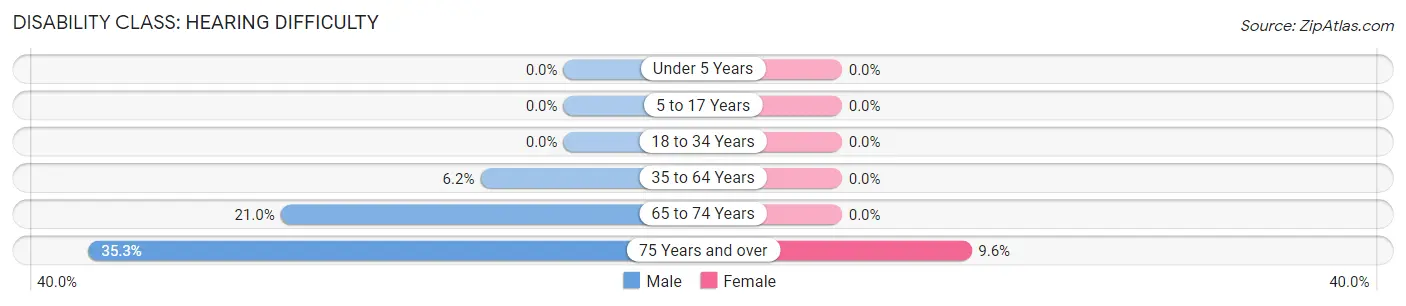
| Age Bracket | Male | Female |
| Under 5 Years | 0 (0.0%) | 0 (0.0%) |
| 5 to 17 Years | 0 (0.0%) | 0 (0.0%) |
| 18 to 34 Years | 0 (0.0%) | 0 (0.0%) |
| 35 to 64 Years | 43 (6.2%) | 0 (0.0%) |
| 65 to 74 Years | 84 (21.0%) | 0 (0.0%) |
| 75 Years and over | 128 (35.3%) | 59 (9.6%) |
Disability Class: Vision Difficulty
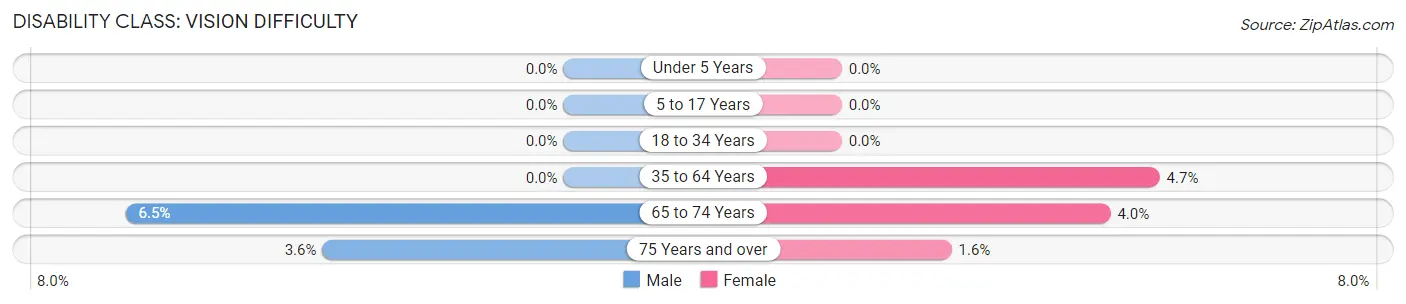
| Age Bracket | Male | Female |
| Under 5 Years | 0 (0.0%) | 0 (0.0%) |
| 5 to 17 Years | 0 (0.0%) | 0 (0.0%) |
| 18 to 34 Years | 0 (0.0%) | 0 (0.0%) |
| 35 to 64 Years | 0 (0.0%) | 30 (4.7%) |
| 65 to 74 Years | 26 (6.5%) | 24 (4.0%) |
| 75 Years and over | 13 (3.6%) | 10 (1.6%) |
Disability Class: Cognitive Difficulty
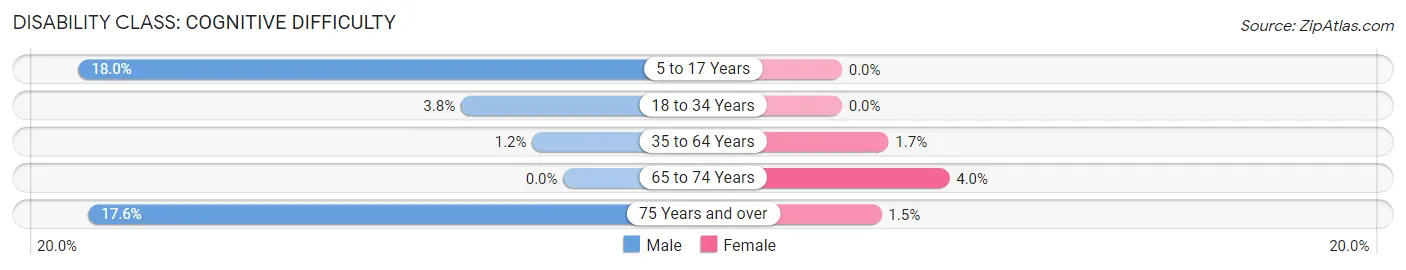
| Age Bracket | Male | Female |
| 5 to 17 Years | 36 (18.0%) | 0 (0.0%) |
| 18 to 34 Years | 7 (3.8%) | 0 (0.0%) |
| 35 to 64 Years | 8 (1.1%) | 11 (1.7%) |
| 65 to 74 Years | 0 (0.0%) | 24 (4.0%) |
| 75 Years and over | 64 (17.6%) | 9 (1.5%) |
Disability Class: Ambulatory Difficulty
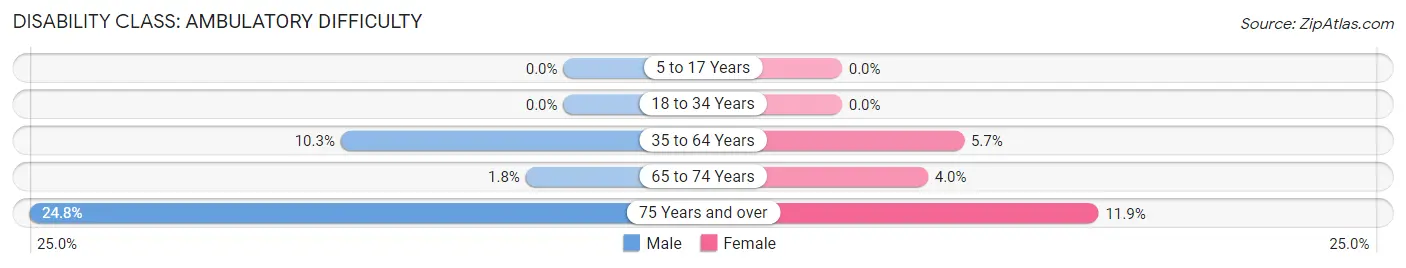
| Age Bracket | Male | Female |
| 5 to 17 Years | 0 (0.0%) | 0 (0.0%) |
| 18 to 34 Years | 0 (0.0%) | 0 (0.0%) |
| 35 to 64 Years | 72 (10.3%) | 36 (5.7%) |
| 65 to 74 Years | 7 (1.8%) | 24 (4.0%) |
| 75 Years and over | 90 (24.8%) | 73 (11.9%) |
Disability Class: Self-Care Difficulty
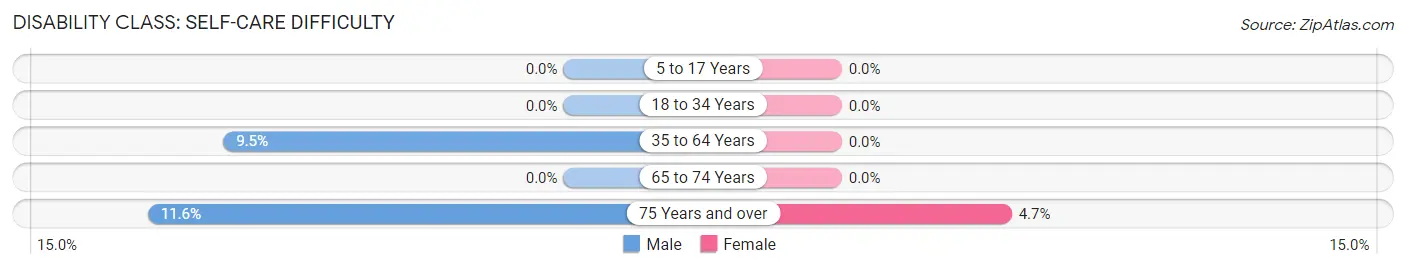
| Age Bracket | Male | Female |
| 5 to 17 Years | 0 (0.0%) | 0 (0.0%) |
| 18 to 34 Years | 0 (0.0%) | 0 (0.0%) |
| 35 to 64 Years | 66 (9.5%) | 0 (0.0%) |
| 65 to 74 Years | 0 (0.0%) | 0 (0.0%) |
| 75 Years and over | 42 (11.6%) | 29 (4.7%) |
Technology Access in Lake San Marcos
Computing Device Access in Lake San Marcos
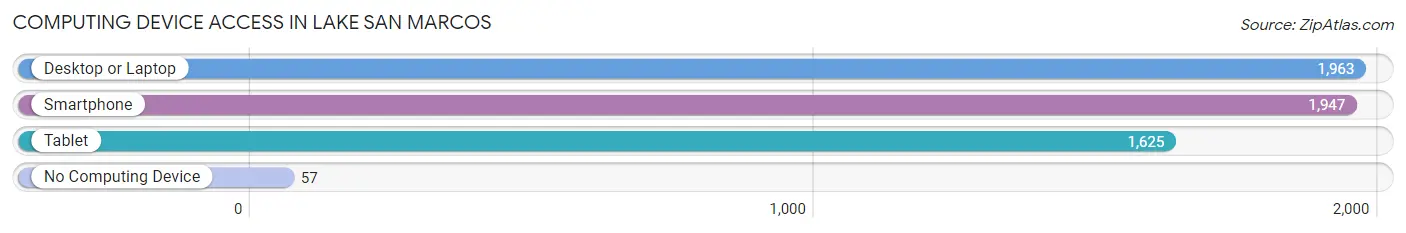
| Device Type | # Households | % Households |
| Desktop or Laptop | 1,963 | 91.9% |
| Smartphone | 1,947 | 91.1% |
| Tablet | 1,625 | 76.1% |
| No Computing Device | 57 | 2.7% |
| Total | 2,136 | 100.0% |
Internet Access in Lake San Marcos
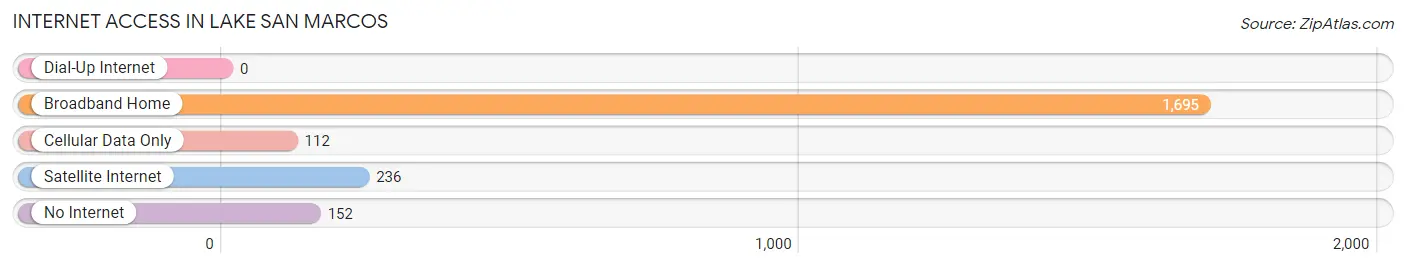
| Internet Type | # Households | % Households |
| Dial-Up Internet | 0 | 0.0% |
| Broadband Home | 1,695 | 79.3% |
| Cellular Data Only | 112 | 5.2% |
| Satellite Internet | 236 | 11.1% |
| No Internet | 152 | 7.1% |
| Total | 2,136 | 100.0% |
Lake San Marcos Summary
Lake San Marcos is a census-designated place located in San Diego County, California. It is situated in the San Marcos Valley, and is bordered by the cities of San Marcos and Carlsbad. The population of Lake San Marcos was 5,527 at the 2010 census.
History
The area now known as Lake San Marcos was originally inhabited by the Luiseño people, who were part of the larger Kumeyaay Nation. The area was first explored by Europeans in 1769, when the Spanish Portolá expedition passed through the area. The area was later settled by Spanish missionaries and ranchers in the late 18th century.
In the early 20th century, the area was developed as a resort community. The Lake San Marcos Resort was built in 1926, and the lake itself was created in 1928. The lake was created by damming San Marcos Creek, and was originally used for recreational activities such as fishing and boating.
In the 1950s, the area was developed as a residential community. The Lake San Marcos Country Club was established in 1959, and the Lake San Marcos Village shopping center was built in the 1960s.
Geography
Lake San Marcos is located at 33°9'25"N 117°13'25"W (33.156944, -117.223611). It is situated in the San Marcos Valley, and is bordered by the cities of San Marcos and Carlsbad. The lake itself is located in the center of the community, and is surrounded by residential neighborhoods.
The area has a Mediterranean climate, with mild winters and hot, dry summers. The average annual temperature is 64°F (18°C), and the average annual precipitation is 11.5 inches (292 mm).
Economy
The economy of Lake San Marcos is largely based on tourism and retirement. The Lake San Marcos Resort is a popular destination for tourists, and the area is also home to several retirement communities.
The area is also home to several businesses, including restaurants, retail stores, and professional services. The Lake San Marcos Village shopping center is a popular destination for locals and visitors alike.
Demographics
As of the 2010 census, the population of Lake San Marcos was 5,527. The racial makeup of the community was 79.2% White, 8.2% Asian, 6.2% Hispanic or Latino, and 4.3% African American.
The median household income in Lake San Marcos was $77,845, and the median family income was $90,945. The per capita income was $37,845.
Conclusion
Lake San Marcos is a census-designated place located in San Diego County, California. It is situated in the San Marcos Valley, and is bordered by the cities of San Marcos and Carlsbad. The area was originally inhabited by the Luiseño people, and was later developed as a resort community in the early 20th century. The economy of Lake San Marcos is largely based on tourism and retirement, and the population of the community was 5,527 at the 2010 census.
Common Questions
What is Per Capita Income in Lake San Marcos?
Per Capita income in Lake San Marcos is $64,055.
What is the Median Family Income in Lake San Marcos?
Median Family Income in Lake San Marcos is $102,297.
What is the Median Household income in Lake San Marcos?
Median Household Income in Lake San Marcos is $94,811.
What is Income or Wage Gap in Lake San Marcos?
Income or Wage Gap in Lake San Marcos is 43.9%.
Women in Lake San Marcos earn 56.1 cents for every dollar earned by a man.
What is Inequality or Gini Index in Lake San Marcos?
Inequality or Gini Index in Lake San Marcos is 0.40.
What is the Total Population of Lake San Marcos?
Total Population of Lake San Marcos is 4,080.
What is the Total Male Population of Lake San Marcos?
Total Male Population of Lake San Marcos is 1,930.
What is the Total Female Population of Lake San Marcos?
Total Female Population of Lake San Marcos is 2,150.
What is the Ratio of Males per 100 Females in Lake San Marcos?
There are 89.77 Males per 100 Females in Lake San Marcos.
What is the Ratio of Females per 100 Males in Lake San Marcos?
There are 111.40 Females per 100 Males in Lake San Marcos.
What is the Median Population Age in Lake San Marcos?
Median Population Age in Lake San Marcos is 64.5 Years.
What is the Average Family Size in Lake San Marcos
Average Family Size in Lake San Marcos is 2.4 People.
What is the Average Household Size in Lake San Marcos
Average Household Size in Lake San Marcos is 1.9 People.
How Large is the Labor Force in Lake San Marcos?
There are 1,800 People in the Labor Forcein in Lake San Marcos.
What is the Percentage of People in the Labor Force in Lake San Marcos?
47.7% of People are in the Labor Force in Lake San Marcos.
What is the Unemployment Rate in Lake San Marcos?
Unemployment Rate in Lake San Marcos is 4.5%.