Cities with the Highest Percentage of Population Employed in Real Estate, Rental & Leasing in New York
RELATED REPORTS & OPTIONS
Real Estate, Rental & Leasing
New York
Compare Cities
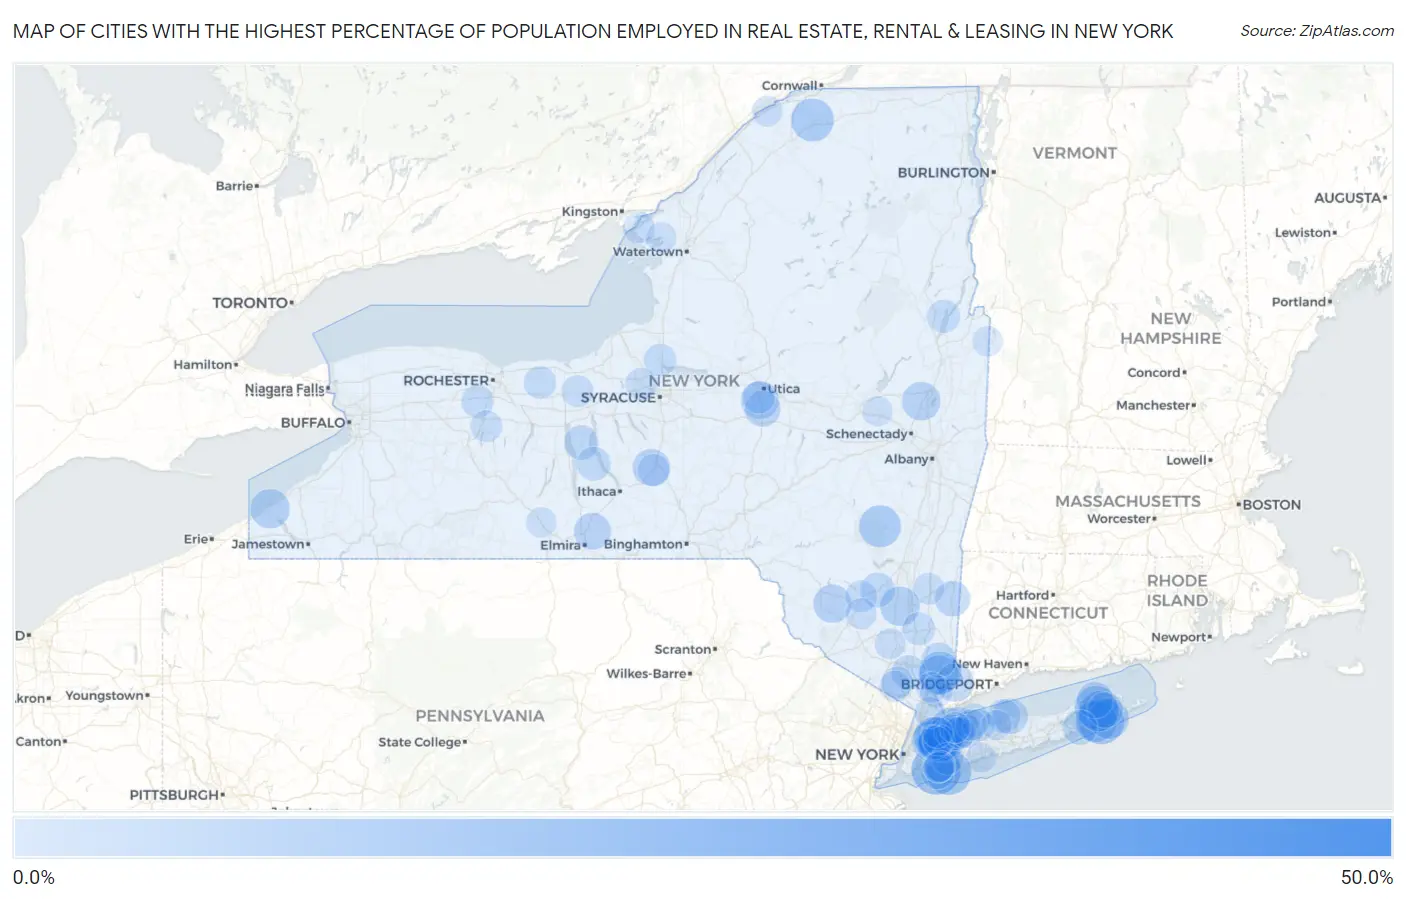
Map of Cities with the Highest Percentage of Population Employed in Real Estate, Rental & Leasing in New York
0.0%
50.0%
Cities with the Highest Percentage of Population Employed in Real Estate, Rental & Leasing in New York
| City | % Employed | vs State | vs National | |
| 1. | Wells Bridge | 41.5% | 2.2%(+39.3)#1 | 1.9%(+39.6)#36 |
| 2. | Oak Beach | 34.8% | 2.2%(+32.6)#2 | 1.9%(+32.9)#54 |
| 3. | Eldred | 28.7% | 2.2%(+26.5)#3 | 1.9%(+26.8)#73 |
| 4. | Slaterville Springs | 19.6% | 2.2%(+17.3)#4 | 1.9%(+17.7)#154 |
| 5. | Lawrence | 18.1% | 2.2%(+15.9)#5 | 1.9%(+16.2)#180 |
| 6. | Sagaponack | 15.7% | 2.2%(+13.5)#6 | 1.9%(+13.9)#224 |
| 7. | Plandome Manor | 15.4% | 2.2%(+13.2)#7 | 1.9%(+13.5)#236 |
| 8. | Lido Beach | 15.0% | 2.2%(+12.8)#8 | 1.9%(+13.1)#247 |
| 9. | Wassaic | 14.0% | 2.2%(+11.7)#9 | 1.9%(+12.1)#280 |
| 10. | North Haven | 13.8% | 2.2%(+11.6)#10 | 1.9%(+11.9)#283 |
| 11. | Winthrop | 13.6% | 2.2%(+11.4)#11 | 1.9%(+11.7)#295 |
| 12. | Hunter | 13.0% | 2.2%(+10.8)#12 | 1.9%(+11.1)#315 |
| 13. | Katonah | 12.9% | 2.2%(+10.7)#13 | 1.9%(+11.0)#323 |
| 14. | Bridgehampton | 12.9% | 2.2%(+10.6)#14 | 1.9%(+11.0)#325 |
| 15. | Saddle Rock | 12.7% | 2.2%(+10.4)#15 | 1.9%(+10.8)#336 |
| 16. | Kings Point | 12.0% | 2.2%(+9.76)#16 | 1.9%(+10.1)#376 |
| 17. | East Hampton | 11.9% | 2.2%(+9.69)#17 | 1.9%(+10.0)#382 |
| 18. | Sag Harbor | 11.9% | 2.2%(+9.64)#18 | 1.9%(+9.97)#384 |
| 19. | Bedford Hills | 11.3% | 2.2%(+9.04)#19 | 1.9%(+9.38)#427 |
| 20. | Clintondale | 11.3% | 2.2%(+9.03)#20 | 1.9%(+9.36)#428 |
| 21. | Roslyn Estates | 11.2% | 2.2%(+8.97)#21 | 1.9%(+9.31)#429 |
| 22. | Westfield | 11.1% | 2.2%(+8.91)#22 | 1.9%(+9.24)#433 |
| 23. | North Ballston Spa | 10.6% | 2.2%(+8.35)#23 | 1.9%(+8.68)#481 |
| 24. | Barryville | 10.5% | 2.2%(+8.26)#24 | 1.9%(+8.60)#485 |
| 25. | Scotts Corners | 10.3% | 2.2%(+8.11)#25 | 1.9%(+8.44)#497 |
| 26. | South Fallsburg | 10.3% | 2.2%(+8.10)#26 | 1.9%(+8.43)#500 |
| 27. | Chadwicks | 10.3% | 2.2%(+8.07)#27 | 1.9%(+8.40)#503 |
| 28. | Glenwood Landing | 10.1% | 2.2%(+7.85)#28 | 1.9%(+8.18)#527 |
| 29. | Cortland West | 9.7% | 2.2%(+7.49)#29 | 1.9%(+7.83)#565 |
| 30. | Brooktondale | 9.6% | 2.2%(+7.40)#30 | 1.9%(+7.73)#576 |
| 31. | Breesport | 9.6% | 2.2%(+7.36)#31 | 1.9%(+7.70)#579 |
| 32. | Lattingtown | 9.1% | 2.2%(+6.91)#32 | 1.9%(+7.24)#628 |
| 33. | Shelter Island Heights | 9.1% | 2.2%(+6.89)#33 | 1.9%(+7.22)#633 |
| 34. | Roslyn Heights | 9.0% | 2.2%(+6.78)#34 | 1.9%(+7.12)#651 |
| 35. | North Hills | 8.9% | 2.2%(+6.67)#35 | 1.9%(+7.01)#662 |
| 36. | Centre Island | 8.9% | 2.2%(+6.66)#36 | 1.9%(+7.00)#663 |
| 37. | Otter Lake | 8.9% | 2.2%(+6.66)#37 | 1.9%(+7.00)#665 |
| 38. | Clayville | 8.8% | 2.2%(+6.60)#38 | 1.9%(+6.93)#673 |
| 39. | Belle Terre | 8.6% | 2.2%(+6.38)#39 | 1.9%(+6.72)#705 |
| 40. | Dover Plains | 8.5% | 2.2%(+6.26)#40 | 1.9%(+6.60)#725 |
| 41. | Northwest Harbor | 8.4% | 2.2%(+6.22)#41 | 1.9%(+6.55)#736 |
| 42. | Heritage Hills | 8.2% | 2.2%(+5.96)#42 | 1.9%(+6.29)#786 |
| 43. | Russell Gardens | 8.2% | 2.2%(+5.94)#43 | 1.9%(+6.27)#790 |
| 44. | Shinnecock Hills | 8.1% | 2.2%(+5.92)#44 | 1.9%(+6.25)#795 |
| 45. | Harbor Hills | 8.1% | 2.2%(+5.89)#45 | 1.9%(+6.23)#802 |
| 46. | Accord | 8.0% | 2.2%(+5.77)#46 | 1.9%(+6.11)#827 |
| 47. | Verplanck | 7.9% | 2.2%(+5.69)#47 | 1.9%(+6.02)#840 |
| 48. | Romulus | 7.8% | 2.2%(+5.62)#48 | 1.9%(+5.95)#853 |
| 49. | Great Neck Estates | 7.6% | 2.2%(+5.33)#49 | 1.9%(+5.66)#915 |
| 50. | Interlaken | 7.5% | 2.2%(+5.31)#50 | 1.9%(+5.65)#922 |
| 51. | Old Field | 7.4% | 2.2%(+5.15)#51 | 1.9%(+5.49)#955 |
| 52. | Upper Brookville | 7.3% | 2.2%(+5.03)#52 | 1.9%(+5.36)#979 |
| 53. | Matinecock | 7.2% | 2.2%(+4.96)#53 | 1.9%(+5.29)#996 |
| 54. | Asharoken | 7.1% | 2.2%(+4.92)#54 | 1.9%(+5.25)#1,004 |
| 55. | East Atlantic Beach | 7.1% | 2.2%(+4.90)#55 | 1.9%(+5.24)#1,015 |
| 56. | Bolton Landing | 7.1% | 2.2%(+4.83)#56 | 1.9%(+5.16)#1,030 |
| 57. | East Norwich | 7.0% | 2.2%(+4.78)#57 | 1.9%(+5.11)#1,042 |
| 58. | Great Neck Plaza | 7.0% | 2.2%(+4.77)#58 | 1.9%(+5.11)#1,045 |
| 59. | Cold Spring Harbor | 7.0% | 2.2%(+4.77)#59 | 1.9%(+5.11)#1,048 |
| 60. | Merritt Park | 6.8% | 2.2%(+4.61)#60 | 1.9%(+4.95)#1,090 |
| 61. | Marion | 6.6% | 2.2%(+4.33)#61 | 1.9%(+4.67)#1,165 |
| 62. | Scottsville | 6.5% | 2.2%(+4.32)#62 | 1.9%(+4.65)#1,178 |
| 63. | Central Square | 6.5% | 2.2%(+4.28)#63 | 1.9%(+4.61)#1,187 |
| 64. | Munsons Corners | 6.5% | 2.2%(+4.25)#64 | 1.9%(+4.58)#1,200 |
| 65. | Hewlett Bay Park | 6.3% | 2.2%(+4.08)#65 | 1.9%(+4.41)#1,250 |
| 66. | Washington Mills | 6.2% | 2.2%(+3.98)#66 | 1.9%(+4.31)#1,294 |
| 67. | Village Green | 6.2% | 2.2%(+3.93)#67 | 1.9%(+4.27)#1,312 |
| 68. | Northport | 6.2% | 2.2%(+3.93)#68 | 1.9%(+4.26)#1,314 |
| 69. | Armonk | 6.2% | 2.2%(+3.93)#69 | 1.9%(+4.26)#1,315 |
| 70. | South Hempstead | 6.1% | 2.2%(+3.88)#70 | 1.9%(+4.21)#1,334 |
| 71. | Clyde | 6.1% | 2.2%(+3.83)#71 | 1.9%(+4.16)#1,349 |
| 72. | South Lima | 6.0% | 2.2%(+3.82)#72 | 1.9%(+4.15)#1,351 |
| 73. | Pomona | 6.0% | 2.2%(+3.82)#73 | 1.9%(+4.15)#1,354 |
| 74. | Napanoch | 6.0% | 2.2%(+3.78)#74 | 1.9%(+4.11)#1,372 |
| 75. | Salt Point | 6.0% | 2.2%(+3.74)#75 | 1.9%(+4.08)#1,386 |
| 76. | Oyster Bay Cove | 6.0% | 2.2%(+3.73)#76 | 1.9%(+4.06)#1,397 |
| 77. | Cape Vincent | 5.9% | 2.2%(+3.68)#77 | 1.9%(+4.01)#1,415 |
| 78. | Newfield | 5.9% | 2.2%(+3.68)#78 | 1.9%(+4.01)#1,416 |
| 79. | Huntington Bay | 5.9% | 2.2%(+3.64)#79 | 1.9%(+3.98)#1,432 |
| 80. | Plandome | 5.8% | 2.2%(+3.61)#80 | 1.9%(+3.95)#1,441 |
| 81. | York | 5.7% | 2.2%(+3.49)#81 | 1.9%(+3.82)#1,493 |
| 82. | Walker Valley | 5.6% | 2.2%(+3.37)#82 | 1.9%(+3.70)#1,545 |
| 83. | Wesley Hills | 5.6% | 2.2%(+3.36)#83 | 1.9%(+3.70)#1,547 |
| 84. | Scarsdale | 5.5% | 2.2%(+3.29)#84 | 1.9%(+3.62)#1,584 |
| 85. | Mill Neck | 5.4% | 2.2%(+3.20)#85 | 1.9%(+3.53)#1,626 |
| 86. | Beaver Dam Lake | 5.4% | 2.2%(+3.19)#86 | 1.9%(+3.53)#1,628 |
| 87. | Waddington | 5.4% | 2.2%(+3.17)#87 | 1.9%(+3.51)#1,639 |
| 88. | Sands Point | 5.4% | 2.2%(+3.15)#88 | 1.9%(+3.49)#1,649 |
| 89. | Crest View Heights | 5.3% | 2.2%(+3.08)#89 | 1.9%(+3.42)#1,684 |
| 90. | Chappaqua | 5.3% | 2.2%(+3.07)#90 | 1.9%(+3.41)#1,688 |
| 91. | Granville | 5.2% | 2.2%(+2.94)#91 | 1.9%(+3.28)#1,768 |
| 92. | Chaumont | 5.2% | 2.2%(+2.94)#92 | 1.9%(+3.27)#1,771 |
| 93. | Campbell | 5.2% | 2.2%(+2.94)#93 | 1.9%(+3.27)#1,773 |
| 94. | Hewlett Harbor | 5.1% | 2.2%(+2.90)#94 | 1.9%(+3.23)#1,792 |
| 95. | Fort Johnson | 5.1% | 2.2%(+2.86)#95 | 1.9%(+3.19)#1,814 |
| 96. | Akwesasne | 5.0% | 2.2%(+2.82)#96 | 1.9%(+3.15)#1,838 |
| 97. | Babylon | 5.0% | 2.2%(+2.77)#97 | 1.9%(+3.11)#1,854 |
| 98. | Shorehaven | 5.0% | 2.2%(+2.77)#98 | 1.9%(+3.11)#1,858 |
| 99. | Hewlett Neck | 5.0% | 2.2%(+2.76)#99 | 1.9%(+3.09)#1,872 |
| 100. | Nissequogue | 5.0% | 2.2%(+2.74)#100 | 1.9%(+3.07)#1,881 |
Common Questions
What are the Top 10 Cities with the Highest Percentage of Population Employed in Real Estate, Rental & Leasing in New York?
Top 10 Cities with the Highest Percentage of Population Employed in Real Estate, Rental & Leasing in New York are:
#1
18.1%
#2
15.7%
#3
15.4%
#4
15.0%
#5
13.8%
#6
13.6%
#7
13.0%
#8
12.9%
#9
12.9%
#10
12.7%
What city has the Highest Percentage of Population Employed in Real Estate, Rental & Leasing in New York?
Lawrence has the Highest Percentage of Population Employed in Real Estate, Rental & Leasing in New York with 18.1%.
What is the Percentage of Population Employed in Real Estate, Rental & Leasing in the State of New York?
Percentage of Population Employed in Real Estate, Rental & Leasing in New York is 2.2%.
What is the Percentage of Population Employed in Real Estate, Rental & Leasing in the United States?
Percentage of Population Employed in Real Estate, Rental & Leasing in the United States is 1.9%.