Cities with the Highest Percentage of Population Employed in Real Estate, Rental & Leasing in West Virginia
RELATED REPORTS & OPTIONS
Real Estate, Rental & Leasing
West Virginia
Compare Cities
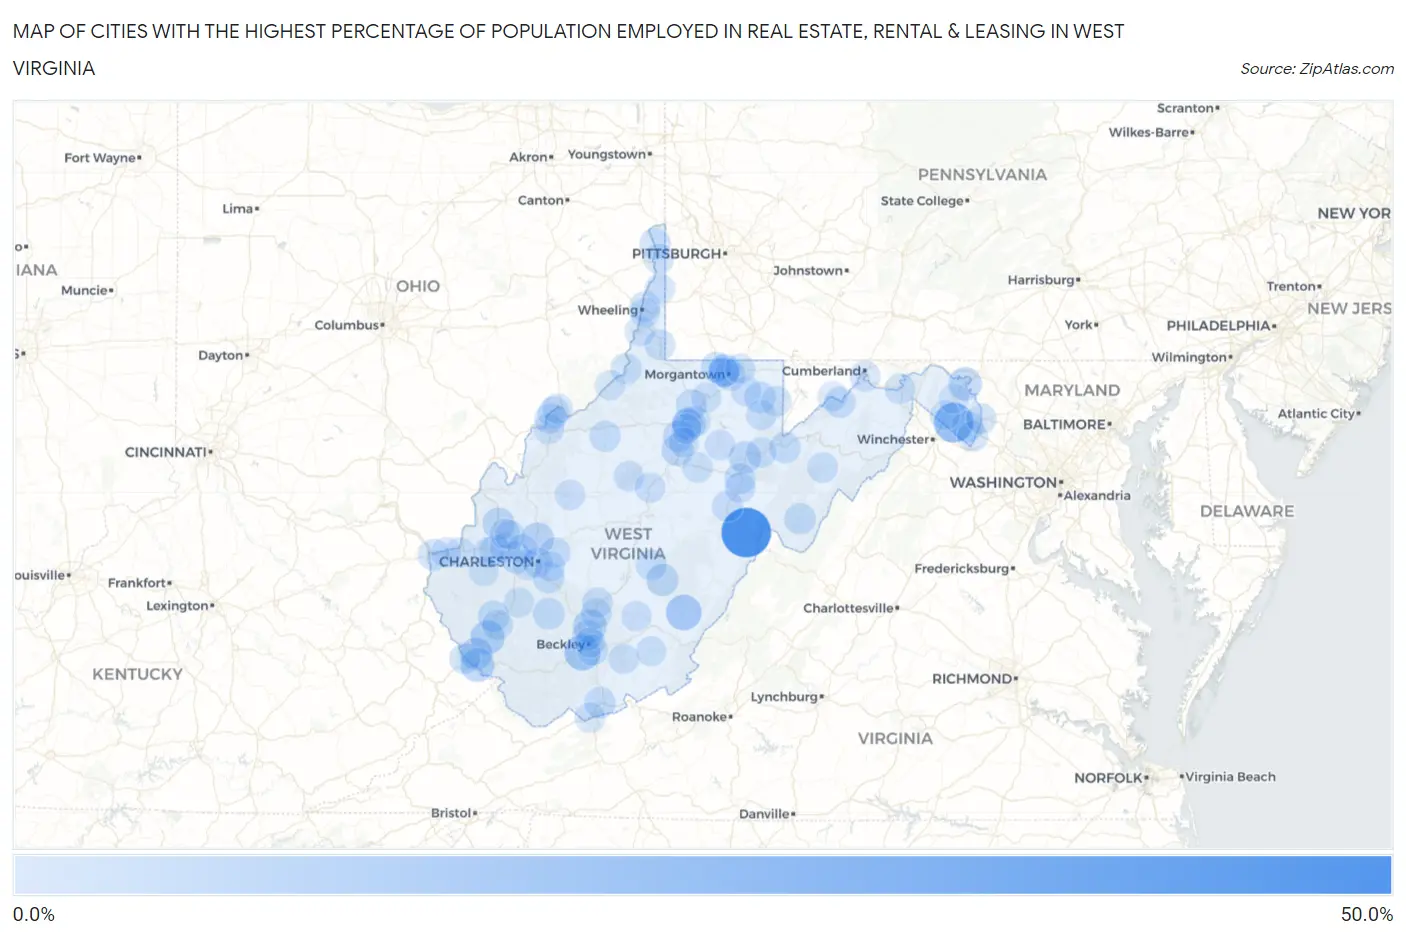
Map of Cities with the Highest Percentage of Population Employed in Real Estate, Rental & Leasing in West Virginia
0.0%
50.0%
Cities with the Highest Percentage of Population Employed in Real Estate, Rental & Leasing in West Virginia
| City | % Employed | vs State | vs National | |
| 1. | Frank | 42.6% | 1.1%(+41.5)#1 | 1.9%(+40.7)#34 |
| 2. | Middleway | 20.6% | 1.1%(+19.5)#2 | 1.9%(+18.7)#146 |
| 3. | Sophia | 12.9% | 1.1%(+11.8)#3 | 1.9%(+11.0)#319 |
| 4. | Falling Spring | 11.7% | 1.1%(+10.6)#4 | 1.9%(+9.77)#401 |
| 5. | Holden | 8.7% | 1.1%(+7.67)#5 | 1.9%(+6.85)#684 |
| 6. | Matewan | 8.3% | 1.1%(+7.26)#6 | 1.9%(+6.44)#752 |
| 7. | Mount Hope | 7.8% | 1.1%(+6.77)#7 | 1.9%(+5.95)#855 |
| 8. | Despard | 7.8% | 1.1%(+6.70)#8 | 1.9%(+5.88)#866 |
| 9. | Falling Waters | 7.0% | 1.1%(+5.93)#9 | 1.9%(+5.11)#1,043 |
| 10. | Delbarton | 6.0% | 1.1%(+4.97)#10 | 1.9%(+4.15)#1,356 |
| 11. | Sissonville | 6.0% | 1.1%(+4.93)#11 | 1.9%(+4.11)#1,371 |
| 12. | Montrose | 5.1% | 1.1%(+4.01)#12 | 1.9%(+3.19)#1,817 |
| 13. | Buffalo | 5.0% | 1.1%(+3.88)#13 | 1.9%(+3.06)#1,890 |
| 14. | Richwood | 4.7% | 1.1%(+3.60)#14 | 1.9%(+2.78)#2,079 |
| 15. | Jane Lew | 4.5% | 1.1%(+3.46)#15 | 1.9%(+2.64)#2,187 |
| 16. | Star City | 4.2% | 1.1%(+3.11)#16 | 1.9%(+2.29)#2,463 |
| 17. | St Albans | 4.1% | 1.1%(+2.99)#17 | 1.9%(+2.17)#2,596 |
| 18. | West Milford | 4.0% | 1.1%(+2.90)#18 | 1.9%(+2.08)#2,695 |
| 19. | Granville | 3.8% | 1.1%(+2.69)#19 | 1.9%(+1.87)#2,932 |
| 20. | Franklin | 3.8% | 1.1%(+2.69)#20 | 1.9%(+1.87)#2,937 |
| 21. | Whitesville | 3.7% | 1.1%(+2.68)#21 | 1.9%(+1.86)#2,950 |
| 22. | Chapmanville | 3.7% | 1.1%(+2.63)#22 | 1.9%(+1.81)#3,008 |
| 23. | Kingwood | 3.5% | 1.1%(+2.40)#23 | 1.9%(+1.58)#3,328 |
| 24. | Davis | 3.4% | 1.1%(+2.33)#24 | 1.9%(+1.51)#3,418 |
| 25. | Charles Town | 3.4% | 1.1%(+2.31)#25 | 1.9%(+1.49)#3,453 |
| 26. | Princeton | 3.3% | 1.1%(+2.25)#26 | 1.9%(+1.43)#3,548 |
| 27. | Ceredo | 3.3% | 1.1%(+2.24)#27 | 1.9%(+1.42)#3,571 |
| 28. | Belle | 3.2% | 1.1%(+2.10)#28 | 1.9%(+1.28)#3,807 |
| 29. | Harrisville | 3.0% | 1.1%(+1.98)#29 | 1.9%(+1.15)#4,037 |
| 30. | New Cumberland | 3.0% | 1.1%(+1.97)#30 | 1.9%(+1.15)#4,041 |
| 31. | Boaz | 3.0% | 1.1%(+1.94)#31 | 1.9%(+1.12)#4,091 |
| 32. | Enterprise | 3.0% | 1.1%(+1.90)#32 | 1.9%(+1.08)#4,178 |
| 33. | Morgantown | 2.9% | 1.1%(+1.80)#33 | 1.9%(+0.981)#4,376 |
| 34. | Cassville | 2.7% | 1.1%(+1.64)#34 | 1.9%(+0.821)#4,748 |
| 35. | Hurricane | 2.7% | 1.1%(+1.63)#35 | 1.9%(+0.813)#4,768 |
| 36. | New Martinsville | 2.7% | 1.1%(+1.59)#36 | 1.9%(+0.766)#4,906 |
| 37. | Craigsville | 2.5% | 1.1%(+1.41)#37 | 1.9%(+0.590)#5,378 |
| 38. | Keyser | 2.4% | 1.1%(+1.35)#38 | 1.9%(+0.533)#5,561 |
| 39. | Williamson | 2.4% | 1.1%(+1.35)#39 | 1.9%(+0.530)#5,573 |
| 40. | Elkins | 2.4% | 1.1%(+1.34)#40 | 1.9%(+0.519)#5,604 |
| 41. | Beaver | 2.4% | 1.1%(+1.33)#41 | 1.9%(+0.512)#5,627 |
| 42. | Pinch | 2.4% | 1.1%(+1.31)#42 | 1.9%(+0.491)#5,694 |
| 43. | Mill Creek | 2.2% | 1.1%(+1.09)#43 | 1.9%(+0.267)#6,473 |
| 44. | Prosperity | 2.1% | 1.1%(+1.06)#44 | 1.9%(+0.243)#6,548 |
| 45. | Parkersburg | 2.1% | 1.1%(+1.05)#45 | 1.9%(+0.234)#6,594 |
| 46. | Bridgeport | 2.1% | 1.1%(+1.04)#46 | 1.9%(+0.222)#6,628 |
| 47. | Mitchell Heights | 2.1% | 1.1%(+1.02)#47 | 1.9%(+0.203)#6,689 |
| 48. | Shannondale | 2.0% | 1.1%(+0.903)#48 | 1.9%(+0.083)#7,170 |
| 49. | Wiley Ford | 1.9% | 1.1%(+0.874)#49 | 1.9%(+0.054)#7,273 |
| 50. | Oak Hill | 1.8% | 1.1%(+0.752)#50 | 1.9%(-0.068)#7,745 |
| 51. | Pea Ridge | 1.8% | 1.1%(+0.719)#51 | 1.9%(-0.101)#7,875 |
| 52. | Cameron | 1.8% | 1.1%(+0.704)#52 | 1.9%(-0.117)#7,937 |
| 53. | Culloden | 1.7% | 1.1%(+0.648)#53 | 1.9%(-0.172)#8,186 |
| 54. | Paw Paw | 1.7% | 1.1%(+0.643)#54 | 1.9%(-0.177)#8,206 |
| 55. | Terra Alta | 1.7% | 1.1%(+0.636)#55 | 1.9%(-0.184)#8,246 |
| 56. | Wheeling | 1.7% | 1.1%(+0.626)#56 | 1.9%(-0.195)#8,297 |
| 57. | Petersburg | 1.7% | 1.1%(+0.624)#57 | 1.9%(-0.197)#8,304 |
| 58. | Teays Valley | 1.6% | 1.1%(+0.577)#58 | 1.9%(-0.243)#8,536 |
| 59. | Beverly | 1.6% | 1.1%(+0.550)#59 | 1.9%(-0.270)#8,669 |
| 60. | Clarksburg | 1.6% | 1.1%(+0.550)#60 | 1.9%(-0.271)#8,672 |
| 61. | Vienna | 1.6% | 1.1%(+0.535)#61 | 1.9%(-0.285)#8,739 |
| 62. | Glenville | 1.6% | 1.1%(+0.516)#62 | 1.9%(-0.304)#8,821 |
| 63. | Fayetteville | 1.6% | 1.1%(+0.515)#63 | 1.9%(-0.306)#8,836 |
| 64. | Rainelle | 1.6% | 1.1%(+0.513)#64 | 1.9%(-0.308)#8,844 |
| 65. | Charleston | 1.5% | 1.1%(+0.431)#65 | 1.9%(-0.389)#9,284 |
| 66. | Harpers Ferry | 1.5% | 1.1%(+0.410)#66 | 1.9%(-0.410)#9,389 |
| 67. | Buckhannon | 1.5% | 1.1%(+0.387)#67 | 1.9%(-0.434)#9,514 |
| 68. | Moundsville | 1.4% | 1.1%(+0.354)#68 | 1.9%(-0.466)#9,674 |
| 69. | Ranson Corporation | 1.4% | 1.1%(+0.354)#69 | 1.9%(-0.467)#9,678 |
| 70. | Reedsville | 1.4% | 1.1%(+0.344)#70 | 1.9%(-0.477)#9,737 |
| 71. | Coal Fork | 1.4% | 1.1%(+0.326)#71 | 1.9%(-0.495)#9,820 |
| 72. | Rowlesburg | 1.3% | 1.1%(+0.262)#72 | 1.9%(-0.558)#10,147 |
| 73. | Westover | 1.3% | 1.1%(+0.246)#73 | 1.9%(-0.574)#10,225 |
| 74. | Parsons | 1.3% | 1.1%(+0.185)#74 | 1.9%(-0.635)#10,562 |
| 75. | Bluefield | 1.2% | 1.1%(+0.154)#75 | 1.9%(-0.667)#10,742 |
| 76. | Eleanor | 1.2% | 1.1%(+0.080)#76 | 1.9%(-0.740)#11,156 |
| 77. | Weirton | 1.1% | 1.1%(+0.043)#77 | 1.9%(-0.778)#11,337 |
| 78. | Spencer | 1.1% | 1.1%(+0.040)#78 | 1.9%(-0.781)#11,352 |
| 79. | Bethany | 1.1% | 1.1%(+0.037)#79 | 1.9%(-0.783)#11,372 |
| 80. | Beckley | 1.1% | 1.1%(+0.021)#80 | 1.9%(-0.800)#11,473 |
| 81. | Philippi | 1.1% | 1.1%(-0.011)#81 | 1.9%(-0.832)#11,665 |
| 82. | Hinton | 1.1% | 1.1%(-0.014)#82 | 1.9%(-0.834)#11,678 |
| 83. | Lost Creek | 1.0% | 1.1%(-0.024)#83 | 1.9%(-0.845)#11,733 |
| 84. | Williamstown | 1.0% | 1.1%(-0.025)#84 | 1.9%(-0.845)#11,735 |
| 85. | Alderson | 1.0% | 1.1%(-0.040)#85 | 1.9%(-0.861)#11,823 |
| 86. | Burnsville | 1.0% | 1.1%(-0.046)#86 | 1.9%(-0.866)#11,854 |
| 87. | Fairmont | 0.97% | 1.1%(-0.101)#87 | 1.9%(-0.922)#12,180 |
| 88. | Nutter Fort | 0.97% | 1.1%(-0.106)#88 | 1.9%(-0.927)#12,206 |
| 89. | Madison | 0.95% | 1.1%(-0.118)#89 | 1.9%(-0.939)#12,261 |
| 90. | Piedmont | 0.94% | 1.1%(-0.131)#90 | 1.9%(-0.952)#12,362 |
| 91. | Huntington | 0.93% | 1.1%(-0.137)#91 | 1.9%(-0.957)#12,386 |
| 92. | South Charleston | 0.91% | 1.1%(-0.159)#92 | 1.9%(-0.979)#12,487 |
| 93. | Martinsburg | 0.83% | 1.1%(-0.242)#93 | 1.9%(-1.06)#12,938 |
| 94. | Sistersville | 0.77% | 1.1%(-0.304)#94 | 1.9%(-1.12)#13,294 |
| 95. | Cheat Lake | 0.73% | 1.1%(-0.346)#95 | 1.9%(-1.17)#13,531 |
| 96. | Winfield | 0.71% | 1.1%(-0.365)#96 | 1.9%(-1.19)#13,644 |
| 97. | Bethlehem | 0.64% | 1.1%(-0.433)#97 | 1.9%(-1.25)#14,010 |
| 98. | Cross Lanes | 0.63% | 1.1%(-0.439)#98 | 1.9%(-1.26)#14,043 |
| 99. | Inwood | 0.62% | 1.1%(-0.450)#99 | 1.9%(-1.27)#14,109 |
| 100. | Hamlin | 0.61% | 1.1%(-0.459)#100 | 1.9%(-1.28)#14,151 |
Common Questions
What are the Top 10 Cities with the Highest Percentage of Population Employed in Real Estate, Rental & Leasing in West Virginia?
Top 10 Cities with the Highest Percentage of Population Employed in Real Estate, Rental & Leasing in West Virginia are:
#1
42.6%
#2
20.6%
#3
12.9%
#4
11.7%
#5
8.7%
#6
8.3%
#7
7.8%
#8
7.8%
#9
7.0%
#10
6.0%
What city has the Highest Percentage of Population Employed in Real Estate, Rental & Leasing in West Virginia?
Frank has the Highest Percentage of Population Employed in Real Estate, Rental & Leasing in West Virginia with 42.6%.
What is the Percentage of Population Employed in Real Estate, Rental & Leasing in the State of West Virginia?
Percentage of Population Employed in Real Estate, Rental & Leasing in West Virginia is 1.1%.
What is the Percentage of Population Employed in Real Estate, Rental & Leasing in the United States?
Percentage of Population Employed in Real Estate, Rental & Leasing in the United States is 1.9%.