Cities with the Lowest Poverty Level Among Seniors Over the Age of 65 in Colorado
RELATED REPORTS & OPTIONS
Lowest Poverty | Seniors 65+
Colorado
Compare Cities
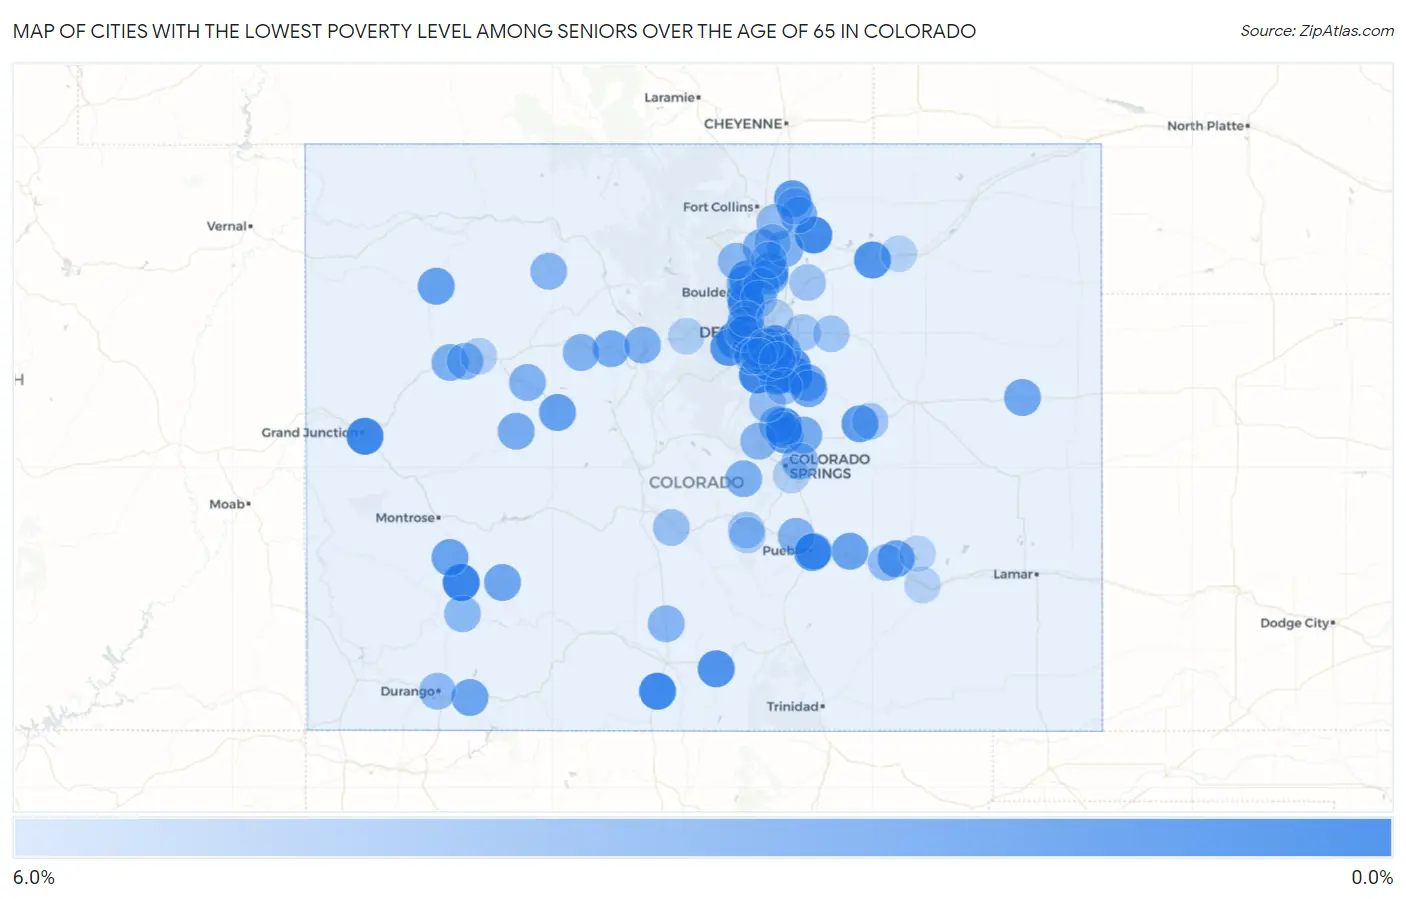
Map of Cities with the Lowest Poverty Level Among Seniors Over the Age of 65 in Colorado
6.0%
0.0%
Cities with the Lowest Poverty Level Among Seniors Over the Age of 65 in Colorado
| City | Senior Poverty | vs State | vs National | |
| 1. | Ouray | 0.63% | 7.6%(-6.94)#1 | 10.0%(-9.32)#111 |
| 2. | Genesee | 0.89% | 7.6%(-6.68)#2 | 10.0%(-9.06)#224 |
| 3. | Roxborough Park | 0.95% | 7.6%(-6.62)#3 | 10.0%(-9.00)#254 |
| 4. | La Jara | 0.96% | 7.6%(-6.61)#4 | 10.0%(-8.99)#260 |
| 5. | Orchard Mesa | 1.0% | 7.6%(-6.56)#5 | 10.0%(-8.93)#291 |
| 6. | Cherry Hills Village | 1.0% | 7.6%(-6.55)#6 | 10.0%(-8.92)#297 |
| 7. | Kersey | 1.1% | 7.6%(-6.49)#7 | 10.0%(-8.86)#329 |
| 8. | The Pinery | 1.1% | 7.6%(-6.44)#8 | 10.0%(-8.82)#360 |
| 9. | Superior | 1.2% | 7.6%(-6.34)#9 | 10.0%(-8.72)#436 |
| 10. | Columbine Valley | 1.3% | 7.6%(-6.25)#10 | 10.0%(-8.62)#516 |
| 11. | Salt Creek | 1.4% | 7.6%(-6.15)#11 | 10.0%(-8.52)#598 |
| 12. | Woodmoor | 1.4% | 7.6%(-6.13)#12 | 10.0%(-8.51)#609 |
| 13. | Fort Garland | 1.6% | 7.6%(-6.01)#13 | 10.0%(-8.39)#695 |
| 14. | Firestone | 1.6% | 7.6%(-5.99)#14 | 10.0%(-8.36)#723 |
| 15. | Wiggins | 1.8% | 7.6%(-5.81)#15 | 10.0%(-8.18)#879 |
| 16. | Holly Hills | 1.8% | 7.6%(-5.74)#16 | 10.0%(-8.12)#927 |
| 17. | Evergreen | 1.8% | 7.6%(-5.74)#17 | 10.0%(-8.12)#934 |
| 18. | Parker | 1.9% | 7.6%(-5.65)#18 | 10.0%(-8.03)#1,019 |
| 19. | Niwot | 2.0% | 7.6%(-5.55)#19 | 10.0%(-7.92)#1,110 |
| 20. | Pierce | 2.1% | 7.6%(-5.50)#20 | 10.0%(-7.88)#1,159 |
| 21. | Gleneagle | 2.1% | 7.6%(-5.47)#21 | 10.0%(-7.85)#1,191 |
| 22. | Ramah | 2.2% | 7.6%(-5.35)#22 | 10.0%(-7.73)#1,302 |
| 23. | Crowley | 2.6% | 7.6%(-5.01)#23 | 10.0%(-7.39)#1,670 |
| 24. | Aspen | 2.6% | 7.6%(-4.98)#24 | 10.0%(-7.35)#1,702 |
| 25. | Meeker | 2.6% | 7.6%(-4.96)#25 | 10.0%(-7.33)#1,723 |
| 26. | Boone | 2.7% | 7.6%(-4.91)#26 | 10.0%(-7.29)#1,794 |
| 27. | Castle Pines | 2.8% | 7.6%(-4.81)#27 | 10.0%(-7.19)#1,892 |
| 28. | Loghill Village | 2.8% | 7.6%(-4.80)#28 | 10.0%(-7.18)#1,896 |
| 29. | Castle Pines Village | 2.8% | 7.6%(-4.73)#29 | 10.0%(-7.11)#1,979 |
| 30. | Bayfield | 2.9% | 7.6%(-4.71)#30 | 10.0%(-7.08)#2,022 |
| 31. | Lake City | 3.0% | 7.6%(-4.61)#31 | 10.0%(-6.99)#2,140 |
| 32. | Vona | 3.0% | 7.6%(-4.55)#32 | 10.0%(-6.92)#2,222 |
| 33. | Ponderosa Park | 3.1% | 7.6%(-4.49)#33 | 10.0%(-6.87)#2,281 |
| 34. | Elizabeth | 3.1% | 7.6%(-4.43)#34 | 10.0%(-6.80)#2,370 |
| 35. | Highlands Ranch | 3.1% | 7.6%(-4.43)#35 | 10.0%(-6.80)#2,376 |
| 36. | Vail | 3.2% | 7.6%(-4.39)#36 | 10.0%(-6.76)#2,421 |
| 37. | Marble | 3.3% | 7.6%(-4.30)#37 | 10.0%(-6.67)#2,552 |
| 38. | Greenwood Village | 3.3% | 7.6%(-4.25)#38 | 10.0%(-6.63)#2,599 |
| 39. | Centennial | 3.3% | 7.6%(-4.23)#39 | 10.0%(-6.60)#2,658 |
| 40. | Berthoud | 3.4% | 7.6%(-4.20)#40 | 10.0%(-6.57)#2,691 |
| 41. | Black Forest | 3.4% | 7.6%(-4.17)#41 | 10.0%(-6.54)#2,735 |
| 42. | Eaton | 3.4% | 7.6%(-4.16)#42 | 10.0%(-6.54)#2,738 |
| 43. | Rifle | 3.5% | 7.6%(-4.06)#43 | 10.0%(-6.44)#2,869 |
| 44. | Golden | 3.5% | 7.6%(-4.04)#44 | 10.0%(-6.42)#2,894 |
| 45. | Cripple Creek | 3.6% | 7.6%(-4.02)#45 | 10.0%(-6.39)#2,924 |
| 46. | Silverthorne | 3.6% | 7.6%(-3.96)#46 | 10.0%(-6.34)#3,035 |
| 47. | Palmer Lake | 3.7% | 7.6%(-3.89)#47 | 10.0%(-6.27)#3,106 |
| 48. | Pueblo West | 3.7% | 7.6%(-3.89)#48 | 10.0%(-6.26)#3,111 |
| 49. | El Jebel | 3.7% | 7.6%(-3.89)#49 | 10.0%(-6.26)#3,112 |
| 50. | Edwards | 3.7% | 7.6%(-3.88)#50 | 10.0%(-6.26)#3,122 |
| 51. | Frederick | 3.7% | 7.6%(-3.83)#51 | 10.0%(-6.21)#3,204 |
| 52. | Paragon Estates | 3.8% | 7.6%(-3.78)#52 | 10.0%(-6.15)#3,249 |
| 53. | Gunbarrel | 3.8% | 7.6%(-3.76)#53 | 10.0%(-6.13)#3,289 |
| 54. | Milliken | 3.9% | 7.6%(-3.72)#54 | 10.0%(-6.10)#3,351 |
| 55. | Silt | 3.9% | 7.6%(-3.64)#55 | 10.0%(-6.01)#3,454 |
| 56. | Woodland Park | 4.0% | 7.6%(-3.58)#56 | 10.0%(-5.96)#3,525 |
| 57. | Yampa | 4.0% | 7.6%(-3.58)#57 | 10.0%(-5.95)#3,545 |
| 58. | Hooper | 4.0% | 7.6%(-3.58)#58 | 10.0%(-5.95)#3,560 |
| 59. | Erie | 4.0% | 7.6%(-3.54)#59 | 10.0%(-5.91)#3,596 |
| 60. | Lyons | 4.1% | 7.6%(-3.48)#60 | 10.0%(-5.85)#3,683 |
| 61. | Silverton | 4.1% | 7.6%(-3.44)#61 | 10.0%(-5.81)#3,742 |
| 62. | Dakota Ridge | 4.1% | 7.6%(-3.43)#62 | 10.0%(-5.81)#3,747 |
| 63. | Monument | 4.2% | 7.6%(-3.33)#63 | 10.0%(-5.71)#3,881 |
| 64. | Durango | 4.3% | 7.6%(-3.30)#64 | 10.0%(-5.68)#3,920 |
| 65. | Blende | 4.3% | 7.6%(-3.30)#65 | 10.0%(-5.67)#3,931 |
| 66. | Windsor | 4.4% | 7.6%(-3.22)#66 | 10.0%(-5.59)#4,075 |
| 67. | Cimarron Hills | 4.4% | 7.6%(-3.14)#67 | 10.0%(-5.51)#4,188 |
| 68. | Olney Springs | 4.5% | 7.6%(-3.10)#68 | 10.0%(-5.47)#4,264 |
| 69. | Applewood | 4.5% | 7.6%(-3.09)#69 | 10.0%(-5.46)#4,279 |
| 70. | Perry Park | 4.6% | 7.6%(-2.96)#70 | 10.0%(-5.33)#4,466 |
| 71. | Fairmount | 4.7% | 7.6%(-2.92)#71 | 10.0%(-5.30)#4,504 |
| 72. | Howard | 4.7% | 7.6%(-2.91)#72 | 10.0%(-5.29)#4,537 |
| 73. | Johnstown | 4.7% | 7.6%(-2.83)#73 | 10.0%(-5.21)#4,615 |
| 74. | Williamsburg | 4.8% | 7.6%(-2.79)#74 | 10.0%(-5.16)#4,712 |
| 75. | Placerville | 4.9% | 7.6%(-2.70)#75 | 10.0%(-5.07)#4,815 |
| 76. | Hudson | 4.9% | 7.6%(-2.64)#76 | 10.0%(-5.01)#4,903 |
| 77. | Bow Mar | 5.0% | 7.6%(-2.62)#77 | 10.0%(-5.00)#4,940 |
| 78. | West Pleasant View | 5.0% | 7.6%(-2.60)#78 | 10.0%(-4.98)#4,958 |
| 79. | Castle Rock | 5.0% | 7.6%(-2.58)#79 | 10.0%(-4.95)#4,975 |
| 80. | Aetna Estates | 5.1% | 7.6%(-2.51)#80 | 10.0%(-4.89)#5,088 |
| 81. | Bennett | 5.1% | 7.6%(-2.49)#81 | 10.0%(-4.87)#5,115 |
| 82. | Simla | 5.1% | 7.6%(-2.49)#82 | 10.0%(-4.87)#5,117 |
| 83. | Broomfield | 5.1% | 7.6%(-2.48)#83 | 10.0%(-4.85)#5,146 |
| 84. | Mead | 5.2% | 7.6%(-2.35)#84 | 10.0%(-4.73)#5,313 |
| 85. | Ault | 5.4% | 7.6%(-2.22)#85 | 10.0%(-4.59)#5,536 |
| 86. | Arvada | 5.4% | 7.6%(-2.17)#86 | 10.0%(-4.55)#5,598 |
| 87. | Ken Caryl | 5.4% | 7.6%(-2.15)#87 | 10.0%(-4.52)#5,655 |
| 88. | Englewood | 5.4% | 7.6%(-2.14)#88 | 10.0%(-4.51)#5,665 |
| 89. | Columbine | 5.5% | 7.6%(-2.08)#89 | 10.0%(-4.46)#5,756 |
| 90. | Rockvale | 5.6% | 7.6%(-2.02)#90 | 10.0%(-4.40)#5,862 |
| 91. | New Castle | 5.6% | 7.6%(-2.00)#91 | 10.0%(-4.38)#5,918 |
| 92. | Georgetown | 5.6% | 7.6%(-1.95)#92 | 10.0%(-4.32)#5,998 |
| 93. | Park Center | 5.6% | 7.6%(-1.93)#93 | 10.0%(-4.31)#6,021 |
| 94. | Stratmoor | 5.7% | 7.6%(-1.89)#94 | 10.0%(-4.26)#6,092 |
| 95. | Derby | 5.8% | 7.6%(-1.82)#95 | 10.0%(-4.19)#6,193 |
| 96. | Twin Lakes Cdp Adams County | 5.9% | 7.6%(-1.71)#96 | 10.0%(-4.08)#6,381 |
| 97. | Log Lane Village | 5.9% | 7.6%(-1.69)#97 | 10.0%(-4.07)#6,409 |
| 98. | Swink | 5.9% | 7.6%(-1.66)#98 | 10.0%(-4.04)#6,480 |
| 99. | Sugar City | 5.9% | 7.6%(-1.65)#99 | 10.0%(-4.03)#6,499 |
| 100. | Acres Green | 5.9% | 7.6%(-1.64)#100 | 10.0%(-4.02)#6,512 |
Common Questions
What are the Top 10 Cities with the Lowest Poverty Level Among Seniors Over the Age of 65 in Colorado?
Top 10 Cities with the Lowest Poverty Level Among Seniors Over the Age of 65 in Colorado are:
#1
0.63%
#2
0.89%
#3
0.95%
#4
0.96%
#5
1.0%
#6
1.0%
#7
1.1%
#8
1.1%
#9
1.2%
#10
1.3%
What city has the Lowest Poverty Level Among Seniors Over the Age of 65 in Colorado?
Ouray has the Lowest Poverty Level Among Seniors Over the Age of 65 in Colorado with 0.63%.
What is the Poverty Level Among Seniors Over the Age of 65 in the State of Colorado?
Poverty Level Among Seniors Over the Age of 65 in Colorado is 7.6%.
What is the Poverty Level Among Seniors Over the Age of 65 in the United States?
Poverty Level Among Seniors Over the Age of 65 in the United States is 10.0%.