Cities with the Lowest Poverty Level Among Seniors Over the Age of 65 in Iowa
RELATED REPORTS & OPTIONS
Lowest Poverty | Seniors 65+
Iowa
Compare Cities
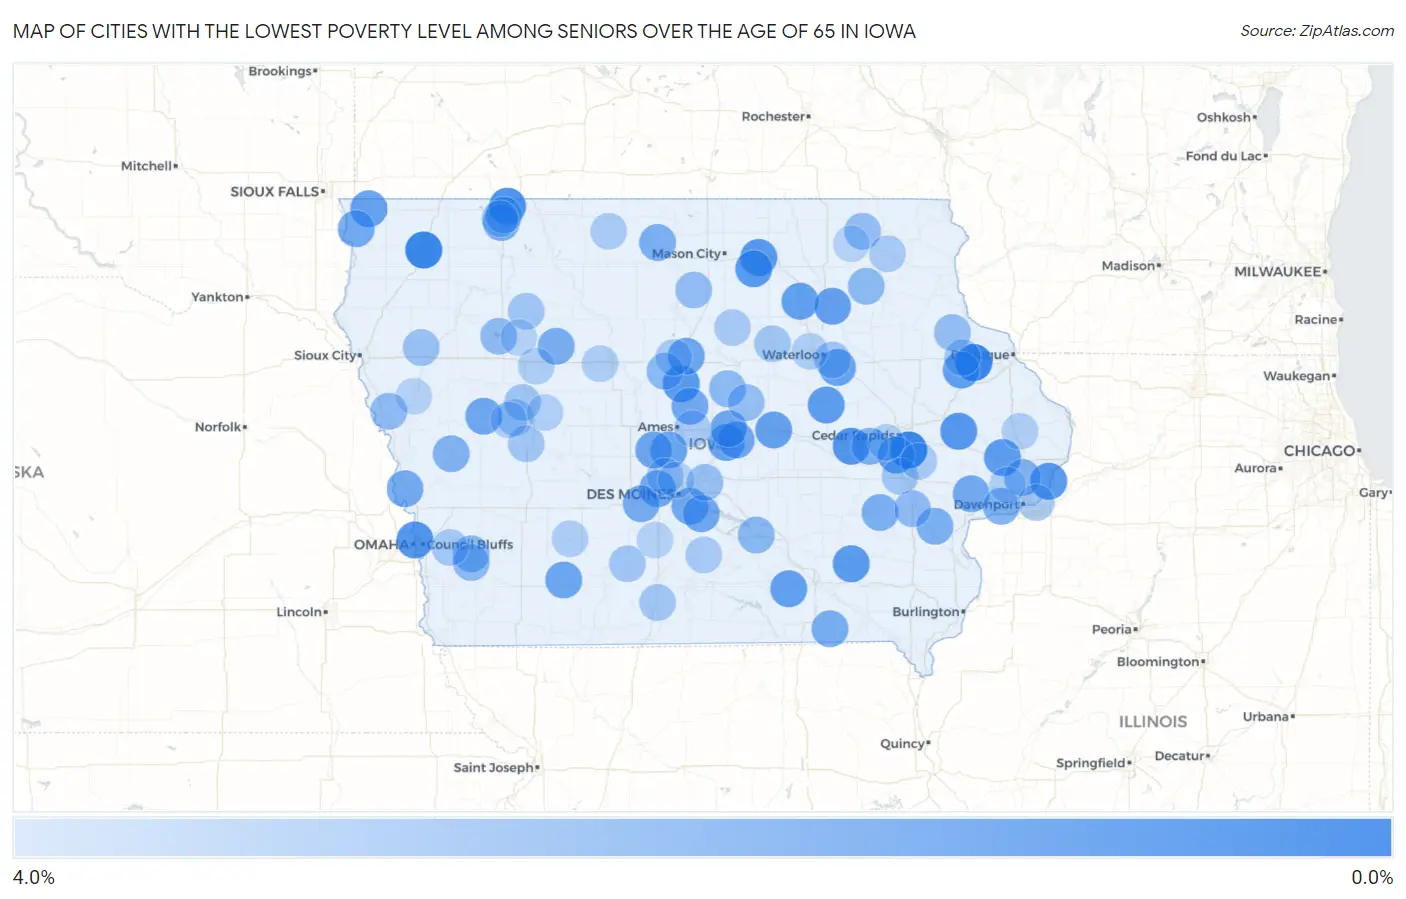
Map of Cities with the Lowest Poverty Level Among Seniors Over the Age of 65 in Iowa
4.0%
0.0%
Cities with the Lowest Poverty Level Among Seniors Over the Age of 65 in Iowa
| City | Senior Poverty | vs State | vs National | |
| 1. | Farley | 0.40% | 7.7%(-7.32)#1 | 10.0%(-9.55)#61 |
| 2. | Ely | 0.41% | 7.7%(-7.30)#2 | 10.0%(-9.54)#63 |
| 3. | Sheldon | 0.45% | 7.7%(-7.26)#3 | 10.0%(-9.50)#76 |
| 4. | Orleans | 0.88% | 7.7%(-6.84)#4 | 10.0%(-9.07)#216 |
| 5. | Blairstown | 0.99% | 7.7%(-6.72)#5 | 10.0%(-8.96)#279 |
| 6. | Carter Lake | 1.0% | 7.7%(-6.69)#6 | 10.0%(-8.93)#292 |
| 7. | Princeton | 1.1% | 7.7%(-6.61)#7 | 10.0%(-8.85)#339 |
| 8. | Olin | 1.1% | 7.7%(-6.59)#8 | 10.0%(-8.83)#356 |
| 9. | Rudd | 1.2% | 7.7%(-6.55)#9 | 10.0%(-8.79)#386 |
| 10. | Rockford | 1.2% | 7.7%(-6.52)#10 | 10.0%(-8.76)#408 |
| 11. | Ellsworth | 1.2% | 7.7%(-6.52)#11 | 10.0%(-8.76)#410 |
| 12. | Packwood | 1.2% | 7.7%(-6.48)#12 | 10.0%(-8.72)#437 |
| 13. | Swisher | 1.3% | 7.7%(-6.46)#13 | 10.0%(-8.69)#454 |
| 14. | Calamus | 1.3% | 7.7%(-6.43)#14 | 10.0%(-8.67)#482 |
| 15. | Dysart | 1.3% | 7.7%(-6.41)#15 | 10.0%(-8.65)#493 |
| 16. | Blakesburg | 1.4% | 7.7%(-6.30)#16 | 10.0%(-8.54)#587 |
| 17. | Worthington | 1.4% | 7.7%(-6.28)#17 | 10.0%(-8.52)#600 |
| 18. | Plainfield | 1.4% | 7.7%(-6.28)#18 | 10.0%(-8.52)#601 |
| 19. | Tripoli | 1.4% | 7.7%(-6.26)#19 | 10.0%(-8.50)#614 |
| 20. | Le Grand | 1.5% | 7.7%(-6.21)#20 | 10.0%(-8.45)#652 |
| 21. | Lester | 1.5% | 7.7%(-6.20)#21 | 10.0%(-8.44)#662 |
| 22. | Gilbertville | 1.5% | 7.7%(-6.17)#22 | 10.0%(-8.41)#682 |
| 23. | Rhodes | 1.6% | 7.7%(-6.13)#23 | 10.0%(-8.36)#717 |
| 24. | Slater | 1.6% | 7.7%(-6.11)#24 | 10.0%(-8.35)#726 |
| 25. | Williams | 1.7% | 7.7%(-6.02)#25 | 10.0%(-8.26)#811 |
| 26. | Prescott | 1.7% | 7.7%(-6.02)#26 | 10.0%(-8.26)#812 |
| 27. | Madrid | 1.7% | 7.7%(-6.01)#27 | 10.0%(-8.24)#823 |
| 28. | Melbourne | 1.7% | 7.7%(-6.00)#28 | 10.0%(-8.24)#827 |
| 29. | State Center | 1.7% | 7.7%(-5.99)#29 | 10.0%(-8.23)#836 |
| 30. | Deloit | 1.7% | 7.7%(-5.99)#30 | 10.0%(-8.23)#841 |
| 31. | Clive | 1.7% | 7.7%(-5.97)#31 | 10.0%(-8.21)#859 |
| 32. | Carlisle | 1.8% | 7.7%(-5.95)#32 | 10.0%(-8.18)#873 |
| 33. | Roland | 1.8% | 7.7%(-5.94)#33 | 10.0%(-8.18)#884 |
| 34. | Hartford | 1.8% | 7.7%(-5.93)#34 | 10.0%(-8.17)#893 |
| 35. | Wilton | 1.8% | 7.7%(-5.90)#35 | 10.0%(-8.14)#909 |
| 36. | Inwood | 1.8% | 7.7%(-5.87)#36 | 10.0%(-8.11)#939 |
| 37. | Modale | 1.9% | 7.7%(-5.83)#37 | 10.0%(-8.06)#981 |
| 38. | Van Meter | 1.9% | 7.7%(-5.79)#38 | 10.0%(-8.03)#1,003 |
| 39. | West Okoboji | 1.9% | 7.7%(-5.76)#39 | 10.0%(-8.00)#1,038 |
| 40. | Pulaski | 2.0% | 7.7%(-5.75)#40 | 10.0%(-7.99)#1,058 |
| 41. | Pomeroy | 2.0% | 7.7%(-5.74)#41 | 10.0%(-7.98)#1,073 |
| 42. | Wellman | 2.0% | 7.7%(-5.67)#42 | 10.0%(-7.91)#1,119 |
| 43. | Crystal Lake | 2.0% | 7.7%(-5.67)#43 | 10.0%(-7.91)#1,127 |
| 44. | Blue Grass | 2.1% | 7.7%(-5.63)#44 | 10.0%(-7.87)#1,168 |
| 45. | Norway | 2.1% | 7.7%(-5.63)#45 | 10.0%(-7.87)#1,174 |
| 46. | Conesville | 2.1% | 7.7%(-5.63)#46 | 10.0%(-7.87)#1,176 |
| 47. | Long Grove | 2.2% | 7.7%(-5.55)#47 | 10.0%(-7.79)#1,233 |
| 48. | Dunlap | 2.2% | 7.7%(-5.55)#48 | 10.0%(-7.78)#1,235 |
| 49. | Kent Estates | 2.3% | 7.7%(-5.40)#49 | 10.0%(-7.64)#1,387 |
| 50. | Okoboji | 2.4% | 7.7%(-5.34)#50 | 10.0%(-7.58)#1,455 |
| 51. | Macedonia | 2.4% | 7.7%(-5.33)#51 | 10.0%(-7.57)#1,473 |
| 52. | Harvey | 2.4% | 7.7%(-5.33)#52 | 10.0%(-7.57)#1,474 |
| 53. | Hawkeye | 2.4% | 7.7%(-5.27)#53 | 10.0%(-7.51)#1,531 |
| 54. | New Providence | 2.4% | 7.7%(-5.27)#54 | 10.0%(-7.51)#1,538 |
| 55. | Kamrar | 2.4% | 7.7%(-5.27)#55 | 10.0%(-7.51)#1,539 |
| 56. | Henderson | 2.5% | 7.7%(-5.21)#56 | 10.0%(-7.45)#1,591 |
| 57. | Lakeside | 2.5% | 7.7%(-5.19)#57 | 10.0%(-7.43)#1,617 |
| 58. | Riverside | 2.5% | 7.7%(-5.18)#58 | 10.0%(-7.42)#1,628 |
| 59. | Whiting | 2.5% | 7.7%(-5.17)#59 | 10.0%(-7.41)#1,640 |
| 60. | Colesburg | 2.6% | 7.7%(-5.08)#60 | 10.0%(-7.32)#1,738 |
| 61. | Meservey | 2.6% | 7.7%(-5.08)#61 | 10.0%(-7.32)#1,745 |
| 62. | Ridgeway | 2.6% | 7.7%(-5.08)#62 | 10.0%(-7.32)#1,748 |
| 63. | Liscomb | 2.7% | 7.7%(-5.01)#63 | 10.0%(-7.25)#1,831 |
| 64. | Mitchellville | 2.7% | 7.7%(-4.97)#64 | 10.0%(-7.21)#1,871 |
| 65. | Pierson | 2.8% | 7.7%(-4.94)#65 | 10.0%(-7.17)#1,911 |
| 66. | Arcadia | 2.9% | 7.7%(-4.77)#66 | 10.0%(-7.01)#2,096 |
| 67. | Elk Run Heights | 2.9% | 7.7%(-4.77)#67 | 10.0%(-7.01)#2,097 |
| 68. | Riverdale | 2.9% | 7.7%(-4.77)#68 | 10.0%(-7.01)#2,104 |
| 69. | Breda | 2.9% | 7.7%(-4.77)#69 | 10.0%(-7.01)#2,106 |
| 70. | Lorimor | 2.9% | 7.7%(-4.77)#70 | 10.0%(-7.01)#2,107 |
| 71. | Van Wert | 2.9% | 7.7%(-4.77)#71 | 10.0%(-7.01)#2,116 |
| 72. | Albert City | 3.0% | 7.7%(-4.75)#72 | 10.0%(-6.99)#2,133 |
| 73. | Templeton | 3.0% | 7.7%(-4.74)#73 | 10.0%(-6.98)#2,146 |
| 74. | Parkersburg | 3.0% | 7.7%(-4.72)#74 | 10.0%(-6.95)#2,173 |
| 75. | Tiffin | 3.0% | 7.7%(-4.71)#75 | 10.0%(-6.95)#2,181 |
| 76. | Dyersville | 3.0% | 7.7%(-4.71)#76 | 10.0%(-6.95)#2,184 |
| 77. | Treynor | 3.0% | 7.7%(-4.68)#77 | 10.0%(-6.92)#2,205 |
| 78. | Wahpeton | 3.0% | 7.7%(-4.66)#78 | 10.0%(-6.90)#2,242 |
| 79. | Geneva | 3.1% | 7.7%(-4.59)#79 | 10.0%(-6.83)#2,345 |
| 80. | Blairsburg | 3.1% | 7.7%(-4.59)#80 | 10.0%(-6.83)#2,346 |
| 81. | Nevada | 3.1% | 7.7%(-4.58)#81 | 10.0%(-6.82)#2,355 |
| 82. | Ossian | 3.1% | 7.7%(-4.56)#82 | 10.0%(-6.80)#2,375 |
| 83. | Lacona | 3.2% | 7.7%(-4.56)#83 | 10.0%(-6.79)#2,382 |
| 84. | Johnston | 3.2% | 7.7%(-4.54)#84 | 10.0%(-6.78)#2,399 |
| 85. | Bancroft | 3.2% | 7.7%(-4.53)#85 | 10.0%(-6.77)#2,416 |
| 86. | Solon | 3.2% | 7.7%(-4.52)#86 | 10.0%(-6.76)#2,423 |
| 87. | Fontanelle | 3.2% | 7.7%(-4.49)#87 | 10.0%(-6.73)#2,465 |
| 88. | Lytton | 3.2% | 7.7%(-4.49)#88 | 10.0%(-6.73)#2,474 |
| 89. | Moorland | 3.2% | 7.7%(-4.49)#89 | 10.0%(-6.73)#2,478 |
| 90. | Fairfax | 3.3% | 7.7%(-4.42)#90 | 10.0%(-6.66)#2,559 |
| 91. | Delmar | 3.3% | 7.7%(-4.42)#91 | 10.0%(-6.65)#2,570 |
| 92. | Cedar Falls | 3.3% | 7.7%(-4.42)#92 | 10.0%(-6.65)#2,573 |
| 93. | Westside | 3.3% | 7.7%(-4.38)#93 | 10.0%(-6.62)#2,635 |
| 94. | Maysville | 3.3% | 7.7%(-4.38)#95 | 10.0%(-6.62)#2,640 |
| 95. | Lidderdale | 3.3% | 7.7%(-4.38)#96 | 10.0%(-6.62)#2,641 |
| 96. | St Charles | 3.4% | 7.7%(-4.32)#97 | 10.0%(-6.56)#2,702 |
| 97. | Newell | 3.4% | 7.7%(-4.26)#98 | 10.0%(-6.50)#2,779 |
| 98. | Protivin | 3.4% | 7.7%(-4.26)#99 | 10.0%(-6.50)#2,789 |
| 99. | Smithland | 3.4% | 7.7%(-4.26)#100 | 10.0%(-6.50)#2,799 |
| 100. | Saylorville | 3.5% | 7.7%(-4.26)#101 | 10.0%(-6.50)#2,803 |
Common Questions
What are the Top 10 Cities with the Lowest Poverty Level Among Seniors Over the Age of 65 in Iowa?
Top 10 Cities with the Lowest Poverty Level Among Seniors Over the Age of 65 in Iowa are:
#1
0.40%
#2
0.41%
#3
0.45%
#4
0.88%
#5
0.99%
#6
1.0%
#7
1.1%
#8
1.1%
#9
1.2%
#10
1.2%
What city has the Lowest Poverty Level Among Seniors Over the Age of 65 in Iowa?
Farley has the Lowest Poverty Level Among Seniors Over the Age of 65 in Iowa with 0.40%.
What is the Poverty Level Among Seniors Over the Age of 65 in the State of Iowa?
Poverty Level Among Seniors Over the Age of 65 in Iowa is 7.7%.
What is the Poverty Level Among Seniors Over the Age of 65 in the United States?
Poverty Level Among Seniors Over the Age of 65 in the United States is 10.0%.