Cities with the Lowest Poverty Level Among Seniors Over the Age of 65 in New York
RELATED REPORTS & OPTIONS
Lowest Poverty | Seniors 65+
New York
Compare Cities
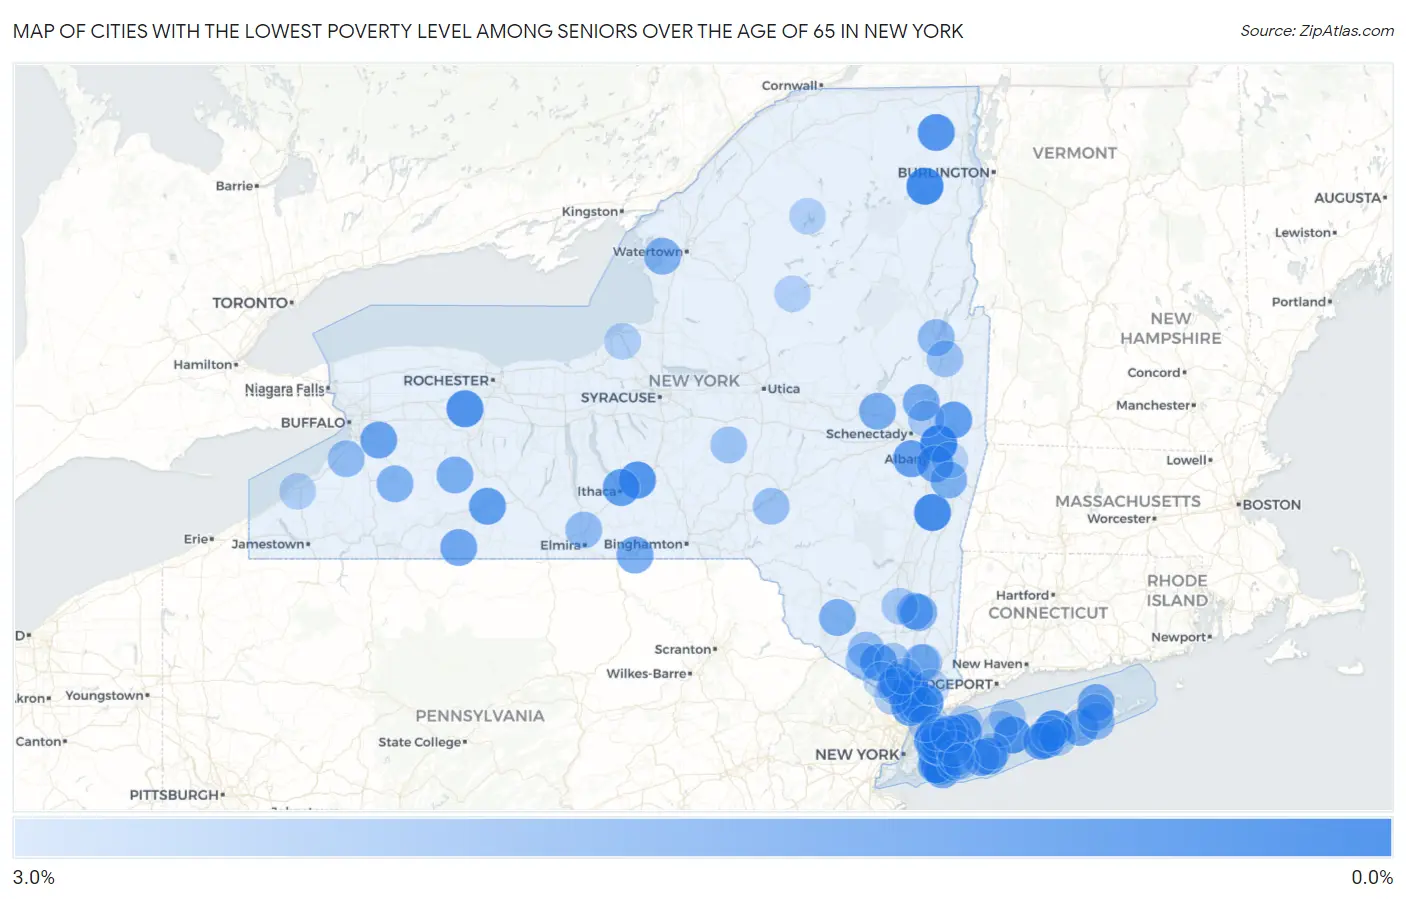
Map of Cities with the Lowest Poverty Level Among Seniors Over the Age of 65 in New York
3.0%
0.0%
Cities with the Lowest Poverty Level Among Seniors Over the Age of 65 in New York
| City | Senior Poverty | vs State | vs National | |
| 1. | Valley Cottage | 0.16% | 12.2%(-12.0)#1 | 10.0%(-9.79)#9 |
| 2. | Kings Point | 0.21% | 12.2%(-12.0)#2 | 10.0%(-9.74)#19 |
| 3. | Green Island | 0.23% | 12.2%(-11.9)#3 | 10.0%(-9.73)#25 |
| 4. | Wilmington | 0.38% | 12.2%(-11.8)#4 | 10.0%(-9.57)#56 |
| 5. | Northampton | 0.43% | 12.2%(-11.7)#5 | 10.0%(-9.52)#68 |
| 6. | Stottville | 0.47% | 12.2%(-11.7)#6 | 10.0%(-9.48)#81 |
| 7. | Laurel Hollow | 0.57% | 12.2%(-11.6)#7 | 10.0%(-9.38)#99 |
| 8. | Farmingville | 0.63% | 12.2%(-11.5)#8 | 10.0%(-9.32)#113 |
| 9. | Caledonia | 0.65% | 12.2%(-11.5)#9 | 10.0%(-9.31)#116 |
| 10. | Freeville | 0.75% | 12.2%(-11.4)#10 | 10.0%(-9.20)#162 |
| 11. | Dannemora | 0.76% | 12.2%(-11.4)#11 | 10.0%(-9.19)#167 |
| 12. | Elmsford | 0.78% | 12.2%(-11.4)#12 | 10.0%(-9.17)#170 |
| 13. | Saddle Rock | 0.80% | 12.2%(-11.4)#13 | 10.0%(-9.15)#180 |
| 14. | New Baltimore | 0.86% | 12.2%(-11.3)#14 | 10.0%(-9.09)#202 |
| 15. | Bellerose | 0.92% | 12.2%(-11.3)#15 | 10.0%(-9.03)#236 |
| 16. | Pomona | 0.93% | 12.2%(-11.2)#16 | 10.0%(-9.02)#248 |
| 17. | West Bay Shore | 0.99% | 12.2%(-11.2)#17 | 10.0%(-8.96)#277 |
| 18. | North Hornell | 1.0% | 12.2%(-11.2)#18 | 10.0%(-8.95)#283 |
| 19. | Cayuga Heights | 1.0% | 12.2%(-11.2)#19 | 10.0%(-8.95)#284 |
| 20. | Valley Falls | 1.1% | 12.2%(-11.1)#20 | 10.0%(-8.90)#315 |
| 21. | Roslyn Estates | 1.1% | 12.2%(-11.1)#21 | 10.0%(-8.87)#325 |
| 22. | Voorheesville | 1.1% | 12.2%(-11.1)#22 | 10.0%(-8.86)#335 |
| 23. | East Moriches | 1.1% | 12.2%(-11.1)#23 | 10.0%(-8.85)#337 |
| 24. | Tappan | 1.1% | 12.2%(-11.1)#24 | 10.0%(-8.84)#349 |
| 25. | Hewlett | 1.2% | 12.2%(-11.0)#25 | 10.0%(-8.77)#403 |
| 26. | East Aurora | 1.2% | 12.2%(-11.0)#26 | 10.0%(-8.76)#413 |
| 27. | Russell Gardens | 1.2% | 12.2%(-11.0)#27 | 10.0%(-8.75)#416 |
| 28. | Walton Park | 1.2% | 12.2%(-10.9)#28 | 10.0%(-8.72)#433 |
| 29. | Hampton Manor | 1.3% | 12.2%(-10.9)#29 | 10.0%(-8.70)#451 |
| 30. | Babylon | 1.3% | 12.2%(-10.9)#30 | 10.0%(-8.68)#464 |
| 31. | Hewlett Harbor | 1.3% | 12.2%(-10.9)#31 | 10.0%(-8.68)#469 |
| 32. | Stannards | 1.3% | 12.2%(-10.9)#32 | 10.0%(-8.65)#494 |
| 33. | Center Moriches | 1.3% | 12.2%(-10.9)#33 | 10.0%(-8.64)#505 |
| 34. | West Nyack | 1.3% | 12.2%(-10.8)#34 | 10.0%(-8.61)#535 |
| 35. | Shinnecock Hills | 1.4% | 12.2%(-10.8)#35 | 10.0%(-8.55)#574 |
| 36. | Glenwood Landing | 1.4% | 12.2%(-10.8)#36 | 10.0%(-8.55)#577 |
| 37. | Nichols | 1.4% | 12.2%(-10.7)#37 | 10.0%(-8.52)#599 |
| 38. | Ballston Spa | 1.5% | 12.2%(-10.7)#38 | 10.0%(-8.48)#624 |
| 39. | Fort Johnson | 1.5% | 12.2%(-10.7)#39 | 10.0%(-8.46)#642 |
| 40. | East Setauket | 1.5% | 12.2%(-10.7)#40 | 10.0%(-8.46)#647 |
| 41. | Shelter Island | 1.5% | 12.2%(-10.7)#41 | 10.0%(-8.46)#648 |
| 42. | Dalton | 1.5% | 12.2%(-10.7)#42 | 10.0%(-8.44)#661 |
| 43. | Harbor Isle | 1.5% | 12.2%(-10.6)#43 | 10.0%(-8.42)#671 |
| 44. | Rock Hill | 1.6% | 12.2%(-10.6)#44 | 10.0%(-8.39)#691 |
| 45. | Nassau | 1.6% | 12.2%(-10.6)#45 | 10.0%(-8.37)#704 |
| 46. | Red Oaks Mill | 1.6% | 12.2%(-10.6)#46 | 10.0%(-8.35)#735 |
| 47. | Woodmere | 1.6% | 12.2%(-10.6)#47 | 10.0%(-8.33)#749 |
| 48. | Piermont | 1.6% | 12.2%(-10.5)#48 | 10.0%(-8.32)#755 |
| 49. | Plandome Heights | 1.7% | 12.2%(-10.5)#49 | 10.0%(-8.29)#774 |
| 50. | Sackets Harbor | 1.7% | 12.2%(-10.5)#50 | 10.0%(-8.28)#784 |
| 51. | Upper Brookville | 1.7% | 12.2%(-10.5)#51 | 10.0%(-8.26)#800 |
| 52. | Delevan | 1.7% | 12.2%(-10.5)#52 | 10.0%(-8.24)#825 |
| 53. | Spackenkill | 1.8% | 12.2%(-10.4)#53 | 10.0%(-8.15)#907 |
| 54. | Bridgehampton | 1.9% | 12.2%(-10.3)#54 | 10.0%(-8.07)#968 |
| 55. | University Gardens | 1.9% | 12.2%(-10.3)#55 | 10.0%(-8.04)#1,001 |
| 56. | Lake George | 1.9% | 12.2%(-10.2)#56 | 10.0%(-8.02)#1,028 |
| 57. | Noyack | 2.0% | 12.2%(-10.2)#57 | 10.0%(-8.00)#1,040 |
| 58. | Congers | 2.0% | 12.2%(-10.2)#58 | 10.0%(-8.00)#1,042 |
| 59. | Irvington | 2.0% | 12.2%(-10.2)#59 | 10.0%(-7.95)#1,088 |
| 60. | Eden | 2.0% | 12.2%(-10.2)#60 | 10.0%(-7.95)#1,090 |
| 61. | Horseheads North | 2.0% | 12.2%(-10.2)#61 | 10.0%(-7.95)#1,101 |
| 62. | Goshen | 2.1% | 12.2%(-10.1)#62 | 10.0%(-7.90)#1,141 |
| 63. | Franklin | 2.1% | 12.2%(-10.0)#63 | 10.0%(-7.82)#1,208 |
| 64. | Jericho | 2.1% | 12.2%(-10.0)#64 | 10.0%(-7.81)#1,222 |
| 65. | Shrub Oak | 2.2% | 12.2%(-10.0)#65 | 10.0%(-7.80)#1,225 |
| 66. | Manhasset Hills | 2.2% | 12.2%(-9.99)#66 | 10.0%(-7.77)#1,256 |
| 67. | South Glens Falls | 2.2% | 12.2%(-9.99)#67 | 10.0%(-7.77)#1,259 |
| 68. | Plandome | 2.2% | 12.2%(-9.97)#68 | 10.0%(-7.75)#1,279 |
| 69. | Florida | 2.2% | 12.2%(-9.96)#69 | 10.0%(-7.74)#1,289 |
| 70. | Earlville | 2.2% | 12.2%(-9.95)#70 | 10.0%(-7.73)#1,297 |
| 71. | Merrick | 2.2% | 12.2%(-9.94)#71 | 10.0%(-7.72)#1,304 |
| 72. | Lake Mohegan | 2.3% | 12.2%(-9.87)#72 | 10.0%(-7.65)#1,381 |
| 73. | Woodbury | 2.3% | 12.2%(-9.84)#73 | 10.0%(-7.62)#1,411 |
| 74. | Westhampton | 2.3% | 12.2%(-9.83)#74 | 10.0%(-7.61)#1,426 |
| 75. | Airmont | 2.4% | 12.2%(-9.79)#75 | 10.0%(-7.57)#1,479 |
| 76. | Eastport | 2.4% | 12.2%(-9.79)#76 | 10.0%(-7.57)#1,483 |
| 77. | Clintondale | 2.4% | 12.2%(-9.78)#77 | 10.0%(-7.55)#1,490 |
| 78. | Lake Success | 2.4% | 12.2%(-9.73)#78 | 10.0%(-7.51)#1,526 |
| 79. | North Bellmore | 2.4% | 12.2%(-9.73)#79 | 10.0%(-7.51)#1,543 |
| 80. | Wesley Hills | 2.5% | 12.2%(-9.71)#80 | 10.0%(-7.49)#1,555 |
| 81. | Country Knolls | 2.5% | 12.2%(-9.70)#81 | 10.0%(-7.48)#1,558 |
| 82. | Lloyd Harbor | 2.5% | 12.2%(-9.70)#82 | 10.0%(-7.48)#1,566 |
| 83. | Salisbury | 2.5% | 12.2%(-9.69)#83 | 10.0%(-7.47)#1,574 |
| 84. | Poquott | 2.5% | 12.2%(-9.66)#84 | 10.0%(-7.44)#1,608 |
| 85. | Fort Covington | 2.5% | 12.2%(-9.63)#85 | 10.0%(-7.41)#1,642 |
| 86. | St James | 2.6% | 12.2%(-9.61)#86 | 10.0%(-7.39)#1,655 |
| 87. | Sands Point | 2.6% | 12.2%(-9.61)#87 | 10.0%(-7.39)#1,657 |
| 88. | Minetto | 2.6% | 12.2%(-9.58)#88 | 10.0%(-7.36)#1,696 |
| 89. | Islip | 2.6% | 12.2%(-9.57)#89 | 10.0%(-7.35)#1,704 |
| 90. | Pelham | 2.6% | 12.2%(-9.56)#90 | 10.0%(-7.34)#1,719 |
| 91. | Fredonia | 2.6% | 12.2%(-9.55)#91 | 10.0%(-7.33)#1,724 |
| 92. | Cranberry Lake | 2.6% | 12.2%(-9.54)#92 | 10.0%(-7.32)#1,756 |
| 93. | Loudonville | 2.6% | 12.2%(-9.53)#93 | 10.0%(-7.31)#1,761 |
| 94. | Old Forge | 2.6% | 12.2%(-9.52)#94 | 10.0%(-7.30)#1,768 |
| 95. | Glen Head | 2.7% | 12.2%(-9.52)#95 | 10.0%(-7.30)#1,769 |
| 96. | Chappaqua | 2.7% | 12.2%(-9.50)#96 | 10.0%(-7.27)#1,803 |
| 97. | West Sand Lake | 2.7% | 12.2%(-9.46)#97 | 10.0%(-7.23)#1,850 |
| 98. | Tuxedo Park | 2.7% | 12.2%(-9.46)#98 | 10.0%(-7.23)#1,852 |
| 99. | Seaford | 2.7% | 12.2%(-9.45)#99 | 10.0%(-7.23)#1,854 |
| 100. | Stony Point | 2.7% | 12.2%(-9.44)#100 | 10.0%(-7.21)#1,863 |
Common Questions
What are the Top 10 Cities with the Lowest Poverty Level Among Seniors Over the Age of 65 in New York?
Top 10 Cities with the Lowest Poverty Level Among Seniors Over the Age of 65 in New York are:
#1
0.16%
#2
0.21%
#3
0.23%
#4
0.38%
#5
0.43%
#6
0.47%
#7
0.57%
#8
0.63%
#9
0.65%
#10
0.75%
What city has the Lowest Poverty Level Among Seniors Over the Age of 65 in New York?
Valley Cottage has the Lowest Poverty Level Among Seniors Over the Age of 65 in New York with 0.16%.
What is the Poverty Level Among Seniors Over the Age of 65 in the State of New York?
Poverty Level Among Seniors Over the Age of 65 in New York is 12.2%.
What is the Poverty Level Among Seniors Over the Age of 65 in the United States?
Poverty Level Among Seniors Over the Age of 65 in the United States is 10.0%.