Moorpark, CA Map & Demographics
Moorpark Map
Moorpark Overview
$52,673
PER CAPITA INCOME
$155,179
AVG FAMILY INCOME
$143,218
AVG HOUSEHOLD INCOME
22.1%
WAGE / INCOME GAP [ % ]
77.9¢/ $1
WAGE / INCOME GAP [ $ ]
0.37
INEQUALITY / GINI INDEX
36,073
TOTAL POPULATION
17,937
MALE POPULATION
18,136
FEMALE POPULATION
98.90
MALES / 100 FEMALES
101.11
FEMALES / 100 MALES
38.8
MEDIAN AGE
3.6
AVG FAMILY SIZE
3.2
AVG HOUSEHOLD SIZE
19,222
LABOR FORCE [ PEOPLE ]
66.7%
PERCENT IN LABOR FORCE
5.1%
UNEMPLOYMENT RATE
Moorpark Zip Codes
Moorpark Area Codes
Income in Moorpark
Income Overview in Moorpark
Per Capita Income in Moorpark is $52,673, while median incomes of families and households are $155,179 and $143,218 respectively.
| Characteristic | Number | Measure |
| Per Capita Income | 36,073 | $52,673 |
| Median Family Income | 9,104 | $155,179 |
| Mean Family Income | 9,104 | $177,144 |
| Median Household Income | 11,268 | $143,218 |
| Mean Household Income | 11,268 | $164,558 |
| Income Deficit | 9,104 | $0 |
| Wage / Income Gap (%) | 36,073 | 22.08% |
| Wage / Income Gap ($) | 36,073 | 77.92¢ per $1 |
| Gini / Inequality Index | 36,073 | 0.37 |
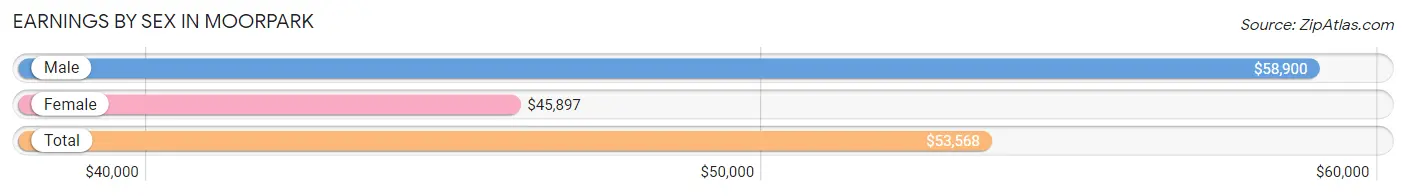
Earnings by Sex in Moorpark
Average Earnings in Moorpark are $53,568, $58,900 for men and $45,897 for women, a difference of 22.1%.
| Sex | Number | Average Earnings |
| Male | 10,967 (55.1%) | $58,900 |
| Female | 8,949 (44.9%) | $45,897 |
| Total | 19,916 (100.0%) | $53,568 |
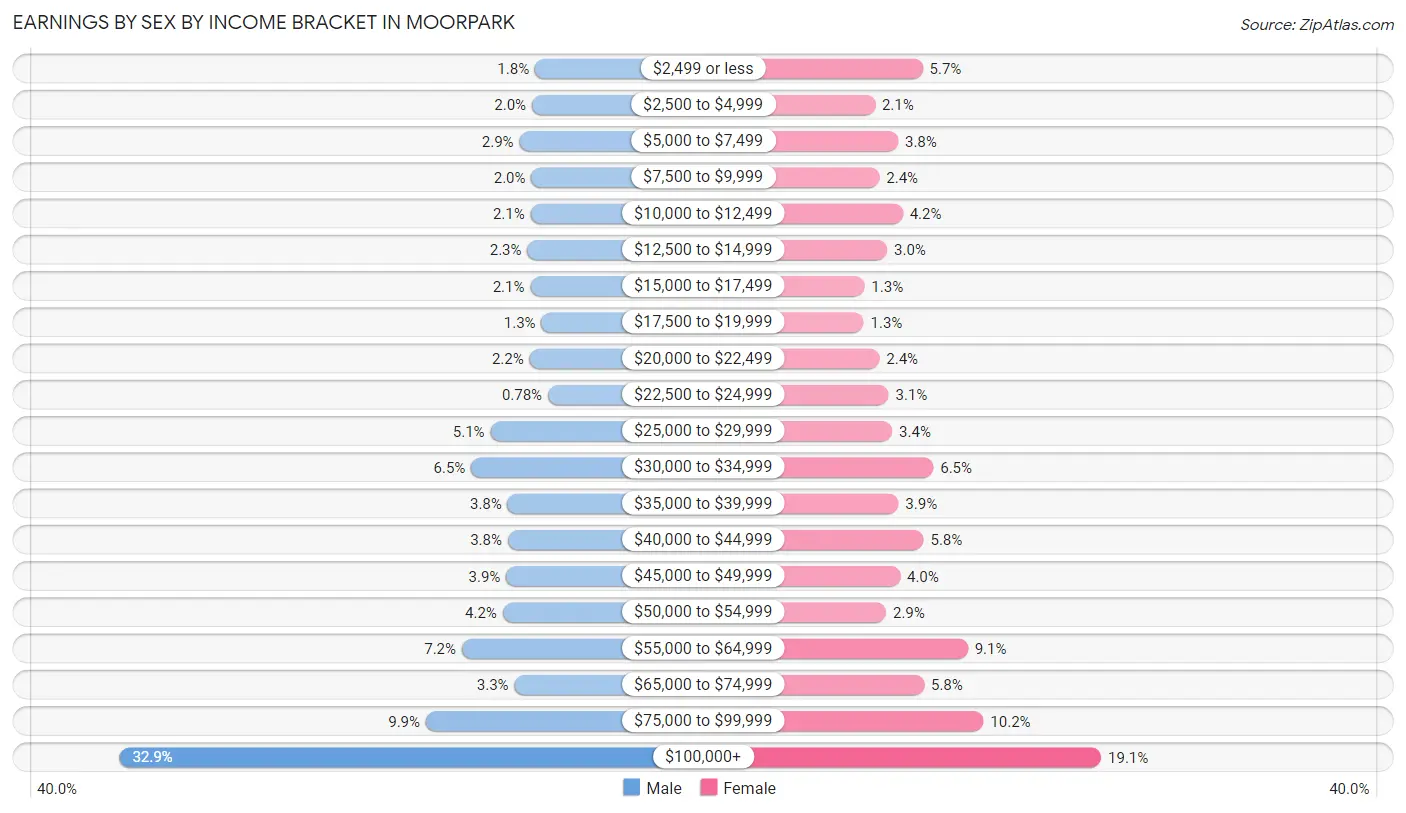
Earnings by Sex by Income Bracket in Moorpark
The most common earnings brackets in Moorpark are $100,000+ for men (3,607 | 32.9%) and $100,000+ for women (1,706 | 19.1%).
| Income | Male | Female |
| $2,499 or less | 192 (1.8%) | 508 (5.7%) |
| $2,500 to $4,999 | 217 (2.0%) | 189 (2.1%) |
| $5,000 to $7,499 | 320 (2.9%) | 344 (3.8%) |
| $7,500 to $9,999 | 222 (2.0%) | 218 (2.4%) |
| $10,000 to $12,499 | 228 (2.1%) | 375 (4.2%) |
| $12,500 to $14,999 | 254 (2.3%) | 270 (3.0%) |
| $15,000 to $17,499 | 230 (2.1%) | 118 (1.3%) |
| $17,500 to $19,999 | 139 (1.3%) | 113 (1.3%) |
| $20,000 to $22,499 | 237 (2.2%) | 218 (2.4%) |
| $22,500 to $24,999 | 85 (0.8%) | 280 (3.1%) |
| $25,000 to $29,999 | 558 (5.1%) | 304 (3.4%) |
| $30,000 to $34,999 | 716 (6.5%) | 580 (6.5%) |
| $35,000 to $39,999 | 417 (3.8%) | 346 (3.9%) |
| $40,000 to $44,999 | 416 (3.8%) | 515 (5.8%) |
| $45,000 to $49,999 | 429 (3.9%) | 357 (4.0%) |
| $50,000 to $54,999 | 457 (4.2%) | 263 (2.9%) |
| $55,000 to $64,999 | 793 (7.2%) | 811 (9.1%) |
| $65,000 to $74,999 | 361 (3.3%) | 518 (5.8%) |
| $75,000 to $99,999 | 1,089 (9.9%) | 916 (10.2%) |
| $100,000+ | 3,607 (32.9%) | 1,706 (19.1%) |
| Total | 10,967 (100.0%) | 8,949 (100.0%) |
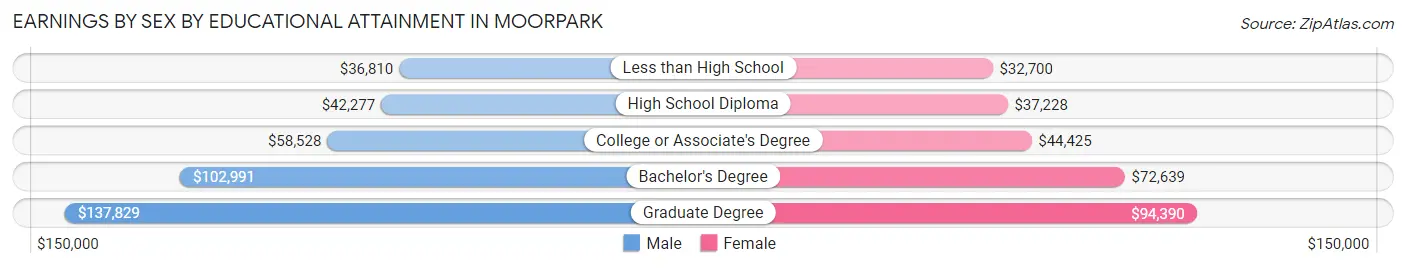
Earnings by Sex by Educational Attainment in Moorpark
Average earnings in Moorpark are $70,687 for men and $55,027 for women, a difference of 22.2%. Men with an educational attainment of graduate degree enjoy the highest average annual earnings of $137,829, while those with less than high school education earn the least with $36,810. Women with an educational attainment of graduate degree earn the most with the average annual earnings of $94,390, while those with less than high school education have the smallest earnings of $32,700.
| Educational Attainment | Male Income | Female Income |
| Less than High School | $36,810 | $32,700 |
| High School Diploma | $42,277 | $37,228 |
| College or Associate's Degree | $58,528 | $44,425 |
| Bachelor's Degree | $102,991 | $72,639 |
| Graduate Degree | $137,829 | $94,390 |
| Total | $70,687 | $55,027 |
Family Income in Moorpark
Family Income Brackets in Moorpark
According to the Moorpark family income data, there are 2,813 families falling into the $200,000+ income range, which is the most common income bracket and makes up 30.9% of all families. Conversely, the $10,000 to $14,999 income bracket is the least frequent group with only 46 families (0.5%) belonging to this category.
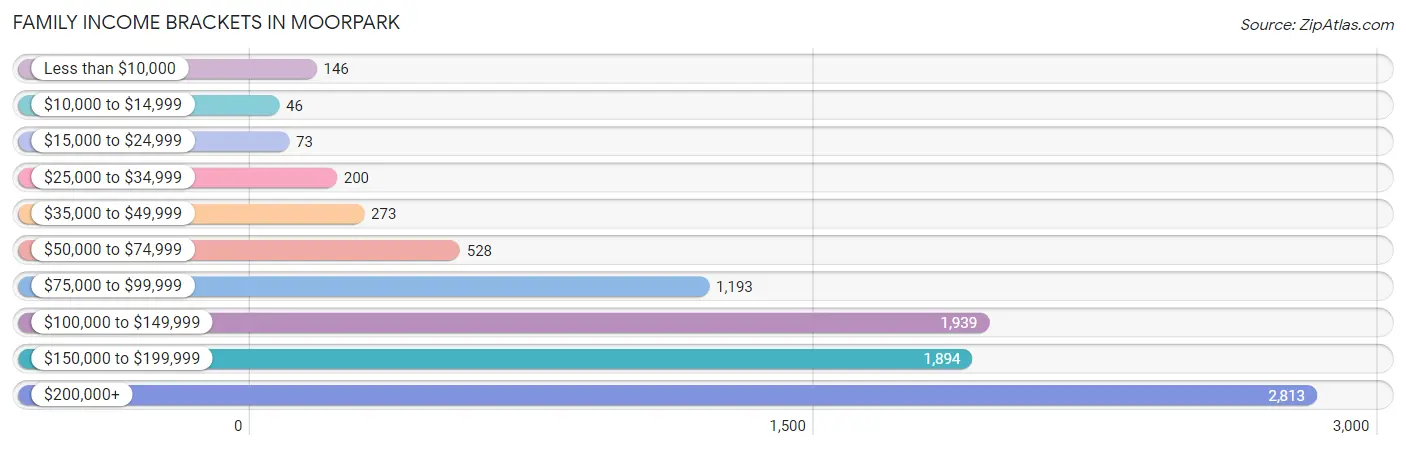
| Income Bracket | # Families | % Families |
| Less than $10,000 | 146 | 1.6% |
| $10,000 to $14,999 | 46 | 0.5% |
| $15,000 to $24,999 | 73 | 0.8% |
| $25,000 to $34,999 | 200 | 2.2% |
| $35,000 to $49,999 | 273 | 3.0% |
| $50,000 to $74,999 | 528 | 5.8% |
| $75,000 to $99,999 | 1,193 | 13.1% |
| $100,000 to $149,999 | 1,939 | 21.3% |
| $150,000 to $199,999 | 1,894 | 20.8% |
| $200,000+ | 2,813 | 30.9% |
Family Income by Famaliy Size in Moorpark
5-person families (788 | 8.7%) account for the highest median family income in Moorpark with $185,833 per family, while 2-person families (2,944 | 32.3%) have the highest median income of $68,060 per family member.
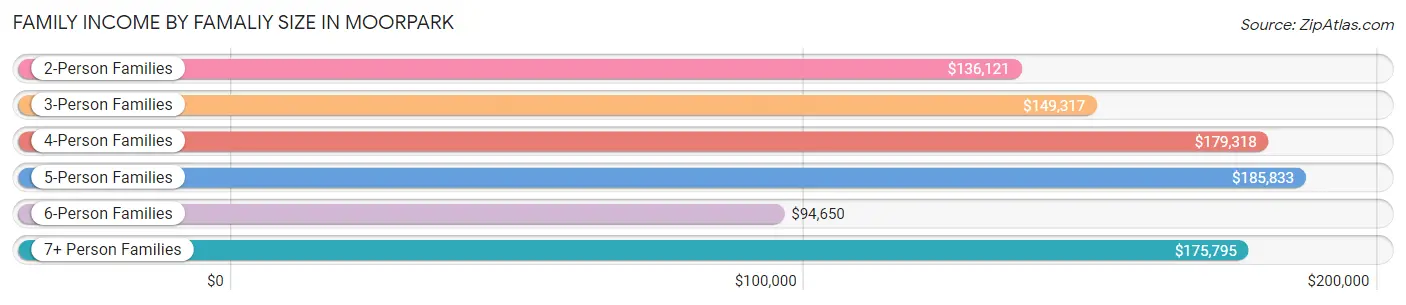
| Income Bracket | # Families | Median Income |
| 2-Person Families | 2,944 (32.3%) | $136,121 |
| 3-Person Families | 2,641 (29.0%) | $149,317 |
| 4-Person Families | 2,096 (23.0%) | $179,318 |
| 5-Person Families | 788 (8.7%) | $185,833 |
| 6-Person Families | 440 (4.8%) | $94,650 |
| 7+ Person Families | 195 (2.1%) | $175,795 |
| Total | 9,104 (100.0%) | $155,179 |
Family Income by Number of Earners in Moorpark
The median family income in Moorpark is $155,179, with families comprising 2 earners (4,260) having the highest median family income of $166,926, while families with no earners (759) have the lowest median family income of $75,069, accounting for 46.8% and 8.3% of families, respectively.
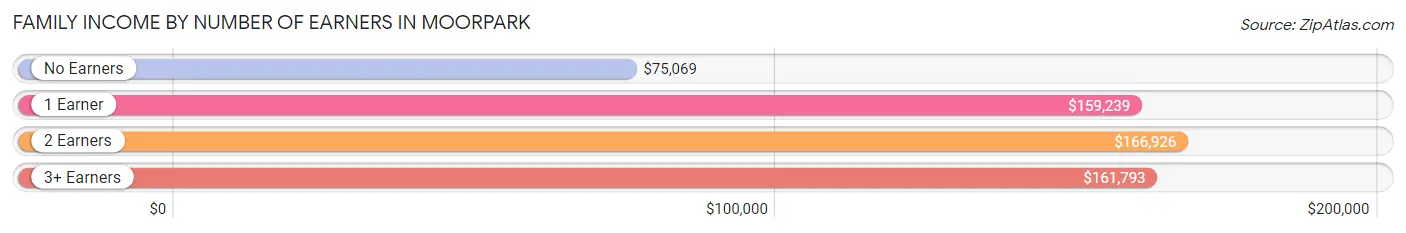
| Number of Earners | # Families | Median Income |
| No Earners | 759 (8.3%) | $75,069 |
| 1 Earner | 2,518 (27.7%) | $159,239 |
| 2 Earners | 4,260 (46.8%) | $166,926 |
| 3+ Earners | 1,567 (17.2%) | $161,793 |
| Total | 9,104 (100.0%) | $155,179 |
Household Income in Moorpark
Household Income Brackets in Moorpark
With 3,200 households falling in the category, the $200,000+ income range is the most frequent in Moorpark, accounting for 28.4% of all households. In contrast, only 90 households (0.8%) fall into the $10,000 to $14,999 income bracket, making it the least populous group.
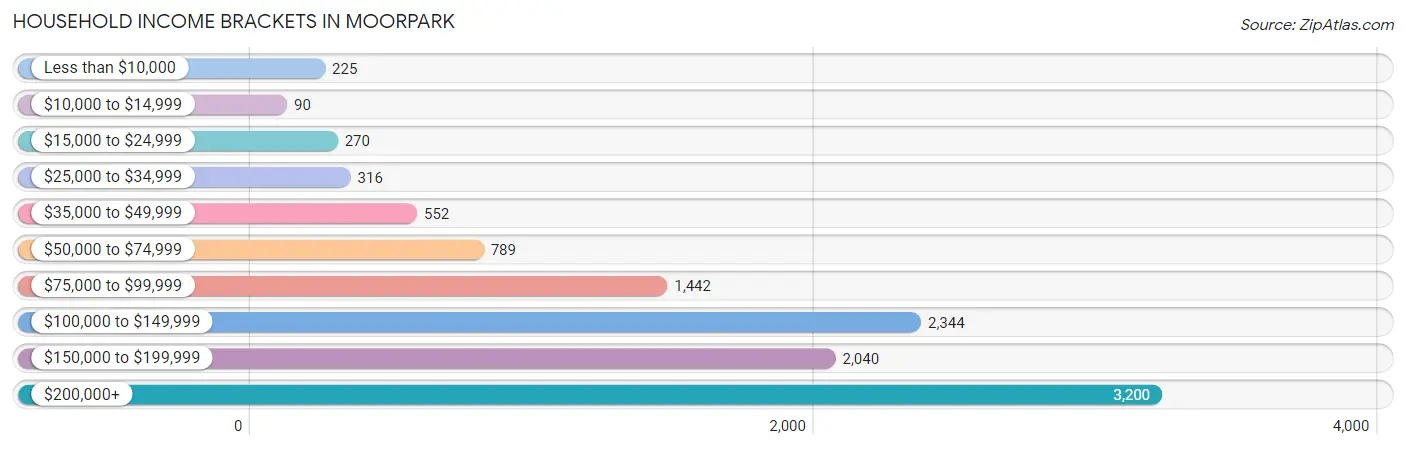
| Income Bracket | # Households | % Households |
| Less than $10,000 | 225 | 2.0% |
| $10,000 to $14,999 | 90 | 0.8% |
| $15,000 to $24,999 | 270 | 2.4% |
| $25,000 to $34,999 | 316 | 2.8% |
| $35,000 to $49,999 | 552 | 4.9% |
| $50,000 to $74,999 | 789 | 7.0% |
| $75,000 to $99,999 | 1,442 | 12.8% |
| $100,000 to $149,999 | 2,344 | 20.8% |
| $150,000 to $199,999 | 2,040 | 18.1% |
| $200,000+ | 3,200 | 28.4% |
Household Income by Householder Age in Moorpark
The median household income in Moorpark is $143,218, with the highest median household income of $170,125 found in the 45 to 64 years age bracket for the primary householder. A total of 5,258 households (46.7%) fall into this category. Meanwhile, the 15 to 24 years age bracket for the primary householder has the lowest median household income of $0, with 95 households (0.8%) in this group.
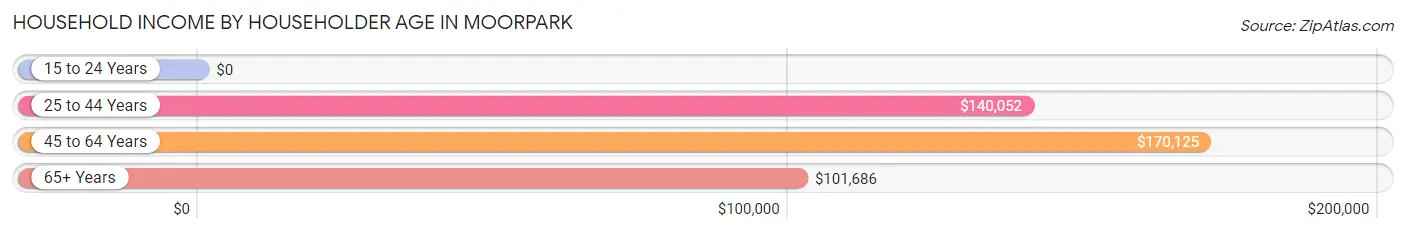
| Income Bracket | # Households | Median Income |
| 15 to 24 Years | 95 (0.8%) | $0 |
| 25 to 44 Years | 3,000 (26.6%) | $140,052 |
| 45 to 64 Years | 5,258 (46.7%) | $170,125 |
| 65+ Years | 2,915 (25.9%) | $101,686 |
| Total | 11,268 (100.0%) | $143,218 |
Poverty in Moorpark
Income Below Poverty by Sex and Age in Moorpark
With 3.4% poverty level for males and 4.6% for females among the residents of Moorpark, 15 year old males and 75 year old and over females are the most vulnerable to poverty, with 17 males (7.6%) and 80 females (8.6%) in their respective age groups living below the poverty level.
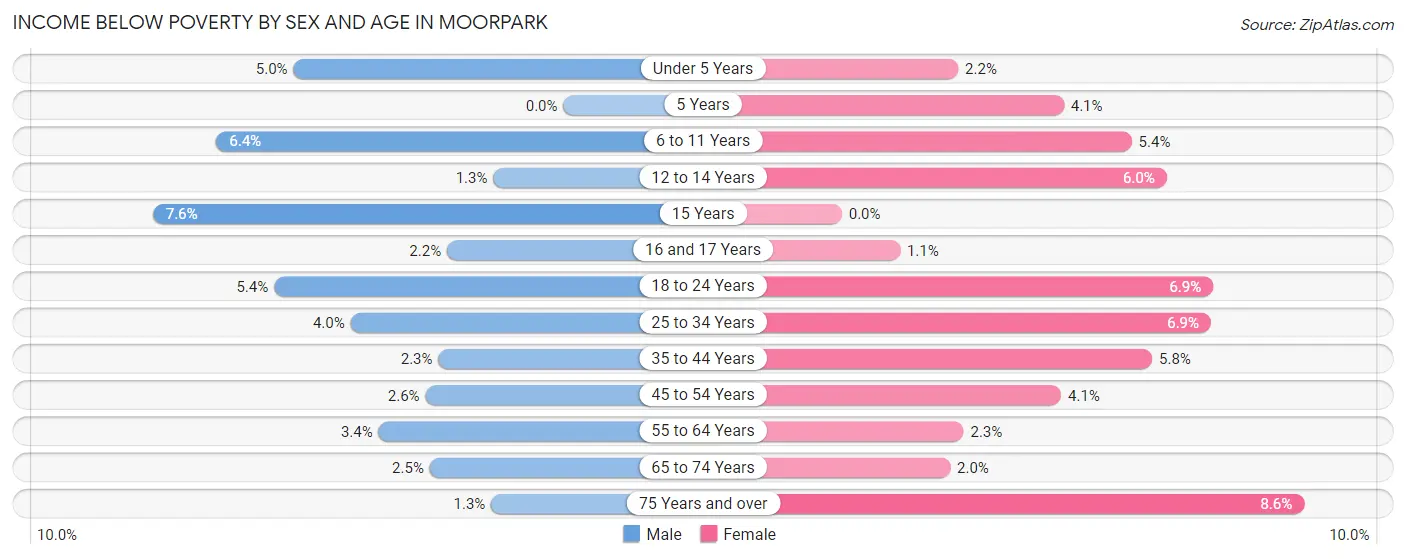
| Age Bracket | Male | Female |
| Under 5 Years | 53 (5.0%) | 22 (2.2%) |
| 5 Years | 0 (0.0%) | 14 (4.1%) |
| 6 to 11 Years | 81 (6.4%) | 90 (5.4%) |
| 12 to 14 Years | 10 (1.3%) | 34 (6.0%) |
| 15 Years | 17 (7.6%) | 0 (0.0%) |
| 16 and 17 Years | 16 (2.2%) | 5 (1.1%) |
| 18 to 24 Years | 81 (5.4%) | 105 (6.9%) |
| 25 to 34 Years | 101 (4.0%) | 158 (6.9%) |
| 35 to 44 Years | 42 (2.3%) | 129 (5.8%) |
| 45 to 54 Years | 71 (2.6%) | 108 (4.1%) |
| 55 to 64 Years | 87 (3.4%) | 57 (2.3%) |
| 65 to 74 Years | 41 (2.5%) | 34 (2.0%) |
| 75 Years and over | 12 (1.3%) | 80 (8.6%) |
| Total | 612 (3.4%) | 836 (4.6%) |
Income Above Poverty by Sex and Age in Moorpark
According to the poverty statistics in Moorpark, males aged 5 years and females aged 15 years are the age groups that are most secure financially, with 100.0% of males and 100.0% of females in these age groups living above the poverty line.
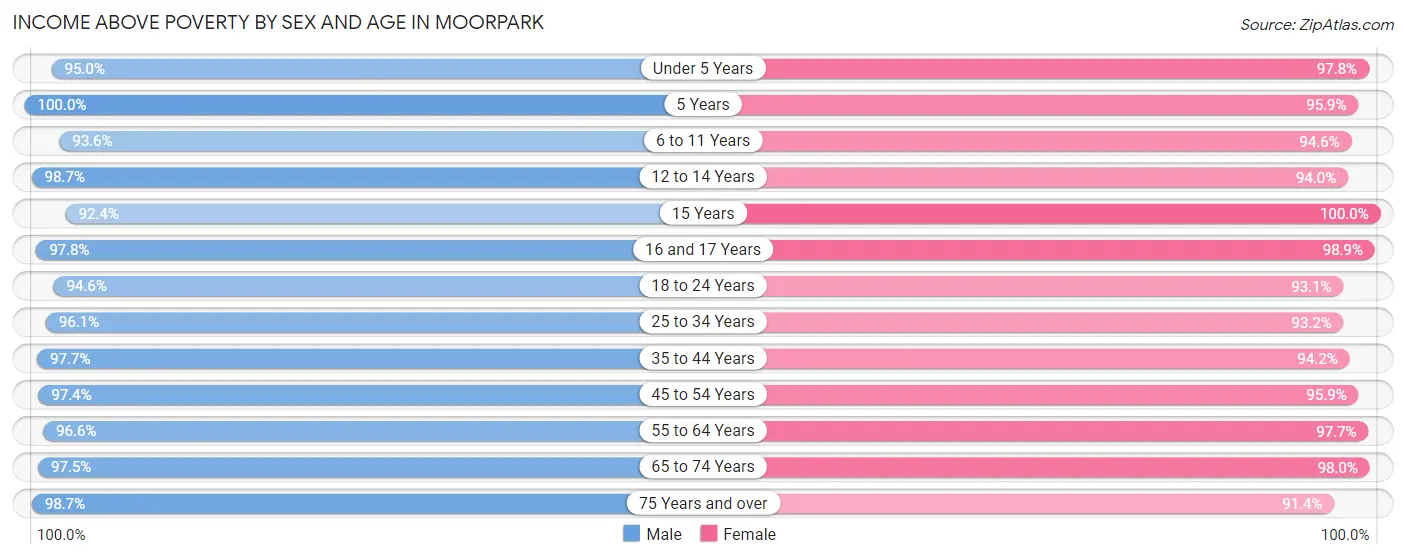
| Age Bracket | Male | Female |
| Under 5 Years | 1,004 (95.0%) | 996 (97.8%) |
| 5 Years | 118 (100.0%) | 326 (95.9%) |
| 6 to 11 Years | 1,176 (93.6%) | 1,582 (94.6%) |
| 12 to 14 Years | 762 (98.7%) | 530 (94.0%) |
| 15 Years | 206 (92.4%) | 205 (100.0%) |
| 16 and 17 Years | 726 (97.8%) | 460 (98.9%) |
| 18 to 24 Years | 1,428 (94.6%) | 1,418 (93.1%) |
| 25 to 34 Years | 2,458 (96.1%) | 2,150 (93.1%) |
| 35 to 44 Years | 1,765 (97.7%) | 2,110 (94.2%) |
| 45 to 54 Years | 2,707 (97.4%) | 2,545 (95.9%) |
| 55 to 64 Years | 2,448 (96.6%) | 2,467 (97.7%) |
| 65 to 74 Years | 1,615 (97.5%) | 1,659 (98.0%) |
| 75 Years and over | 883 (98.7%) | 852 (91.4%) |
| Total | 17,296 (96.6%) | 17,300 (95.4%) |
Income Below Poverty Among Married-Couple Families in Moorpark
The poverty statistics for married-couple families in Moorpark show that 1.4% or 104 of the total 7,585 families live below the poverty line. Families with 3 or 4 children have the highest poverty rate of 2.5%, comprising of 14 families. On the other hand, families with 5 or more children have the lowest poverty rate of 0.0%, which includes 0 families.
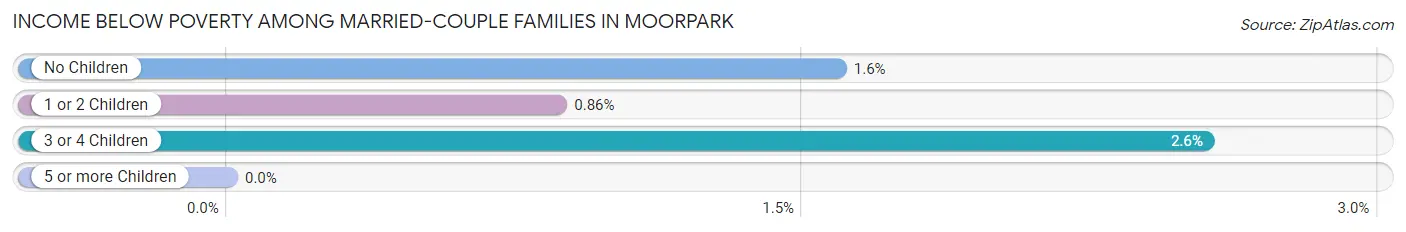
| Children | Above Poverty | Below Poverty |
| No Children | 4,029 (98.4%) | 65 (1.6%) |
| 1 or 2 Children | 2,878 (99.1%) | 25 (0.9%) |
| 3 or 4 Children | 536 (97.5%) | 14 (2.5%) |
| 5 or more Children | 38 (100.0%) | 0 (0.0%) |
| Total | 7,481 (98.6%) | 104 (1.4%) |
Income Below Poverty Among Single-Parent Households in Moorpark
According to the poverty data in Moorpark, 6.6% or 46 single-father households and 13.9% or 114 single-mother households are living below the poverty line. Among single-father households, those with 3 or 4 children have the highest poverty rate, with 26 households (20.2%) experiencing poverty. Likewise, among single-mother households, those with 5 or more children have the highest poverty rate, with 10 households (35.7%) falling below the poverty line.
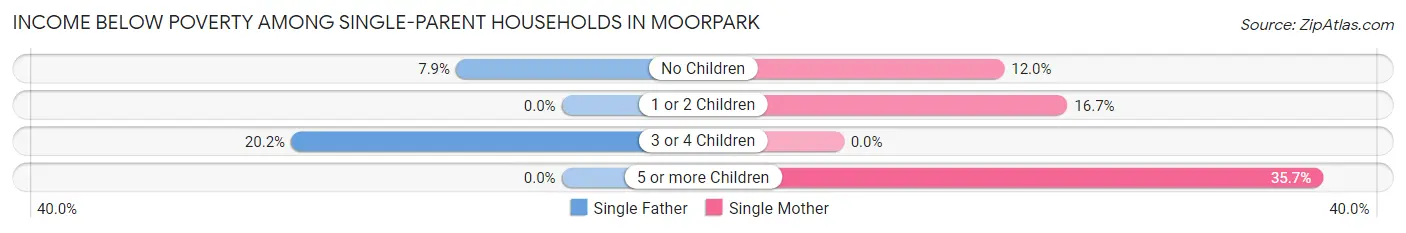
| Children | Single Father | Single Mother |
| No Children | 20 (7.9%) | 51 (12.0%) |
| 1 or 2 Children | 0 (0.0%) | 53 (16.7%) |
| 3 or 4 Children | 26 (20.2%) | 0 (0.0%) |
| 5 or more Children | 0 (0.0%) | 10 (35.7%) |
| Total | 46 (6.6%) | 114 (13.9%) |
Income Below Poverty Among Married-Couple vs Single-Parent Households in Moorpark
The poverty data for Moorpark shows that 104 of the married-couple family households (1.4%) and 160 of the single-parent households (10.5%) are living below the poverty level. Within the married-couple family households, those with 3 or 4 children have the highest poverty rate, with 14 households (2.5%) falling below the poverty line. Among the single-parent households, those with 5 or more children have the highest poverty rate, with 10 household (35.7%) living below poverty.
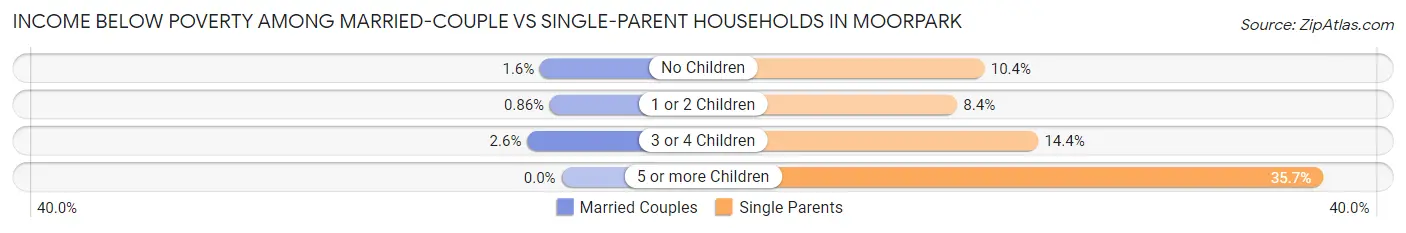
| Children | Married-Couple Families | Single-Parent Households |
| No Children | 65 (1.6%) | 71 (10.4%) |
| 1 or 2 Children | 25 (0.9%) | 53 (8.4%) |
| 3 or 4 Children | 14 (2.5%) | 26 (14.4%) |
| 5 or more Children | 0 (0.0%) | 10 (35.7%) |
| Total | 104 (1.4%) | 160 (10.5%) |
Race in Moorpark
The most populous races in Moorpark are White / Caucasian (23,733 | 65.8%), Hispanic or Latino (11,989 | 33.2%), and Two or more Races (6,005 | 16.7%).
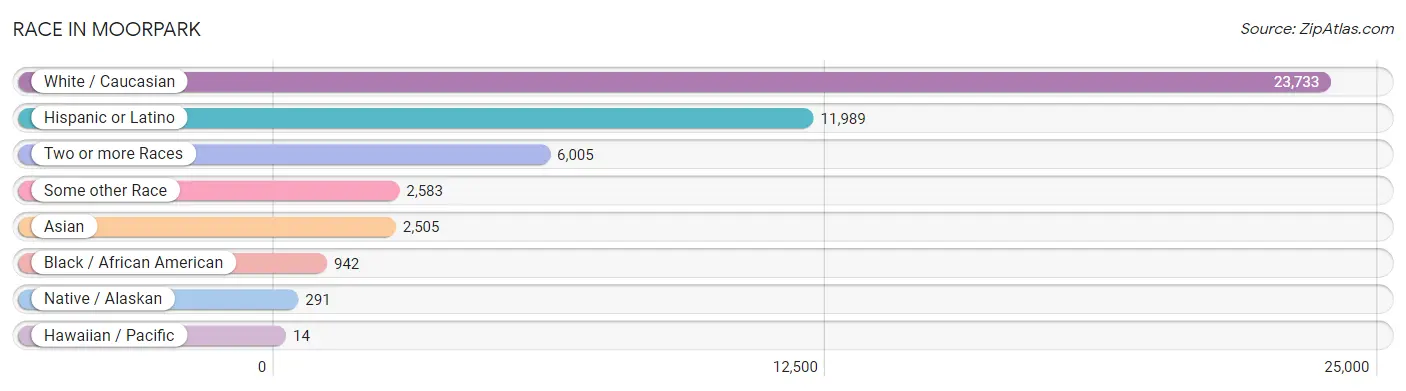
| Race | # Population | % Population |
| Asian | 2,505 | 6.9% |
| Black / African American | 942 | 2.6% |
| Hawaiian / Pacific | 14 | 0.0% |
| Hispanic or Latino | 11,989 | 33.2% |
| Native / Alaskan | 291 | 0.8% |
| White / Caucasian | 23,733 | 65.8% |
| Two or more Races | 6,005 | 16.7% |
| Some other Race | 2,583 | 7.2% |
| Total | 36,073 | 100.0% |
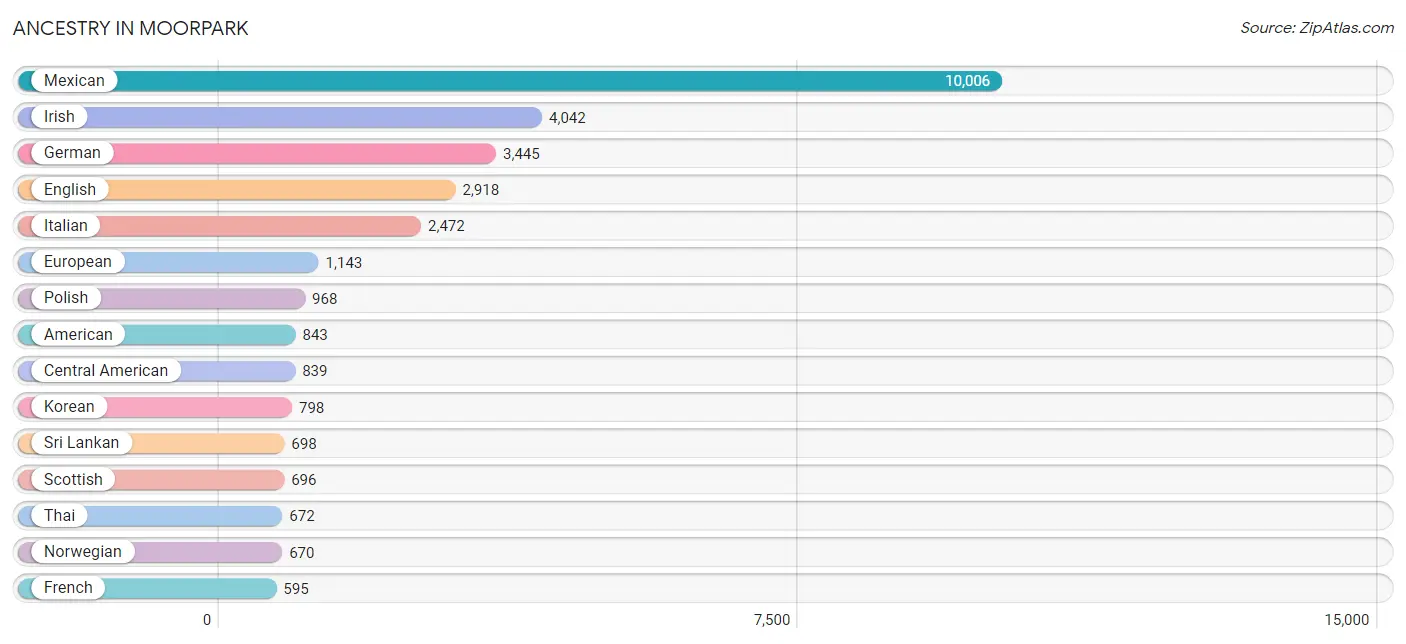
Ancestry in Moorpark
The most populous ancestries reported in Moorpark are Mexican (10,006 | 27.7%), Irish (4,042 | 11.2%), German (3,445 | 9.6%), English (2,918 | 8.1%), and Italian (2,472 | 6.9%), together accounting for 63.4% of all Moorpark residents.
| Ancestry | # Population | % Population |
| African | 49 | 0.1% |
| Aleut | 9 | 0.0% |
| Alsatian | 25 | 0.1% |
| American | 843 | 2.3% |
| Arab | 510 | 1.4% |
| Argentinean | 27 | 0.1% |
| Armenian | 111 | 0.3% |
| Australian | 13 | 0.0% |
| Austrian | 235 | 0.6% |
| Belgian | 119 | 0.3% |
| Bhutanese | 513 | 1.4% |
| Blackfeet | 50 | 0.1% |
| Brazilian | 28 | 0.1% |
| British | 73 | 0.2% |
| British West Indian | 36 | 0.1% |
| Bulgarian | 9 | 0.0% |
| Burmese | 305 | 0.9% |
| Canadian | 113 | 0.3% |
| Central American | 839 | 2.3% |
| Central American Indian | 13 | 0.0% |
| Cherokee | 186 | 0.5% |
| Chilean | 8 | 0.0% |
| Choctaw | 208 | 0.6% |
| Colombian | 39 | 0.1% |
| Costa Rican | 133 | 0.4% |
| Cree | 12 | 0.0% |
| Croatian | 59 | 0.2% |
| Cuban | 118 | 0.3% |
| Czech | 234 | 0.6% |
| Czechoslovakian | 9 | 0.0% |
| Danish | 452 | 1.3% |
| Dutch | 340 | 0.9% |
| Eastern European | 303 | 0.8% |
| Ecuadorian | 72 | 0.2% |
| Egyptian | 210 | 0.6% |
| English | 2,918 | 8.1% |
| European | 1,143 | 3.2% |
| Finnish | 60 | 0.2% |
| French | 595 | 1.7% |
| French Canadian | 105 | 0.3% |
| German | 3,445 | 9.6% |
| Greek | 42 | 0.1% |
| Guamanian / Chamorro | 10 | 0.0% |
| Guatemalan | 91 | 0.3% |
| Honduran | 21 | 0.1% |
| Hungarian | 202 | 0.6% |
| Indian (Asian) | 544 | 1.5% |
| Iranian | 98 | 0.3% |
| Irish | 4,042 | 11.2% |
| Italian | 2,472 | 6.9% |
| Jamaican | 21 | 0.1% |
| Japanese | 124 | 0.3% |
| Korean | 798 | 2.2% |
| Laotian | 37 | 0.1% |
| Latvian | 9 | 0.0% |
| Lebanese | 35 | 0.1% |
| Lithuanian | 193 | 0.5% |
| Macedonian | 21 | 0.1% |
| Mexican | 10,006 | 27.7% |
| Mexican American Indian | 193 | 0.5% |
| Native Hawaiian | 37 | 0.1% |
| Nicaraguan | 13 | 0.0% |
| Nigerian | 68 | 0.2% |
| Northern European | 45 | 0.1% |
| Norwegian | 670 | 1.9% |
| Palestinian | 66 | 0.2% |
| Peruvian | 143 | 0.4% |
| Pima | 36 | 0.1% |
| Polish | 968 | 2.7% |
| Portuguese | 399 | 1.1% |
| Puerto Rican | 54 | 0.2% |
| Romanian | 85 | 0.2% |
| Russian | 504 | 1.4% |
| Salvadoran | 581 | 1.6% |
| Samoan | 13 | 0.0% |
| Scandinavian | 527 | 1.5% |
| Scotch-Irish | 197 | 0.5% |
| Scottish | 696 | 1.9% |
| Serbian | 19 | 0.1% |
| Slavic | 6 | 0.0% |
| Slovak | 39 | 0.1% |
| South American | 304 | 0.8% |
| Spaniard | 65 | 0.2% |
| Spanish | 191 | 0.5% |
| Sri Lankan | 698 | 1.9% |
| Subsaharan African | 126 | 0.4% |
| Swedish | 590 | 1.6% |
| Swiss | 261 | 0.7% |
| Thai | 672 | 1.9% |
| Tohono O'Odham | 25 | 0.1% |
| Turkish | 29 | 0.1% |
| Ukrainian | 62 | 0.2% |
| Uruguayan | 15 | 0.0% |
| Welsh | 60 | 0.2% |
| Yugoslavian | 16 | 0.0% | View All 95 Rows |
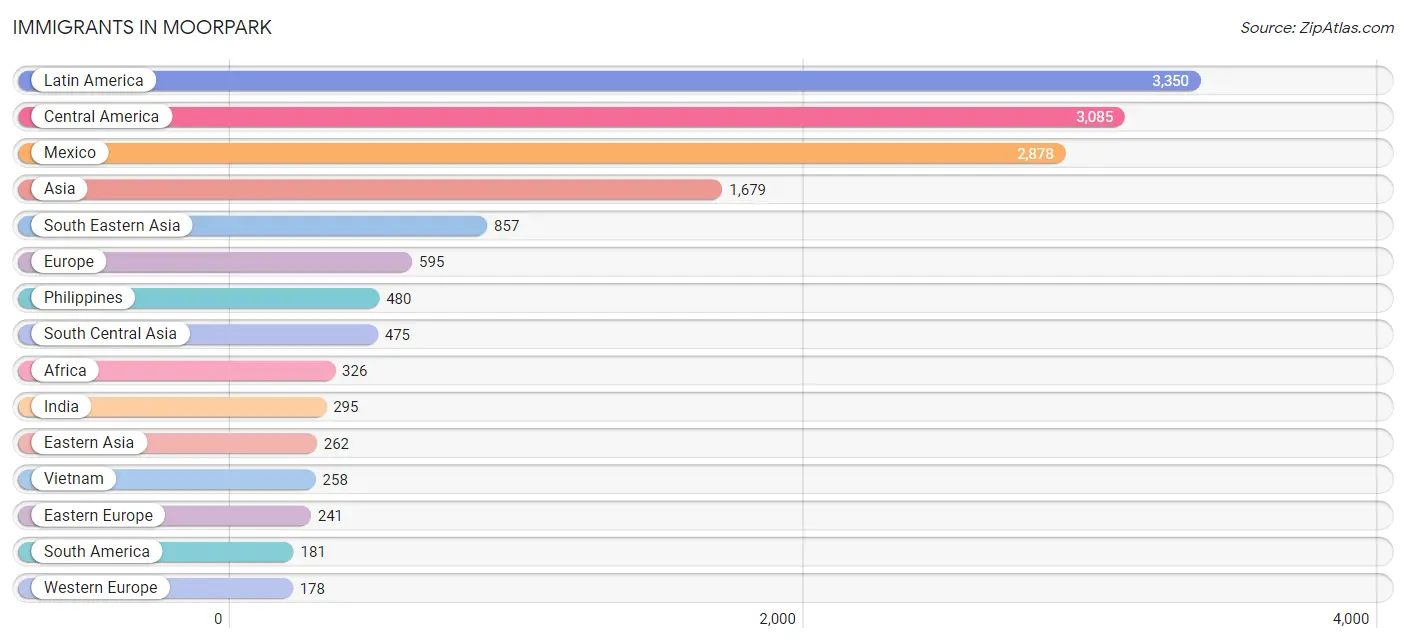
Immigrants in Moorpark
The most numerous immigrant groups reported in Moorpark came from Latin America (3,350 | 9.3%), Central America (3,085 | 8.6%), Mexico (2,878 | 8.0%), Asia (1,679 | 4.6%), and South Eastern Asia (857 | 2.4%), together accounting for 32.8% of all Moorpark residents.
| Immigration Origin | # Population | % Population |
| Africa | 326 | 0.9% |
| Argentina | 8 | 0.0% |
| Asia | 1,679 | 4.6% |
| Australia | 35 | 0.1% |
| Belarus | 32 | 0.1% |
| Belgium | 114 | 0.3% |
| Brazil | 41 | 0.1% |
| Cambodia | 50 | 0.1% |
| Canada | 169 | 0.5% |
| Caribbean | 84 | 0.2% |
| Central America | 3,085 | 8.6% |
| Chile | 7 | 0.0% |
| China | 111 | 0.3% |
| Colombia | 21 | 0.1% |
| Costa Rica | 37 | 0.1% |
| Cuba | 63 | 0.2% |
| Denmark | 7 | 0.0% |
| Eastern Africa | 30 | 0.1% |
| Eastern Asia | 262 | 0.7% |
| Eastern Europe | 241 | 0.7% |
| Ecuador | 32 | 0.1% |
| Egypt | 139 | 0.4% |
| El Salvador | 96 | 0.3% |
| England | 76 | 0.2% |
| Europe | 595 | 1.7% |
| Fiji | 8 | 0.0% |
| France | 26 | 0.1% |
| Germany | 14 | 0.0% |
| Guatemala | 35 | 0.1% |
| Honduras | 21 | 0.1% |
| Hong Kong | 35 | 0.1% |
| Hungary | 20 | 0.1% |
| India | 295 | 0.8% |
| Indonesia | 28 | 0.1% |
| Iran | 123 | 0.3% |
| Ireland | 10 | 0.0% |
| Israel | 20 | 0.1% |
| Italy | 20 | 0.1% |
| Jamaica | 21 | 0.1% |
| Japan | 20 | 0.1% |
| Jordan | 20 | 0.1% |
| Korea | 131 | 0.4% |
| Latin America | 3,350 | 9.3% |
| Lebanon | 29 | 0.1% |
| Mexico | 2,878 | 8.0% |
| Netherlands | 24 | 0.1% |
| Nicaragua | 18 | 0.1% |
| Nigeria | 63 | 0.2% |
| Northern Africa | 139 | 0.4% |
| Northern Europe | 156 | 0.4% |
| Oceania | 43 | 0.1% |
| Pakistan | 27 | 0.1% |
| Peru | 72 | 0.2% |
| Philippines | 480 | 1.3% |
| Poland | 99 | 0.3% |
| Romania | 33 | 0.1% |
| Russia | 42 | 0.1% |
| South America | 181 | 0.5% |
| South Central Asia | 475 | 1.3% |
| South Eastern Asia | 857 | 2.4% |
| Southern Europe | 20 | 0.1% |
| Sri Lanka | 30 | 0.1% |
| Sweden | 35 | 0.1% |
| Taiwan | 1 | 0.0% |
| Thailand | 41 | 0.1% |
| Turkey | 16 | 0.0% |
| Uganda | 30 | 0.1% |
| Ukraine | 15 | 0.0% |
| Vietnam | 258 | 0.7% |
| Western Africa | 157 | 0.4% |
| Western Asia | 85 | 0.2% |
| Western Europe | 178 | 0.5% | View All 72 Rows |
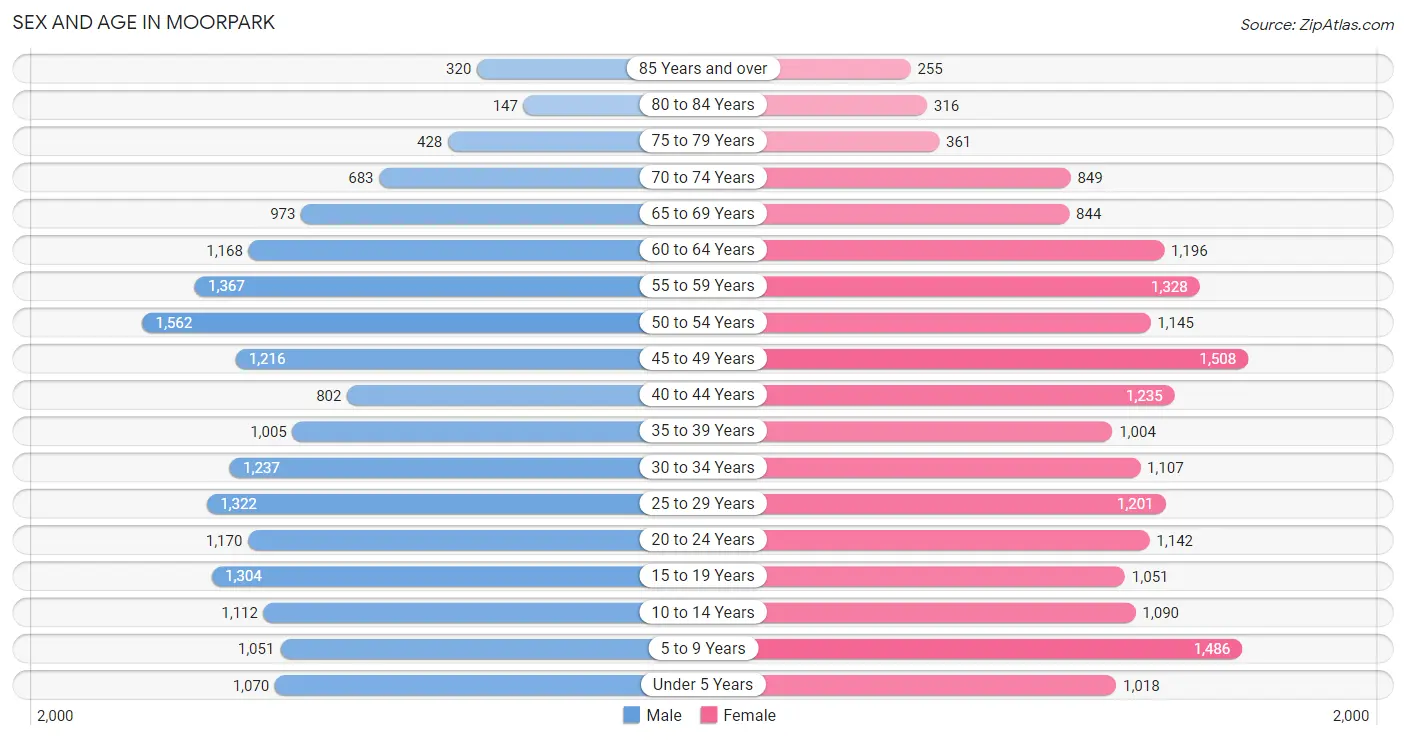
Sex and Age in Moorpark
Sex and Age in Moorpark
The most populous age groups in Moorpark are 50 to 54 Years (1,562 | 8.7%) for men and 45 to 49 Years (1,508 | 8.3%) for women.
| Age Bracket | Male | Female |
| Under 5 Years | 1,070 (6.0%) | 1,018 (5.6%) |
| 5 to 9 Years | 1,051 (5.9%) | 1,486 (8.2%) |
| 10 to 14 Years | 1,112 (6.2%) | 1,090 (6.0%) |
| 15 to 19 Years | 1,304 (7.3%) | 1,051 (5.8%) |
| 20 to 24 Years | 1,170 (6.5%) | 1,142 (6.3%) |
| 25 to 29 Years | 1,322 (7.4%) | 1,201 (6.6%) |
| 30 to 34 Years | 1,237 (6.9%) | 1,107 (6.1%) |
| 35 to 39 Years | 1,005 (5.6%) | 1,004 (5.5%) |
| 40 to 44 Years | 802 (4.5%) | 1,235 (6.8%) |
| 45 to 49 Years | 1,216 (6.8%) | 1,508 (8.3%) |
| 50 to 54 Years | 1,562 (8.7%) | 1,145 (6.3%) |
| 55 to 59 Years | 1,367 (7.6%) | 1,328 (7.3%) |
| 60 to 64 Years | 1,168 (6.5%) | 1,196 (6.6%) |
| 65 to 69 Years | 973 (5.4%) | 844 (4.6%) |
| 70 to 74 Years | 683 (3.8%) | 849 (4.7%) |
| 75 to 79 Years | 428 (2.4%) | 361 (2.0%) |
| 80 to 84 Years | 147 (0.8%) | 316 (1.7%) |
| 85 Years and over | 320 (1.8%) | 255 (1.4%) |
| Total | 17,937 (100.0%) | 18,136 (100.0%) |
Families and Households in Moorpark
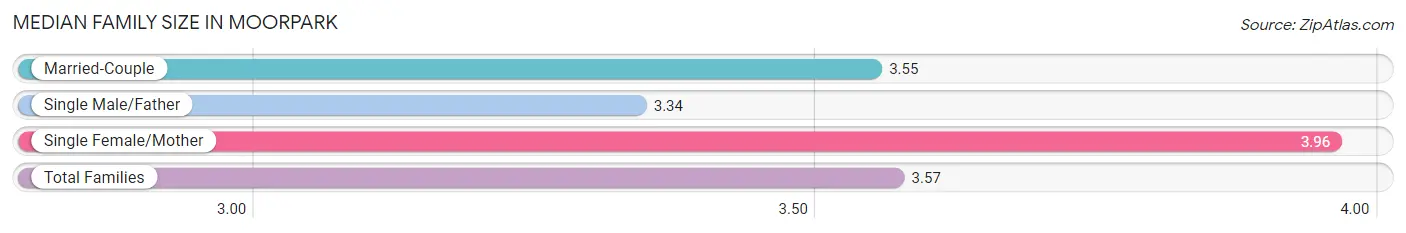
Median Family Size in Moorpark
The median family size in Moorpark is 3.57 persons per family, with single female/mother families (823 | 9.0%) accounting for the largest median family size of 3.96 persons per family. On the other hand, single male/father families (696 | 7.6%) represent the smallest median family size with 3.34 persons per family.
| Family Type | # Families | Family Size |
| Married-Couple | 7,585 (83.3%) | 3.55 |
| Single Male/Father | 696 (7.6%) | 3.34 |
| Single Female/Mother | 823 (9.0%) | 3.96 |
| Total Families | 9,104 (100.0%) | 3.57 |
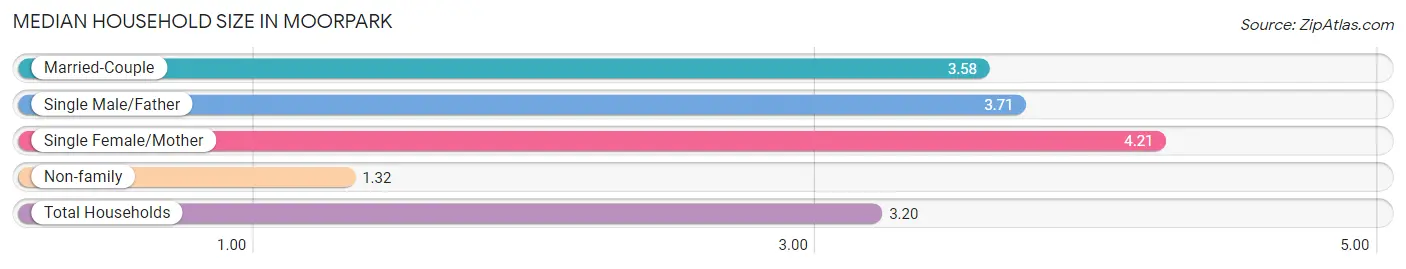
Median Household Size in Moorpark
The median household size in Moorpark is 3.20 persons per household, with single female/mother households (823 | 7.3%) accounting for the largest median household size of 4.21 persons per household. non-family households (2,164 | 19.2%) represent the smallest median household size with 1.32 persons per household.
| Household Type | # Households | Household Size |
| Married-Couple | 7,585 (67.3%) | 3.58 |
| Single Male/Father | 696 (6.2%) | 3.71 |
| Single Female/Mother | 823 (7.3%) | 4.21 |
| Non-family | 2,164 (19.2%) | 1.32 |
| Total Households | 11,268 (100.0%) | 3.20 |
Household Size by Marriage Status in Moorpark
Out of a total of 11,268 households in Moorpark, 9,104 (80.8%) are family households, while 2,164 (19.2%) are nonfamily households. The most numerous type of family households are 2-person households, comprising 2,826, and the most common type of nonfamily households are 1-person households, comprising 1,641.
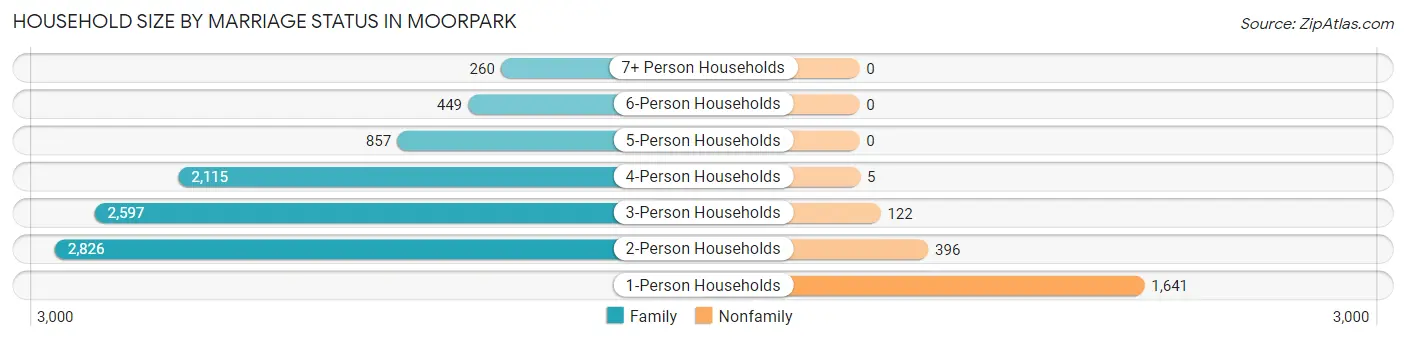
| Household Size | Family Households | Nonfamily Households |
| 1-Person Households | - | 1,641 (14.6%) |
| 2-Person Households | 2,826 (25.1%) | 396 (3.5%) |
| 3-Person Households | 2,597 (23.1%) | 122 (1.1%) |
| 4-Person Households | 2,115 (18.8%) | 5 (0.0%) |
| 5-Person Households | 857 (7.6%) | 0 (0.0%) |
| 6-Person Households | 449 (4.0%) | 0 (0.0%) |
| 7+ Person Households | 260 (2.3%) | 0 (0.0%) |
| Total | 9,104 (80.8%) | 2,164 (19.2%) |
Female Fertility in Moorpark
Fertility by Age in Moorpark
Average fertility rate in Moorpark is 50.0 births per 1,000 women. Women in the age bracket of 20 to 34 years have the highest fertility rate with 60.0 births per 1,000 women. Women in the age bracket of 35 to 50 years acount for 50.6% of all women with births.
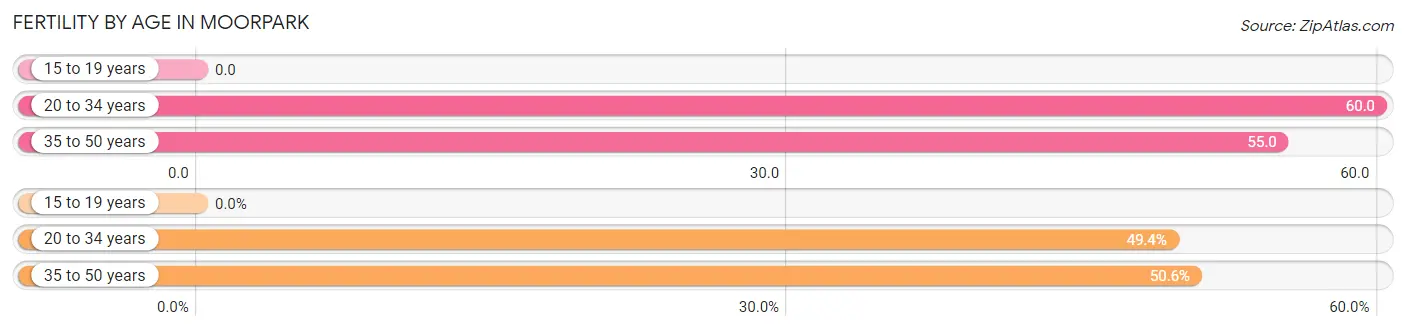
| Age Bracket | Women with Births | Births / 1,000 Women |
| 15 to 19 years | 0 (0.0%) | 0.0 |
| 20 to 34 years | 208 (49.4%) | 60.0 |
| 35 to 50 years | 213 (50.6%) | 55.0 |
| Total | 421 (100.0%) | 50.0 |
Fertility by Age by Marriage Status in Moorpark
90.5% of women with births (421) in Moorpark are married. The highest percentage of unmarried women with births falls into 20 to 34 years age bracket with 11.5% of them unmarried at the time of birth, while the lowest percentage of unmarried women with births belong to 35 to 50 years age bracket with 7.5% of them unmarried.
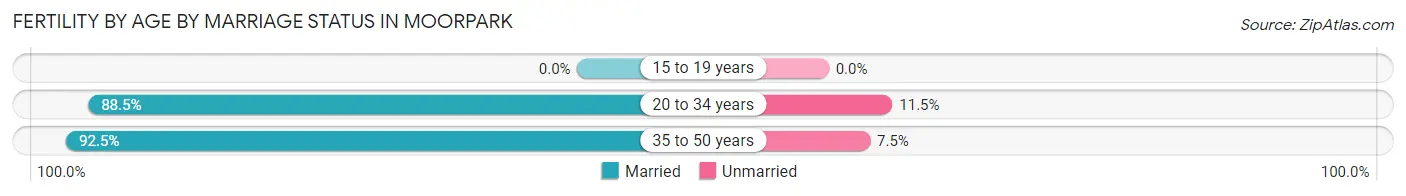
| Age Bracket | Married | Unmarried |
| 15 to 19 years | 0 (0.0%) | 0 (0.0%) |
| 20 to 34 years | 184 (88.5%) | 24 (11.5%) |
| 35 to 50 years | 197 (92.5%) | 16 (7.5%) |
| Total | 381 (90.5%) | 40 (9.5%) |
Fertility by Education in Moorpark
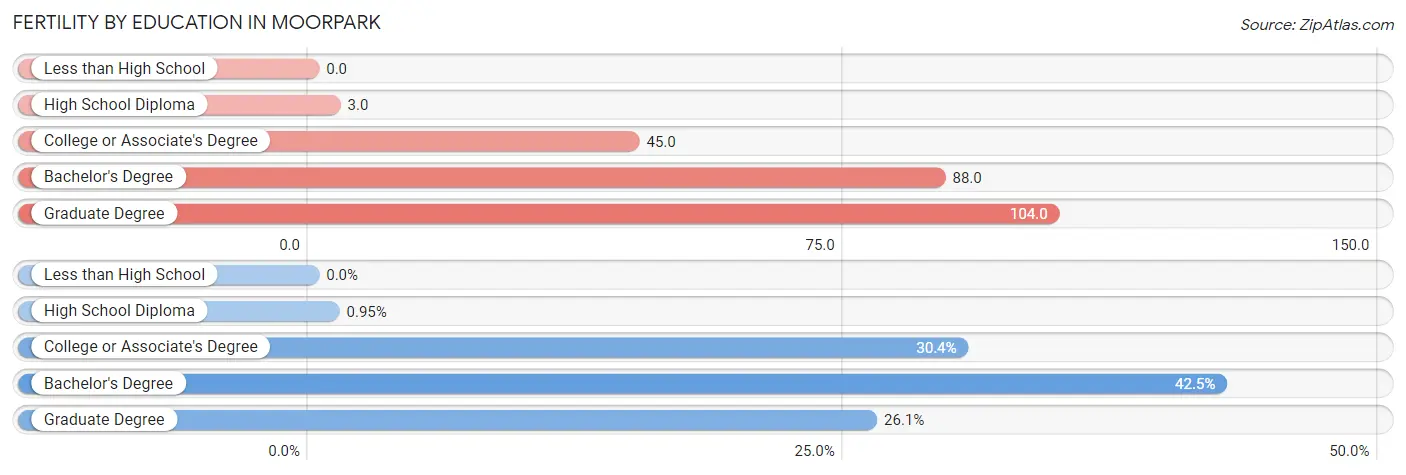
| Educational Attainment | Women with Births | Births / 1,000 Women |
| Less than High School | 0 (0.0%) | 0.0 |
| High School Diploma | 4 (0.9%) | 3.0 |
| College or Associate's Degree | 128 (30.4%) | 45.0 |
| Bachelor's Degree | 179 (42.5%) | 88.0 |
| Graduate Degree | 110 (26.1%) | 104.0 |
| Total | 421 (100.0%) | 50.0 |
Fertility by Education by Marriage Status in Moorpark
9.5% of women with births in Moorpark are unmarried. Women with the educational attainment of high school diploma are most likely to be married with 100.0% of them married at childbirth, while women with the educational attainment of college or associate's degree are least likely to be married with 18.8% of them unmarried at childbirth.
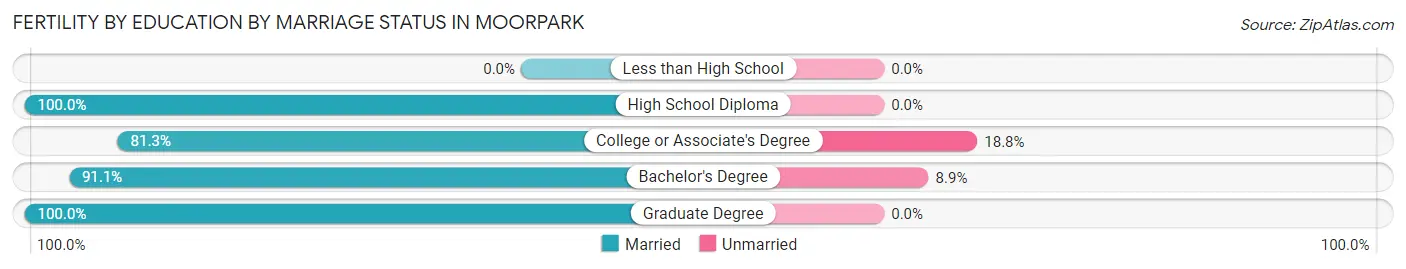
| Educational Attainment | Married | Unmarried |
| Less than High School | 0 (0.0%) | 0 (0.0%) |
| High School Diploma | 4 (100.0%) | 0 (0.0%) |
| College or Associate's Degree | 104 (81.2%) | 24 (18.8%) |
| Bachelor's Degree | 163 (91.1%) | 16 (8.9%) |
| Graduate Degree | 110 (100.0%) | 0 (0.0%) |
| Total | 381 (90.5%) | 40 (9.5%) |
Employment Characteristics in Moorpark
Employment by Class of Employer in Moorpark
Among the 17,813 employed individuals in Moorpark, private company employees (12,349 | 69.3%), local government employees (1,793 | 10.1%), and not-for-profit organizations (1,068 | 6.0%) make up the most common classes of employment.
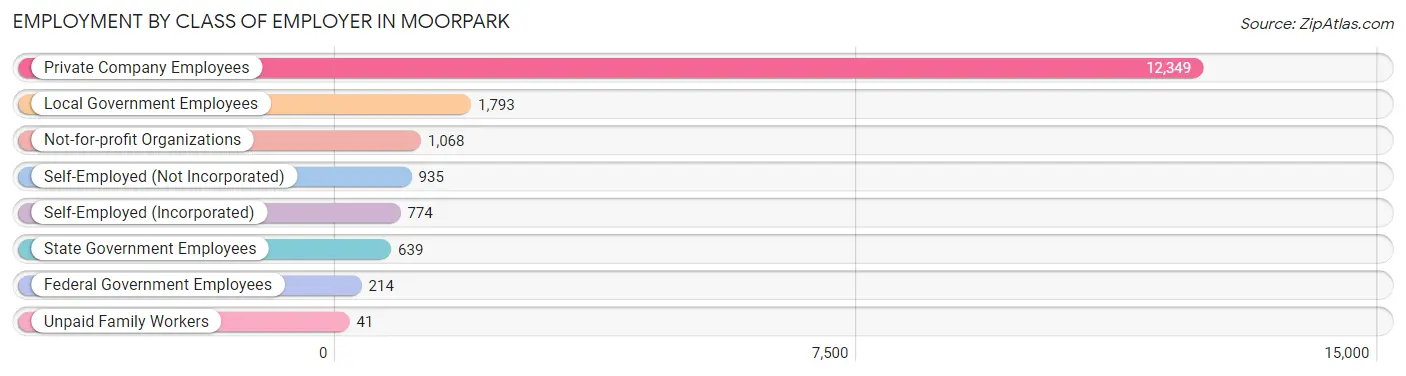
| Employer Class | # Employees | % Employees |
| Private Company Employees | 12,349 | 69.3% |
| Self-Employed (Incorporated) | 774 | 4.3% |
| Self-Employed (Not Incorporated) | 935 | 5.2% |
| Not-for-profit Organizations | 1,068 | 6.0% |
| Local Government Employees | 1,793 | 10.1% |
| State Government Employees | 639 | 3.6% |
| Federal Government Employees | 214 | 1.2% |
| Unpaid Family Workers | 41 | 0.2% |
| Total | 17,813 | 100.0% |
Employment Status by Age in Moorpark
According to the labor force statistics for Moorpark, out of the total population over 16 years of age (28,818), 66.7% or 19,222 individuals are in the labor force, with 5.1% or 980 of them unemployed. The age group with the highest labor force participation rate is 55 to 59 years, with 84.1% or 2,266 individuals in the labor force. Within the labor force, the 16 to 19 years age range has the highest percentage of unemployed individuals, with 17.0% or 94 of them being unemployed.
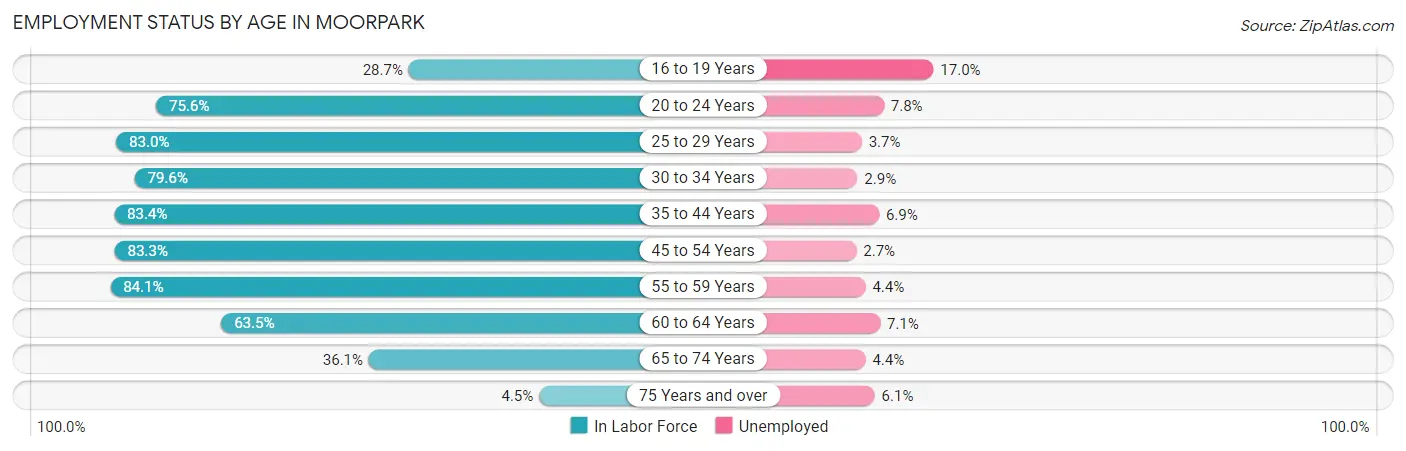
| Age Bracket | In Labor Force | Unemployed |
| 16 to 19 Years | 553 (28.7%) | 94 (17.0%) |
| 20 to 24 Years | 1,748 (75.6%) | 136 (7.8%) |
| 25 to 29 Years | 2,094 (83.0%) | 77 (3.7%) |
| 30 to 34 Years | 1,866 (79.6%) | 54 (2.9%) |
| 35 to 44 Years | 3,374 (83.4%) | 233 (6.9%) |
| 45 to 54 Years | 4,524 (83.3%) | 122 (2.7%) |
| 55 to 59 Years | 2,266 (84.1%) | 100 (4.4%) |
| 60 to 64 Years | 1,501 (63.5%) | 107 (7.1%) |
| 65 to 74 Years | 1,209 (36.1%) | 53 (4.4%) |
| 75 Years and over | 82 (4.5%) | 5 (6.1%) |
| Total | 19,222 (66.7%) | 980 (5.1%) |
Employment Status by Educational Attainment in Moorpark
According to labor force statistics for Moorpark, 80.5% of individuals (15,619) out of the total population between 25 and 64 years of age (19,403) are in the labor force, with 4.4% or 687 of them being unemployed. The group with the highest labor force participation rate are those with the educational attainment of bachelor's degree or higher, with 84.5% or 7,382 individuals in the labor force. Within the labor force, individuals with less than high school education have the highest percentage of unemployment, with 6.5% or 85 of them being unemployed.
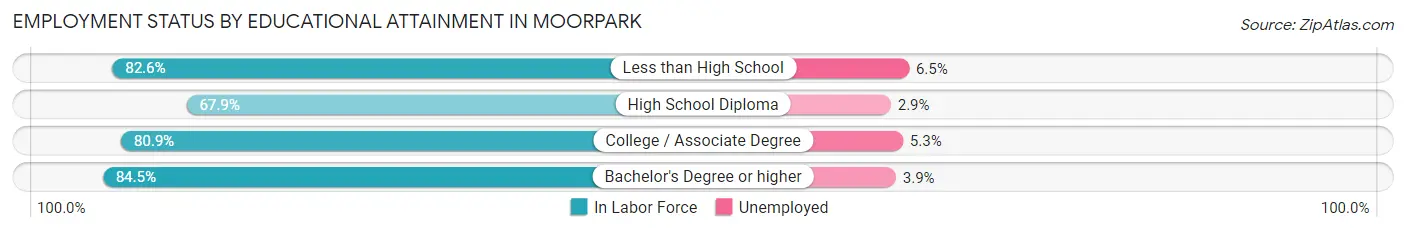
| Educational Attainment | In Labor Force | Unemployed |
| Less than High School | 1,308 (82.6%) | 103 (6.5%) |
| High School Diploma | 2,153 (67.9%) | 92 (2.9%) |
| College / Associate Degree | 4,784 (80.9%) | 313 (5.3%) |
| Bachelor's Degree or higher | 7,382 (84.5%) | 341 (3.9%) |
| Total | 15,619 (80.5%) | 854 (4.4%) |
Employment Occupations by Sex in Moorpark
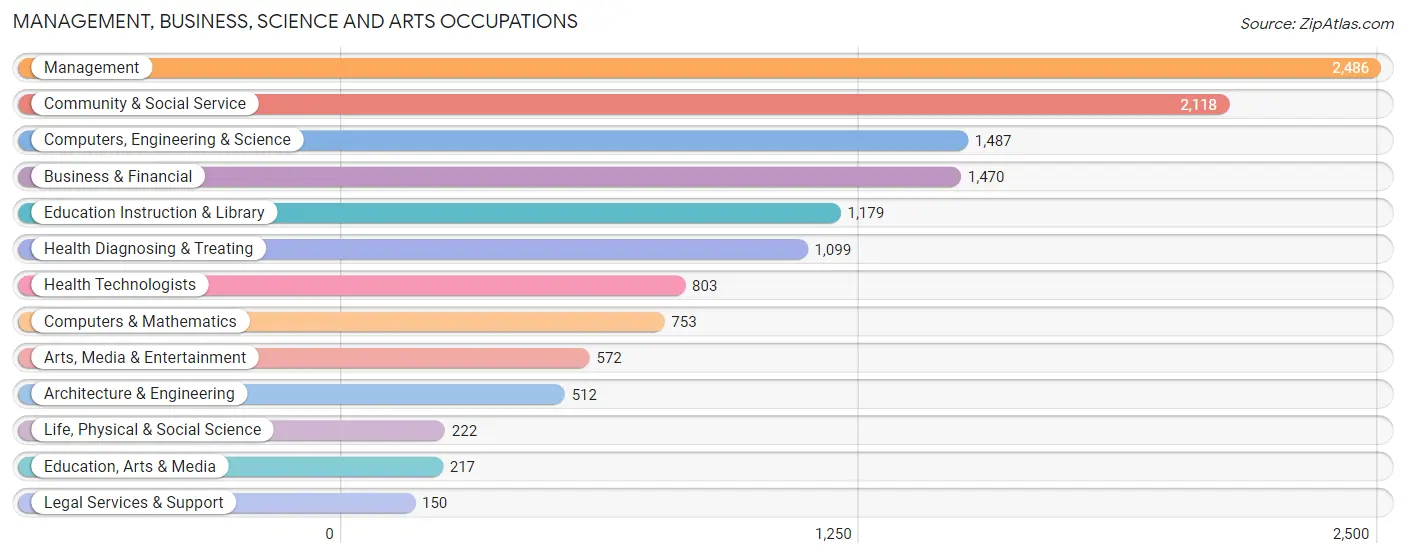
Management, Business, Science and Arts Occupations
The most common Management, Business, Science and Arts occupations in Moorpark are Management (2,486 | 13.6%), Community & Social Service (2,118 | 11.6%), Computers, Engineering & Science (1,487 | 8.2%), Business & Financial (1,470 | 8.1%), and Education Instruction & Library (1,179 | 6.5%).
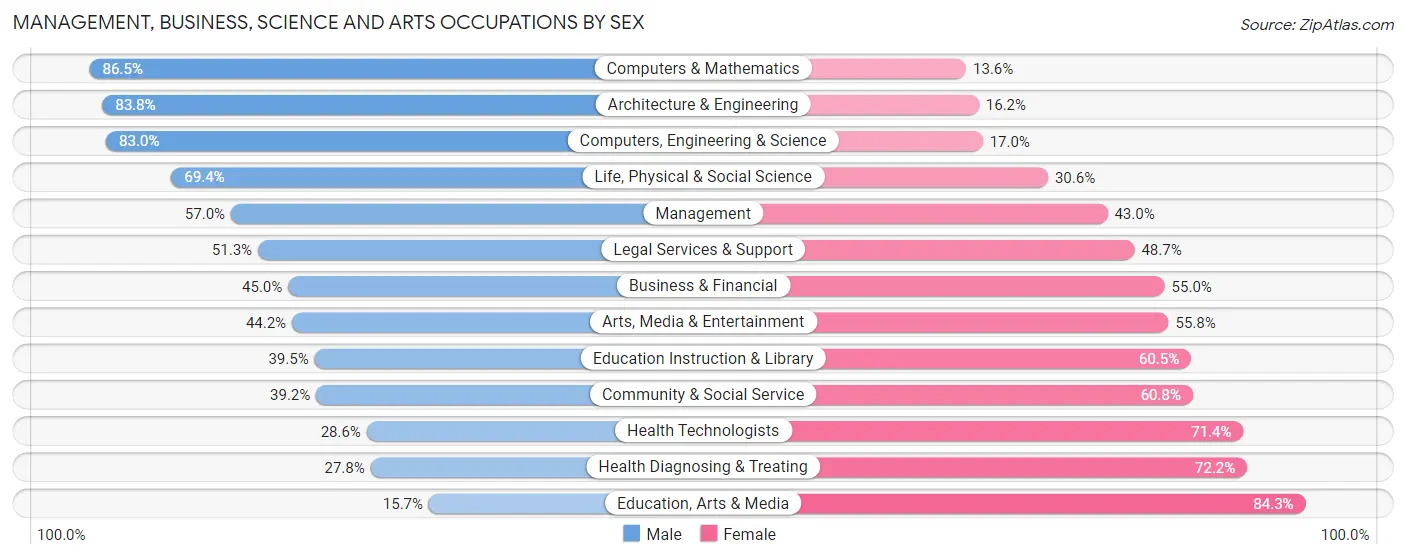
Management, Business, Science and Arts Occupations by Sex
Within the Management, Business, Science and Arts occupations in Moorpark, the most male-oriented occupations are Computers & Mathematics (86.5%), Architecture & Engineering (83.8%), and Computers, Engineering & Science (83.0%), while the most female-oriented occupations are Education, Arts & Media (84.3%), Health Diagnosing & Treating (72.2%), and Health Technologists (71.4%).
| Occupation | Male | Female |
| Management | 1,416 (57.0%) | 1,070 (43.0%) |
| Business & Financial | 662 (45.0%) | 808 (55.0%) |
| Computers, Engineering & Science | 1,234 (83.0%) | 253 (17.0%) |
| Computers & Mathematics | 651 (86.5%) | 102 (13.6%) |
| Architecture & Engineering | 429 (83.8%) | 83 (16.2%) |
| Life, Physical & Social Science | 154 (69.4%) | 68 (30.6%) |
| Community & Social Service | 830 (39.2%) | 1,288 (60.8%) |
| Education, Arts & Media | 34 (15.7%) | 183 (84.3%) |
| Legal Services & Support | 77 (51.3%) | 73 (48.7%) |
| Education Instruction & Library | 466 (39.5%) | 713 (60.5%) |
| Arts, Media & Entertainment | 253 (44.2%) | 319 (55.8%) |
| Health Diagnosing & Treating | 306 (27.8%) | 793 (72.2%) |
| Health Technologists | 230 (28.6%) | 573 (71.4%) |
| Total (Category) | 4,448 (51.4%) | 4,212 (48.6%) |
| Total (Overall) | 9,996 (54.9%) | 8,225 (45.1%) |
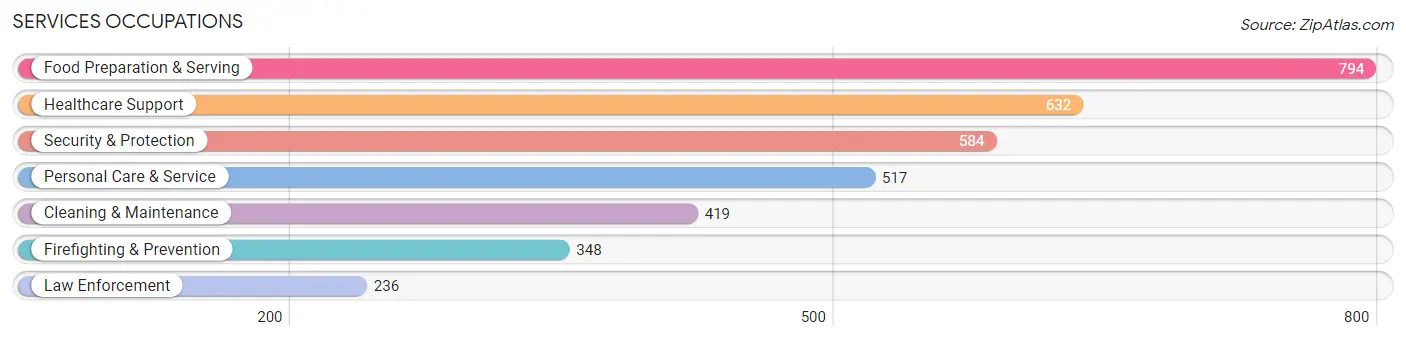
Services Occupations
The most common Services occupations in Moorpark are Food Preparation & Serving (794 | 4.4%), Healthcare Support (632 | 3.5%), Security & Protection (584 | 3.2%), Personal Care & Service (517 | 2.8%), and Cleaning & Maintenance (419 | 2.3%).
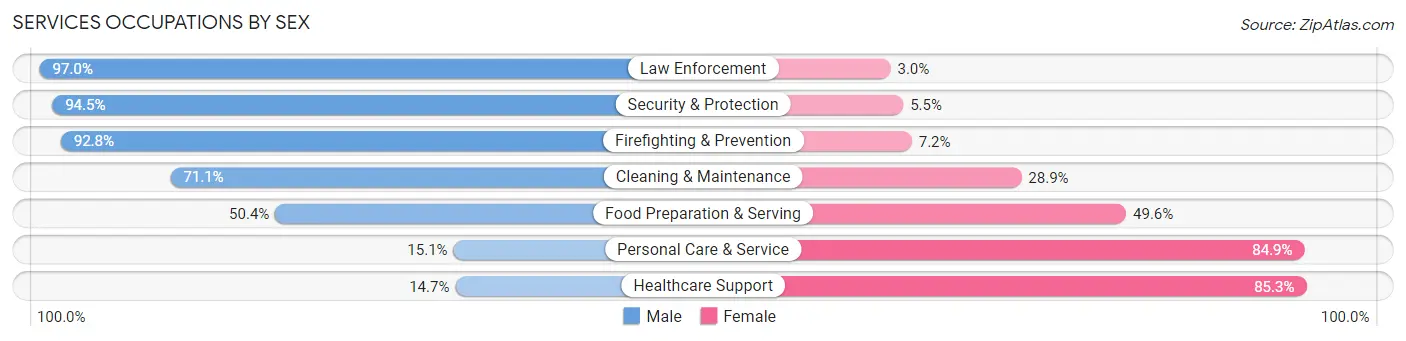
Services Occupations by Sex
Within the Services occupations in Moorpark, the most male-oriented occupations are Law Enforcement (97.0%), Security & Protection (94.5%), and Firefighting & Prevention (92.8%), while the most female-oriented occupations are Healthcare Support (85.3%), Personal Care & Service (84.9%), and Food Preparation & Serving (49.6%).
| Occupation | Male | Female |
| Healthcare Support | 93 (14.7%) | 539 (85.3%) |
| Security & Protection | 552 (94.5%) | 32 (5.5%) |
| Firefighting & Prevention | 323 (92.8%) | 25 (7.2%) |
| Law Enforcement | 229 (97.0%) | 7 (3.0%) |
| Food Preparation & Serving | 400 (50.4%) | 394 (49.6%) |
| Cleaning & Maintenance | 298 (71.1%) | 121 (28.9%) |
| Personal Care & Service | 78 (15.1%) | 439 (84.9%) |
| Total (Category) | 1,421 (48.2%) | 1,525 (51.8%) |
| Total (Overall) | 9,996 (54.9%) | 8,225 (45.1%) |
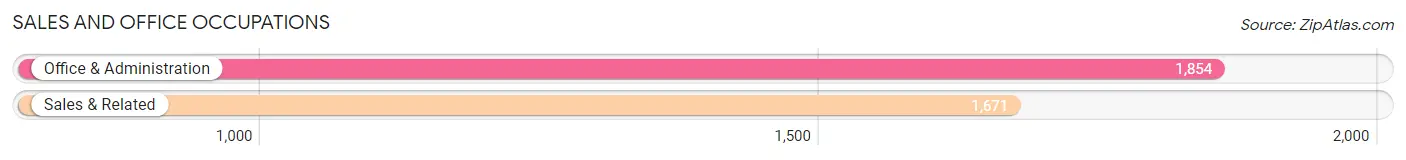
Sales and Office Occupations
The most common Sales and Office occupations in Moorpark are Office & Administration (1,854 | 10.2%), and Sales & Related (1,671 | 9.2%).
Sales and Office Occupations by Sex
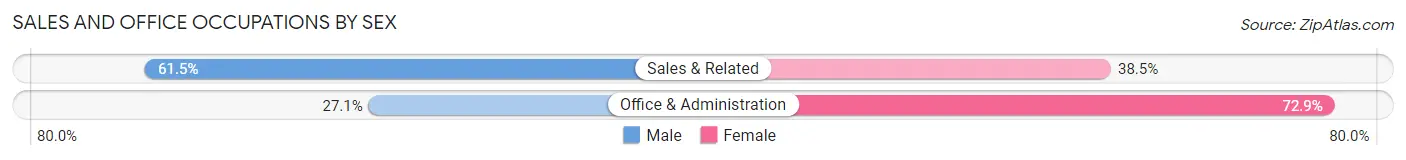
| Occupation | Male | Female |
| Sales & Related | 1,027 (61.5%) | 644 (38.5%) |
| Office & Administration | 502 (27.1%) | 1,352 (72.9%) |
| Total (Category) | 1,529 (43.4%) | 1,996 (56.6%) |
| Total (Overall) | 9,996 (54.9%) | 8,225 (45.1%) |
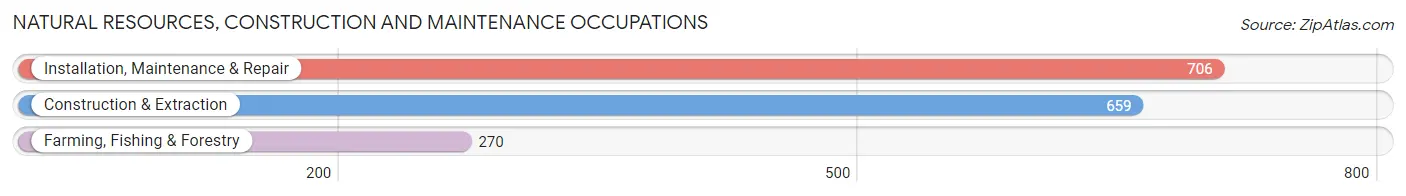
Natural Resources, Construction and Maintenance Occupations
The most common Natural Resources, Construction and Maintenance occupations in Moorpark are Installation, Maintenance & Repair (706 | 3.9%), Construction & Extraction (659 | 3.6%), and Farming, Fishing & Forestry (270 | 1.5%).
Natural Resources, Construction and Maintenance Occupations by Sex
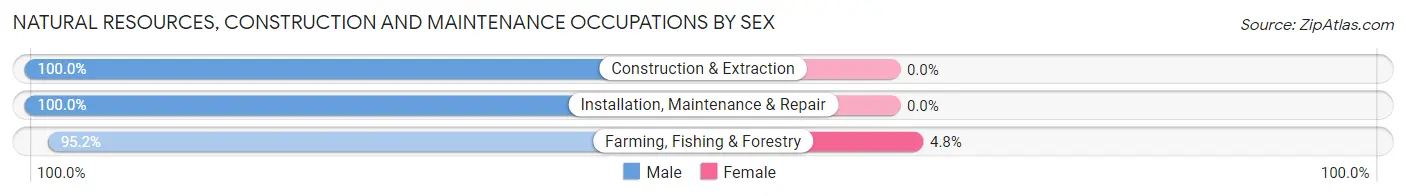
| Occupation | Male | Female |
| Farming, Fishing & Forestry | 257 (95.2%) | 13 (4.8%) |
| Construction & Extraction | 659 (100.0%) | 0 (0.0%) |
| Installation, Maintenance & Repair | 706 (100.0%) | 0 (0.0%) |
| Total (Category) | 1,622 (99.2%) | 13 (0.8%) |
| Total (Overall) | 9,996 (54.9%) | 8,225 (45.1%) |
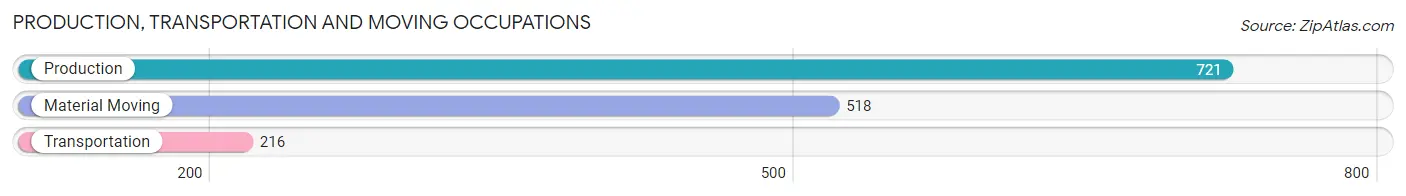
Production, Transportation and Moving Occupations
The most common Production, Transportation and Moving occupations in Moorpark are Production (721 | 4.0%), Material Moving (518 | 2.8%), and Transportation (216 | 1.2%).
Production, Transportation and Moving Occupations by Sex
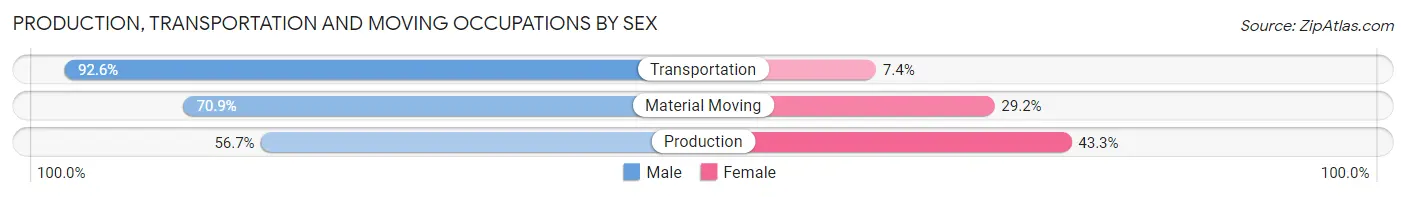
| Occupation | Male | Female |
| Production | 409 (56.7%) | 312 (43.3%) |
| Transportation | 200 (92.6%) | 16 (7.4%) |
| Material Moving | 367 (70.9%) | 151 (29.1%) |
| Total (Category) | 976 (67.1%) | 479 (32.9%) |
| Total (Overall) | 9,996 (54.9%) | 8,225 (45.1%) |
Employment Industries by Sex in Moorpark
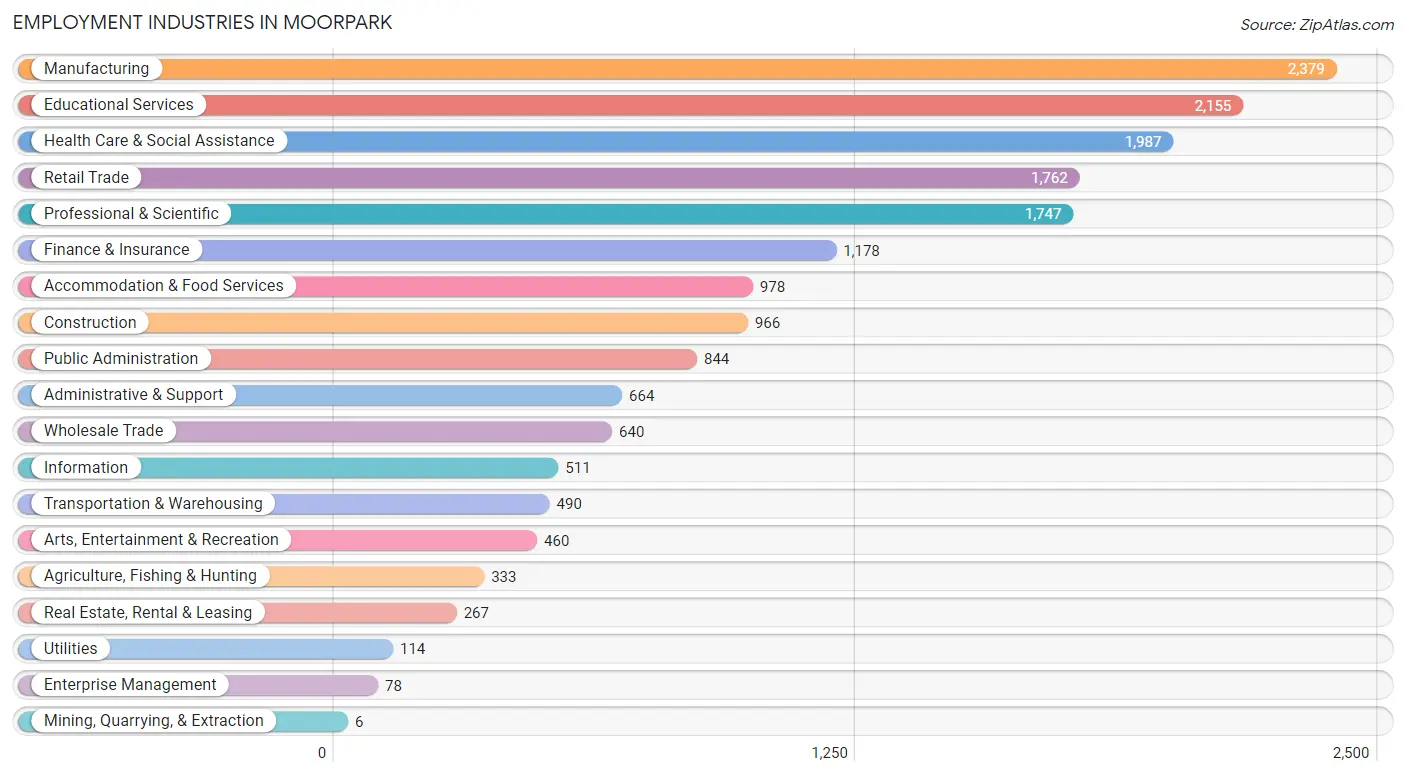
Employment Industries in Moorpark
The major employment industries in Moorpark include Manufacturing (2,379 | 13.1%), Educational Services (2,155 | 11.8%), Health Care & Social Assistance (1,987 | 10.9%), Retail Trade (1,762 | 9.7%), and Professional & Scientific (1,747 | 9.6%).
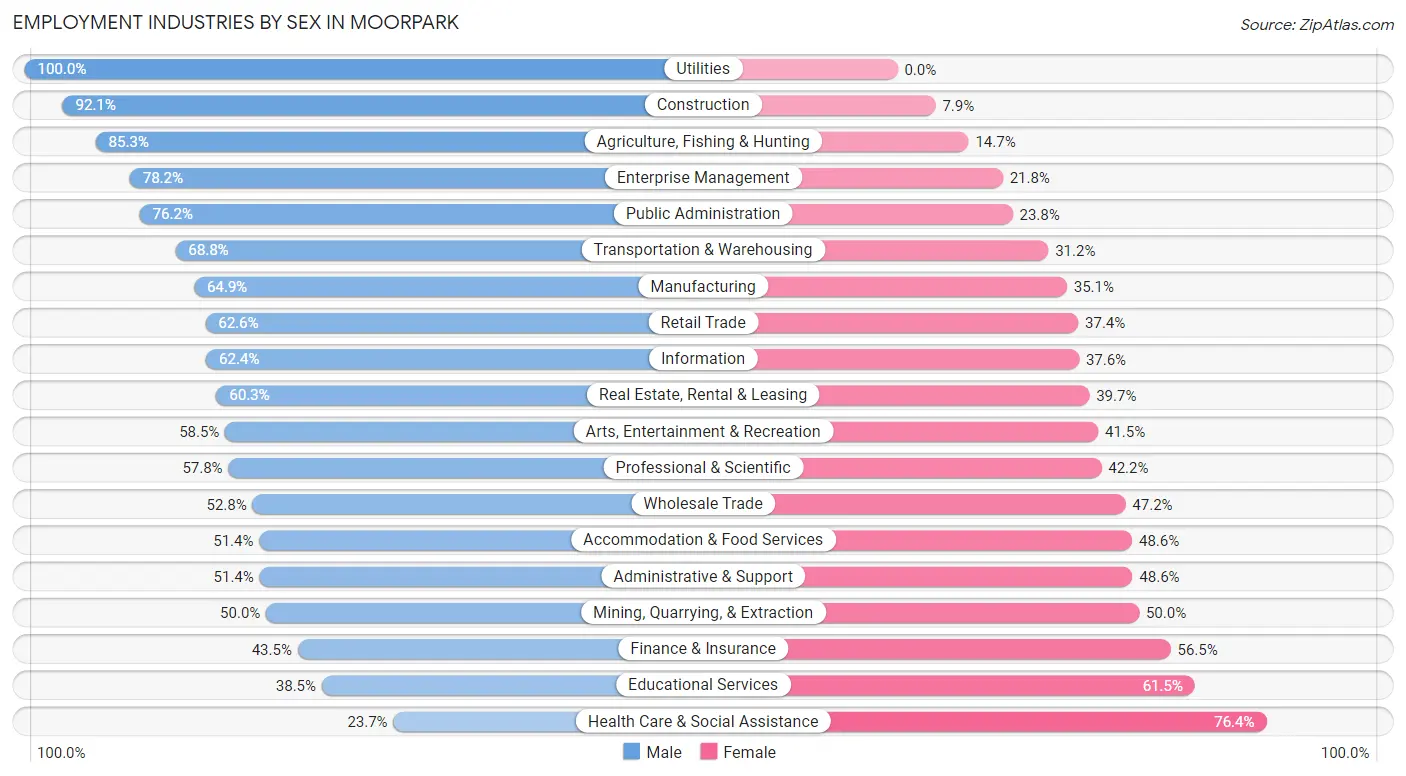
Employment Industries by Sex in Moorpark
The Moorpark industries that see more men than women are Utilities (100.0%), Construction (92.1%), and Agriculture, Fishing & Hunting (85.3%), whereas the industries that tend to have a higher number of women are Health Care & Social Assistance (76.3%), Educational Services (61.5%), and Finance & Insurance (56.5%).
| Industry | Male | Female |
| Agriculture, Fishing & Hunting | 284 (85.3%) | 49 (14.7%) |
| Mining, Quarrying, & Extraction | 3 (50.0%) | 3 (50.0%) |
| Construction | 890 (92.1%) | 76 (7.9%) |
| Manufacturing | 1,545 (64.9%) | 834 (35.1%) |
| Wholesale Trade | 338 (52.8%) | 302 (47.2%) |
| Retail Trade | 1,103 (62.6%) | 659 (37.4%) |
| Transportation & Warehousing | 337 (68.8%) | 153 (31.2%) |
| Utilities | 114 (100.0%) | 0 (0.0%) |
| Information | 319 (62.4%) | 192 (37.6%) |
| Finance & Insurance | 512 (43.5%) | 666 (56.5%) |
| Real Estate, Rental & Leasing | 161 (60.3%) | 106 (39.7%) |
| Professional & Scientific | 1,010 (57.8%) | 737 (42.2%) |
| Enterprise Management | 61 (78.2%) | 17 (21.8%) |
| Administrative & Support | 341 (51.4%) | 323 (48.6%) |
| Educational Services | 829 (38.5%) | 1,326 (61.5%) |
| Health Care & Social Assistance | 470 (23.6%) | 1,517 (76.3%) |
| Arts, Entertainment & Recreation | 269 (58.5%) | 191 (41.5%) |
| Accommodation & Food Services | 503 (51.4%) | 475 (48.6%) |
| Public Administration | 643 (76.2%) | 201 (23.8%) |
| Total | 9,996 (54.9%) | 8,225 (45.1%) |
Education in Moorpark
School Enrollment in Moorpark
The most common levels of schooling among the 9,177 students in Moorpark are college / undergraduate (1,998 | 21.8%), high school (1,920 | 20.9%), and elementary school (1,741 | 19.0%).
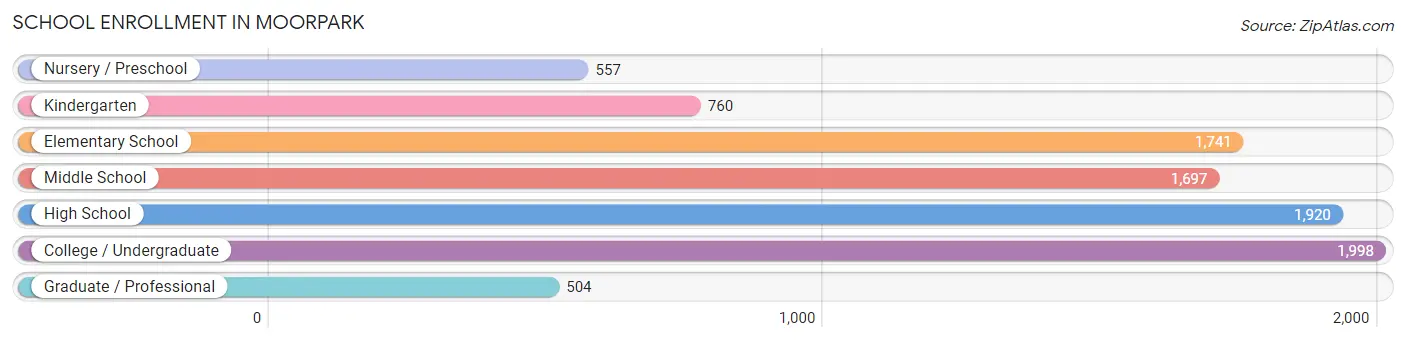
| School Level | # Students | % Students |
| Nursery / Preschool | 557 | 6.1% |
| Kindergarten | 760 | 8.3% |
| Elementary School | 1,741 | 19.0% |
| Middle School | 1,697 | 18.5% |
| High School | 1,920 | 20.9% |
| College / Undergraduate | 1,998 | 21.8% |
| Graduate / Professional | 504 | 5.5% |
| Total | 9,177 | 100.0% |
School Enrollment by Age by Funding Source in Moorpark
Out of a total of 9,177 students who are enrolled in schools in Moorpark, 1,184 (12.9%) attend a private institution, while the remaining 7,993 (87.1%) are enrolled in public schools. The age group of 35 years and over has the highest likelihood of being enrolled in private schools, with 225 (58.4% in the age bracket) enrolled. Conversely, the age group of 18 to 19 year olds has the lowest likelihood of being enrolled in a private school, with 529 (97.1% in the age bracket) attending a public institution.
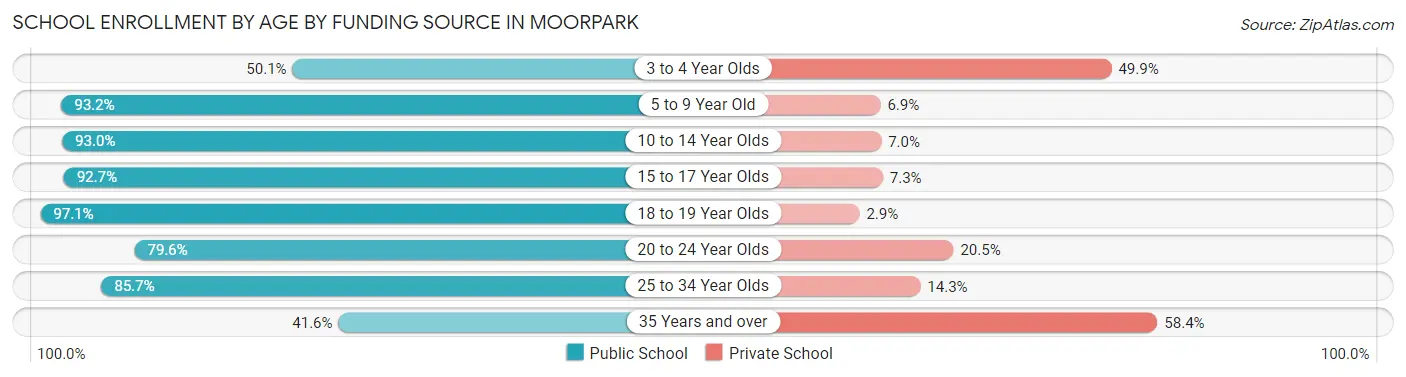
| Age Bracket | Public School | Private School |
| 3 to 4 Year Olds | 211 (50.1%) | 210 (49.9%) |
| 5 to 9 Year Old | 2,271 (93.1%) | 167 (6.9%) |
| 10 to 14 Year Olds | 1,983 (93.0%) | 149 (7.0%) |
| 15 to 17 Year Olds | 1,472 (92.7%) | 116 (7.3%) |
| 18 to 19 Year Olds | 529 (97.1%) | 16 (2.9%) |
| 20 to 24 Year Olds | 809 (79.5%) | 208 (20.4%) |
| 25 to 34 Year Olds | 558 (85.7%) | 93 (14.3%) |
| 35 Years and over | 160 (41.6%) | 225 (58.4%) |
| Total | 7,993 (87.1%) | 1,184 (12.9%) |
Educational Attainment by Field of Study in Moorpark
Business (2,165 | 18.9%), engineering (1,158 | 10.1%), science & technology (1,071 | 9.4%), social sciences (979 | 8.6%), and arts & humanities (886 | 7.7%) are the most common fields of study among 11,445 individuals in Moorpark who have obtained a bachelor's degree or higher.
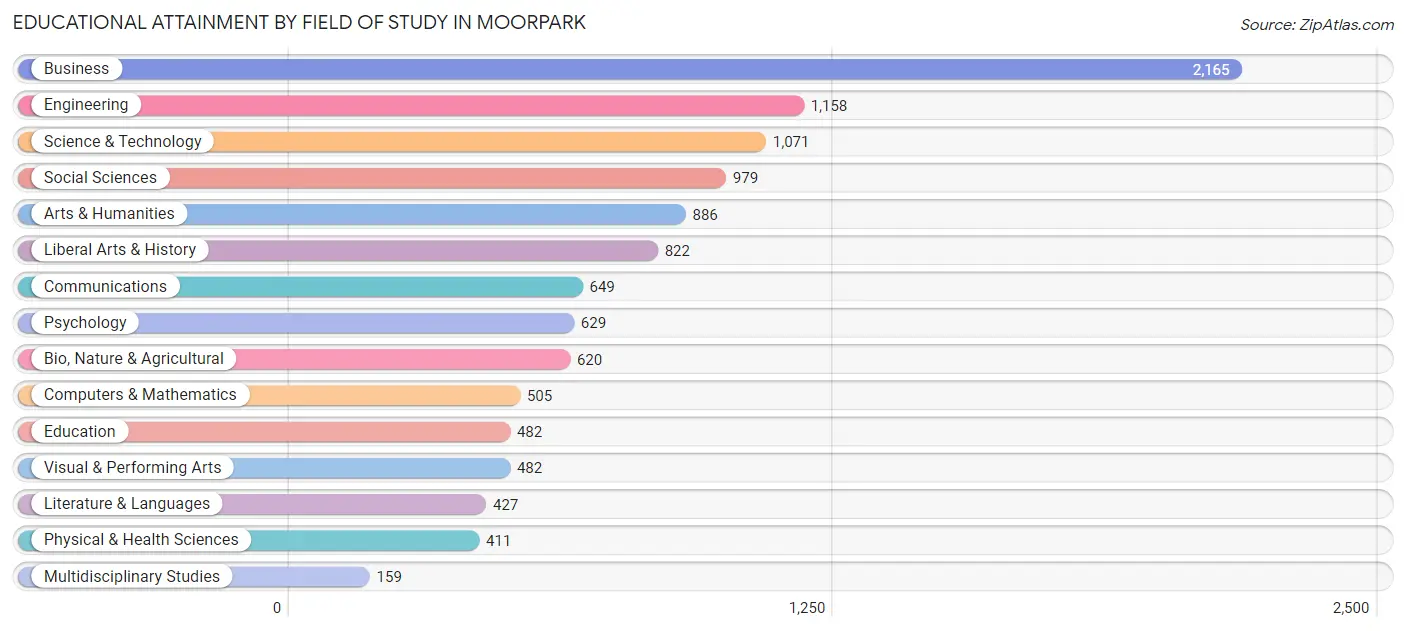
| Field of Study | # Graduates | % Graduates |
| Computers & Mathematics | 505 | 4.4% |
| Bio, Nature & Agricultural | 620 | 5.4% |
| Physical & Health Sciences | 411 | 3.6% |
| Psychology | 629 | 5.5% |
| Social Sciences | 979 | 8.6% |
| Engineering | 1,158 | 10.1% |
| Multidisciplinary Studies | 159 | 1.4% |
| Science & Technology | 1,071 | 9.4% |
| Business | 2,165 | 18.9% |
| Education | 482 | 4.2% |
| Literature & Languages | 427 | 3.7% |
| Liberal Arts & History | 822 | 7.2% |
| Visual & Performing Arts | 482 | 4.2% |
| Communications | 649 | 5.7% |
| Arts & Humanities | 886 | 7.7% |
| Total | 11,445 | 100.0% |
Transportation & Commute in Moorpark
Vehicle Availability by Sex in Moorpark
The most prevalent vehicle ownership categories in Moorpark are males with 2 vehicles (3,654, accounting for 37.0%) and females with 2 vehicles (2,890, making up 46.0%).
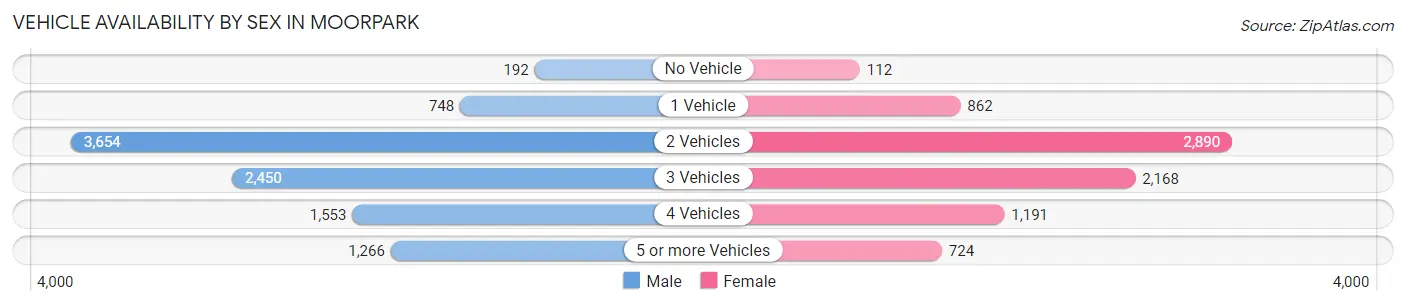
| Vehicles Available | Male | Female |
| No Vehicle | 192 (1.9%) | 112 (1.4%) |
| 1 Vehicle | 748 (7.6%) | 862 (10.8%) |
| 2 Vehicles | 3,654 (37.0%) | 2,890 (36.4%) |
| 3 Vehicles | 2,450 (24.8%) | 2,168 (27.3%) |
| 4 Vehicles | 1,553 (15.8%) | 1,191 (15.0%) |
| 5 or more Vehicles | 1,266 (12.8%) | 724 (9.1%) |
| Total | 9,863 (100.0%) | 7,947 (100.0%) |
Commute Time in Moorpark
The most frequently occuring commute durations in Moorpark are 20 to 24 minutes (2,253 commuters, 15.0%), 15 to 19 minutes (2,091 commuters, 14.0%), and 30 to 34 minutes (2,047 commuters, 13.7%).
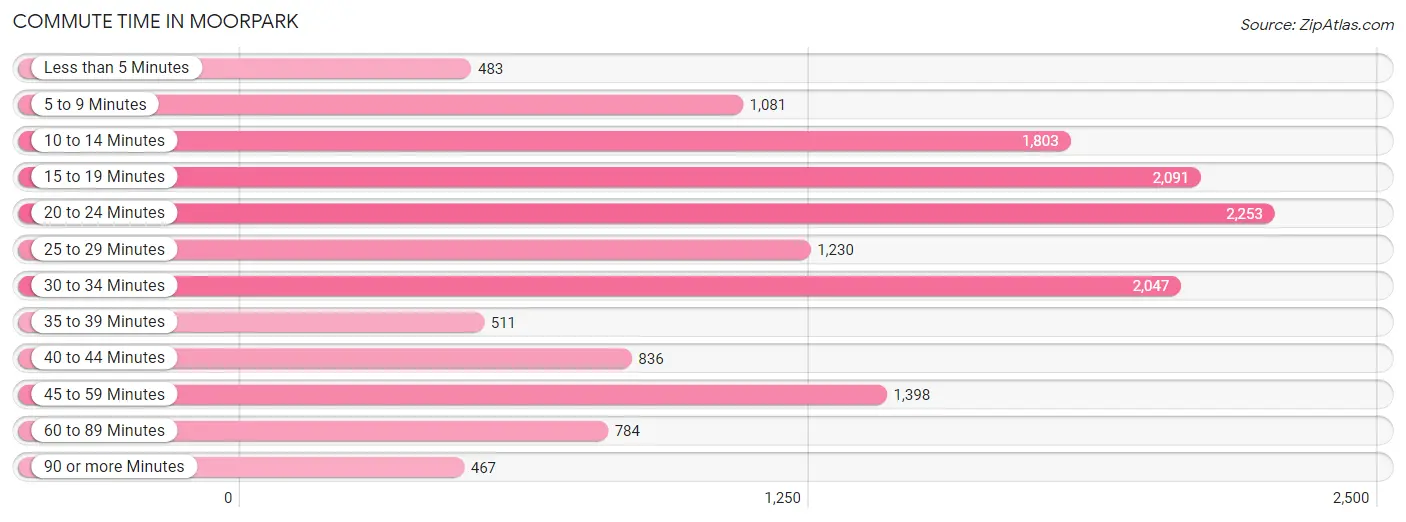
| Commute Time | # Commuters | % Commuters |
| Less than 5 Minutes | 483 | 3.2% |
| 5 to 9 Minutes | 1,081 | 7.2% |
| 10 to 14 Minutes | 1,803 | 12.0% |
| 15 to 19 Minutes | 2,091 | 14.0% |
| 20 to 24 Minutes | 2,253 | 15.0% |
| 25 to 29 Minutes | 1,230 | 8.2% |
| 30 to 34 Minutes | 2,047 | 13.7% |
| 35 to 39 Minutes | 511 | 3.4% |
| 40 to 44 Minutes | 836 | 5.6% |
| 45 to 59 Minutes | 1,398 | 9.3% |
| 60 to 89 Minutes | 784 | 5.2% |
| 90 or more Minutes | 467 | 3.1% |
Commute Time by Sex in Moorpark
The most common commute times in Moorpark are 20 to 24 minutes (1,210 commuters, 14.3%) for males and 15 to 19 minutes (1,099 commuters, 16.8%) for females.
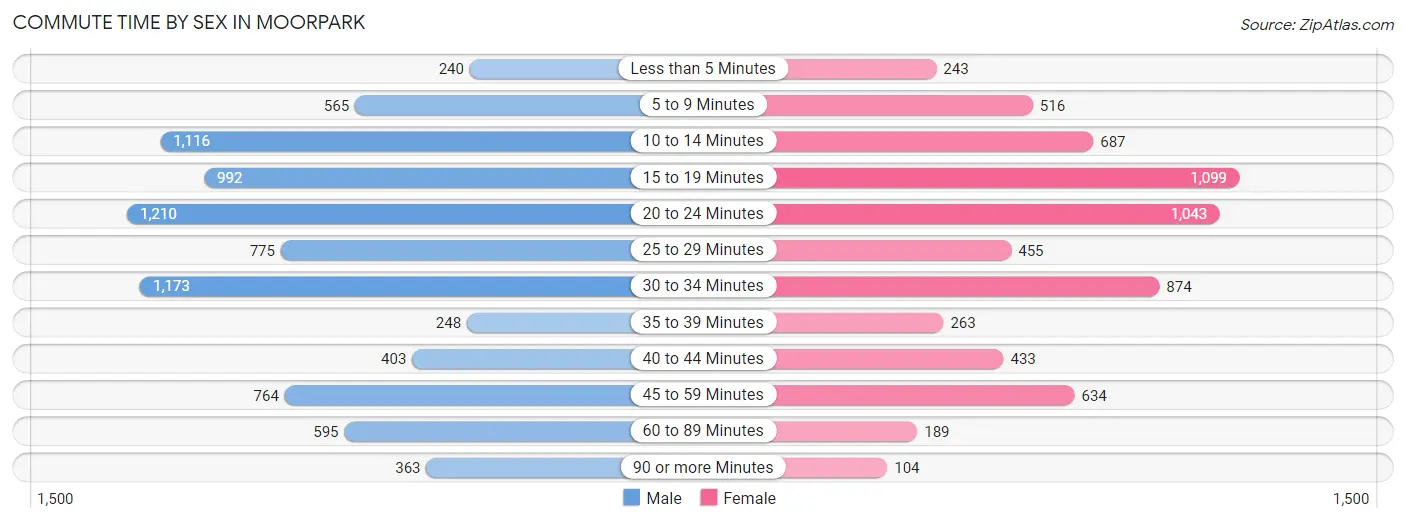
| Commute Time | Male | Female |
| Less than 5 Minutes | 240 (2.8%) | 243 (3.7%) |
| 5 to 9 Minutes | 565 (6.7%) | 516 (7.9%) |
| 10 to 14 Minutes | 1,116 (13.2%) | 687 (10.5%) |
| 15 to 19 Minutes | 992 (11.7%) | 1,099 (16.8%) |
| 20 to 24 Minutes | 1,210 (14.3%) | 1,043 (16.0%) |
| 25 to 29 Minutes | 775 (9.2%) | 455 (7.0%) |
| 30 to 34 Minutes | 1,173 (13.9%) | 874 (13.4%) |
| 35 to 39 Minutes | 248 (2.9%) | 263 (4.0%) |
| 40 to 44 Minutes | 403 (4.8%) | 433 (6.6%) |
| 45 to 59 Minutes | 764 (9.0%) | 634 (9.7%) |
| 60 to 89 Minutes | 595 (7.0%) | 189 (2.9%) |
| 90 or more Minutes | 363 (4.3%) | 104 (1.6%) |
Time of Departure to Work by Sex in Moorpark
The most frequent times of departure to work in Moorpark are 7:30 AM to 7:59 AM (1,270, 15.0%) for males and 7:00 AM to 7:29 AM (1,110, 17.0%) for females.
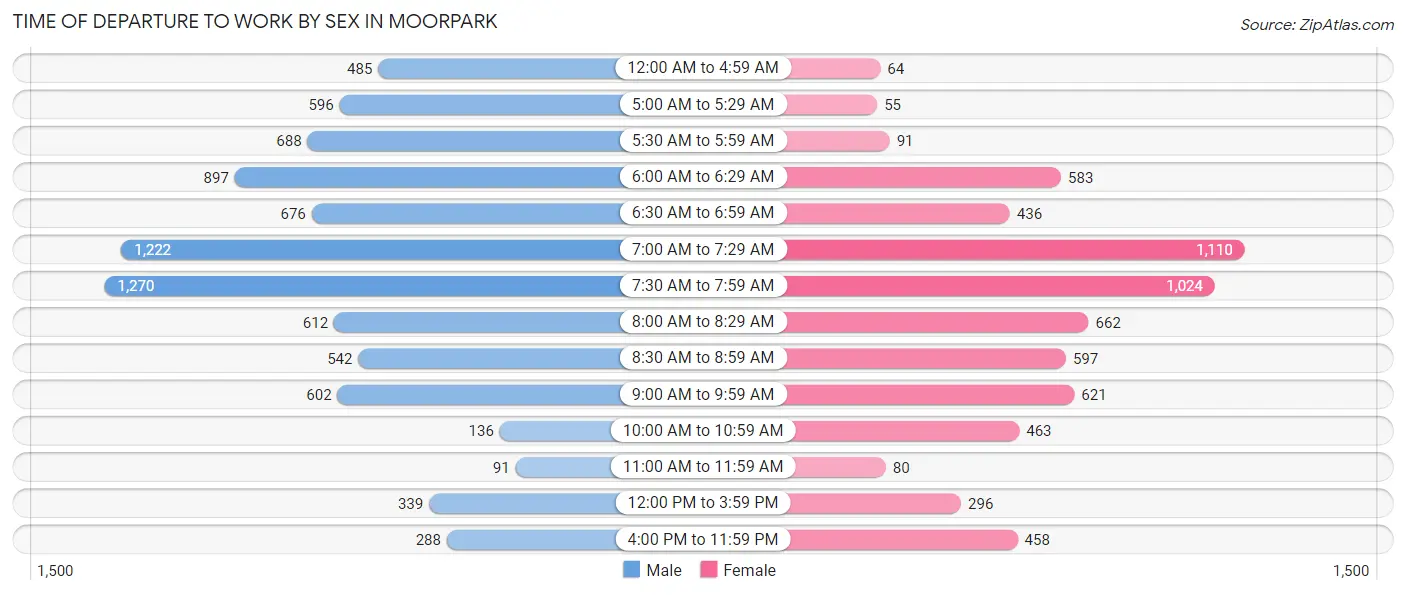
| Time of Departure | Male | Female |
| 12:00 AM to 4:59 AM | 485 (5.7%) | 64 (1.0%) |
| 5:00 AM to 5:29 AM | 596 (7.1%) | 55 (0.8%) |
| 5:30 AM to 5:59 AM | 688 (8.2%) | 91 (1.4%) |
| 6:00 AM to 6:29 AM | 897 (10.6%) | 583 (8.9%) |
| 6:30 AM to 6:59 AM | 676 (8.0%) | 436 (6.7%) |
| 7:00 AM to 7:29 AM | 1,222 (14.5%) | 1,110 (17.0%) |
| 7:30 AM to 7:59 AM | 1,270 (15.0%) | 1,024 (15.7%) |
| 8:00 AM to 8:29 AM | 612 (7.2%) | 662 (10.1%) |
| 8:30 AM to 8:59 AM | 542 (6.4%) | 597 (9.1%) |
| 9:00 AM to 9:59 AM | 602 (7.1%) | 621 (9.5%) |
| 10:00 AM to 10:59 AM | 136 (1.6%) | 463 (7.1%) |
| 11:00 AM to 11:59 AM | 91 (1.1%) | 80 (1.2%) |
| 12:00 PM to 3:59 PM | 339 (4.0%) | 296 (4.5%) |
| 4:00 PM to 11:59 PM | 288 (3.4%) | 458 (7.0%) |
| Total | 8,444 (100.0%) | 6,540 (100.0%) |
Housing Occupancy in Moorpark
Occupancy by Ownership in Moorpark
Of the total 11,268 dwellings in Moorpark, owner-occupied units account for 8,945 (79.4%), while renter-occupied units make up 2,323 (20.6%).
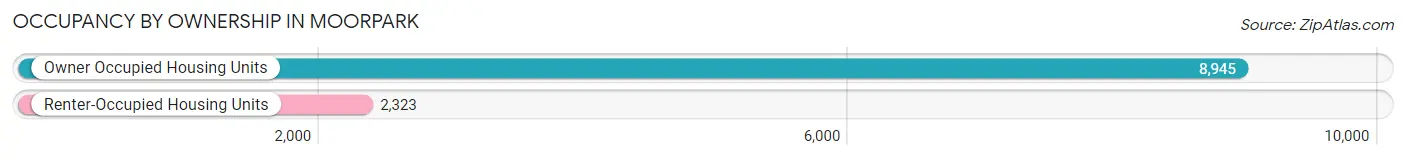
| Occupancy | # Housing Units | % Housing Units |
| Owner Occupied Housing Units | 8,945 | 79.4% |
| Renter-Occupied Housing Units | 2,323 | 20.6% |
| Total Occupied Housing Units | 11,268 | 100.0% |
Occupancy by Household Size in Moorpark
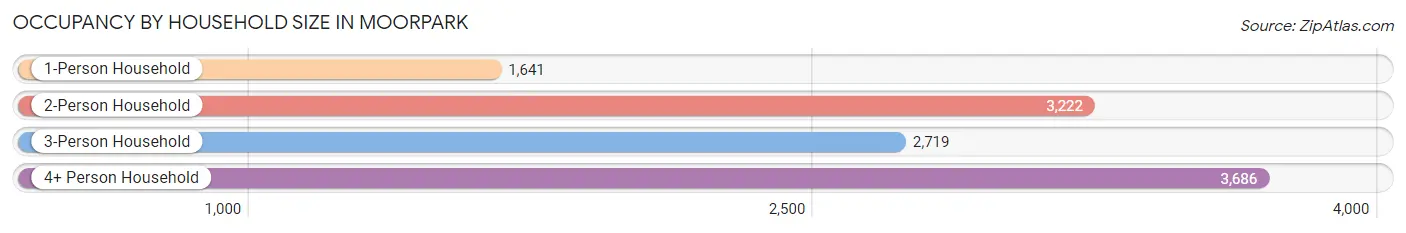
| Household Size | # Housing Units | % Housing Units |
| 1-Person Household | 1,641 | 14.6% |
| 2-Person Household | 3,222 | 28.6% |
| 3-Person Household | 2,719 | 24.1% |
| 4+ Person Household | 3,686 | 32.7% |
| Total Housing Units | 11,268 | 100.0% |
Occupancy by Ownership by Household Size in Moorpark
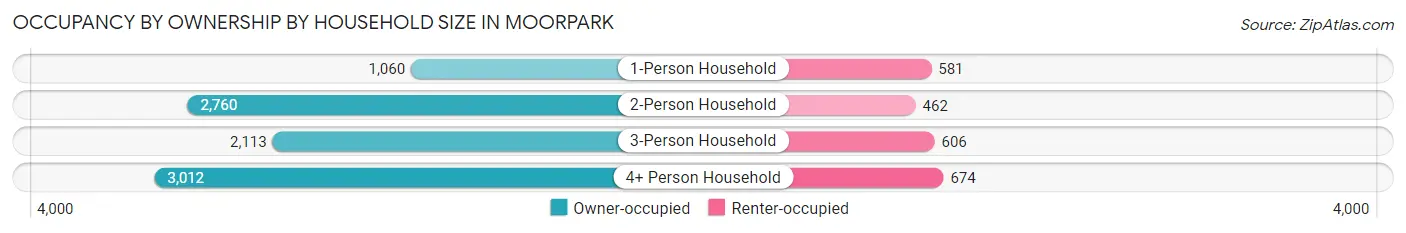
| Household Size | Owner-occupied | Renter-occupied |
| 1-Person Household | 1,060 (64.6%) | 581 (35.4%) |
| 2-Person Household | 2,760 (85.7%) | 462 (14.3%) |
| 3-Person Household | 2,113 (77.7%) | 606 (22.3%) |
| 4+ Person Household | 3,012 (81.7%) | 674 (18.3%) |
| Total Housing Units | 8,945 (79.4%) | 2,323 (20.6%) |
Occupancy by Educational Attainment in Moorpark
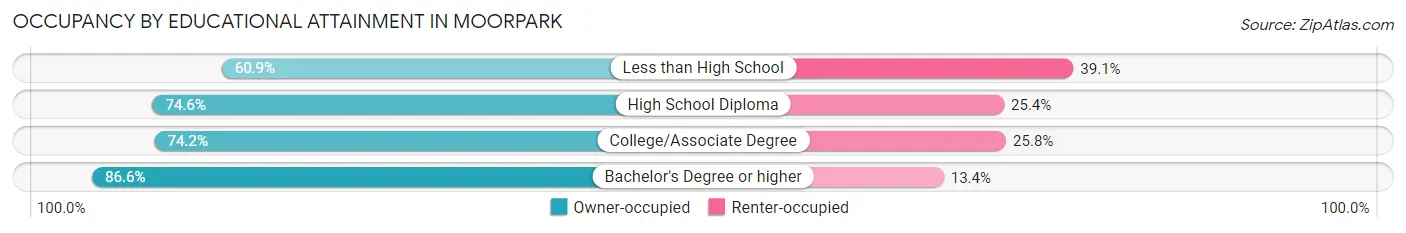
| Household Size | Owner-occupied | Renter-occupied |
| Less than High School | 506 (60.9%) | 325 (39.1%) |
| High School Diploma | 1,124 (74.6%) | 382 (25.4%) |
| College/Associate Degree | 2,515 (74.2%) | 873 (25.8%) |
| Bachelor's Degree or higher | 4,800 (86.6%) | 743 (13.4%) |
Occupancy by Age of Householder in Moorpark
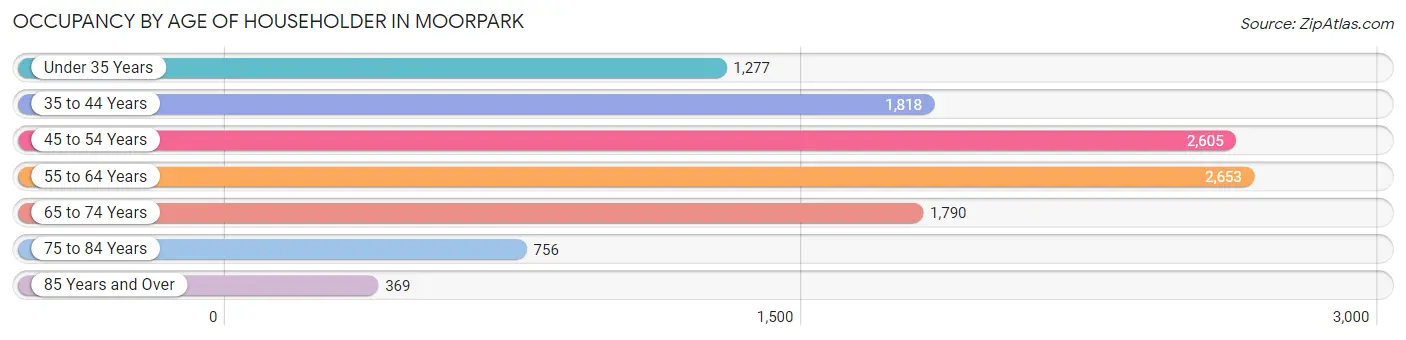
| Age Bracket | # Households | % Households |
| Under 35 Years | 1,277 | 11.3% |
| 35 to 44 Years | 1,818 | 16.1% |
| 45 to 54 Years | 2,605 | 23.1% |
| 55 to 64 Years | 2,653 | 23.5% |
| 65 to 74 Years | 1,790 | 15.9% |
| 75 to 84 Years | 756 | 6.7% |
| 85 Years and Over | 369 | 3.3% |
| Total | 11,268 | 100.0% |
Housing Finances in Moorpark
Median Income by Occupancy in Moorpark
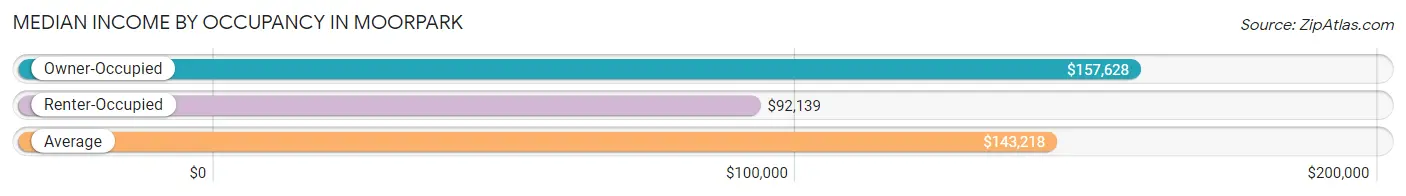
| Occupancy Type | # Households | Median Income |
| Owner-Occupied | 8,945 (79.4%) | $157,628 |
| Renter-Occupied | 2,323 (20.6%) | $92,139 |
| Average | 11,268 (100.0%) | $143,218 |
Occupancy by Householder Income Bracket in Moorpark
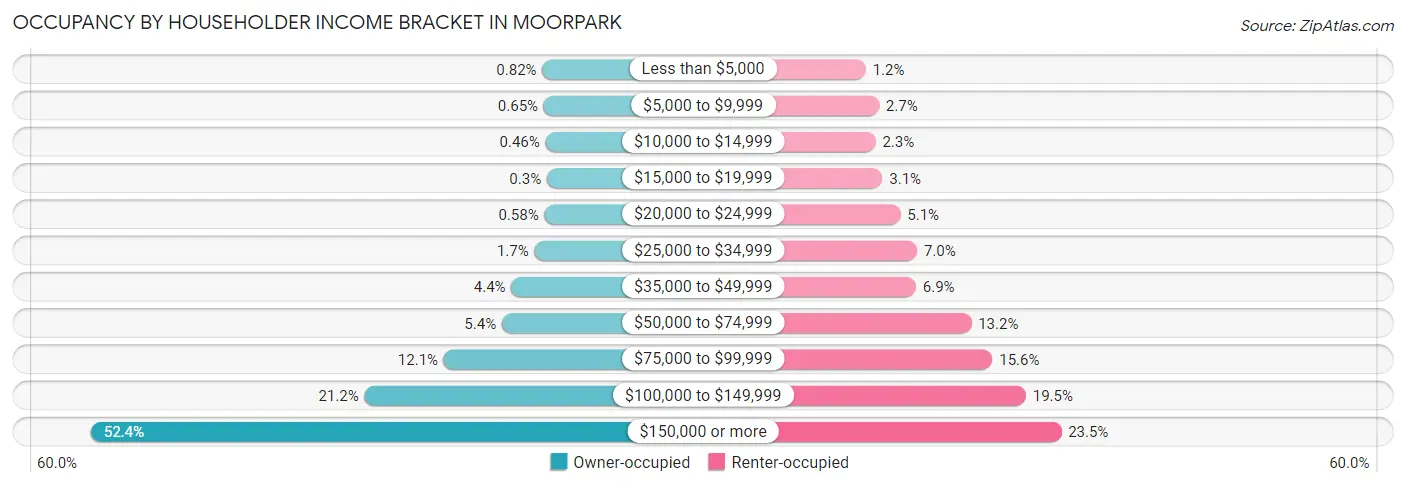
| Income Bracket | Owner-occupied | Renter-occupied |
| Less than $5,000 | 73 (0.8%) | 27 (1.2%) |
| $5,000 to $9,999 | 58 (0.6%) | 62 (2.7%) |
| $10,000 to $14,999 | 41 (0.5%) | 53 (2.3%) |
| $15,000 to $19,999 | 27 (0.3%) | 71 (3.1%) |
| $20,000 to $24,999 | 52 (0.6%) | 119 (5.1%) |
| $25,000 to $34,999 | 154 (1.7%) | 163 (7.0%) |
| $35,000 to $49,999 | 390 (4.4%) | 160 (6.9%) |
| $50,000 to $74,999 | 487 (5.4%) | 307 (13.2%) |
| $75,000 to $99,999 | 1,081 (12.1%) | 363 (15.6%) |
| $100,000 to $149,999 | 1,892 (21.1%) | 452 (19.5%) |
| $150,000 or more | 4,690 (52.4%) | 546 (23.5%) |
| Total | 8,945 (100.0%) | 2,323 (100.0%) |
Monthly Housing Cost Tiers in Moorpark
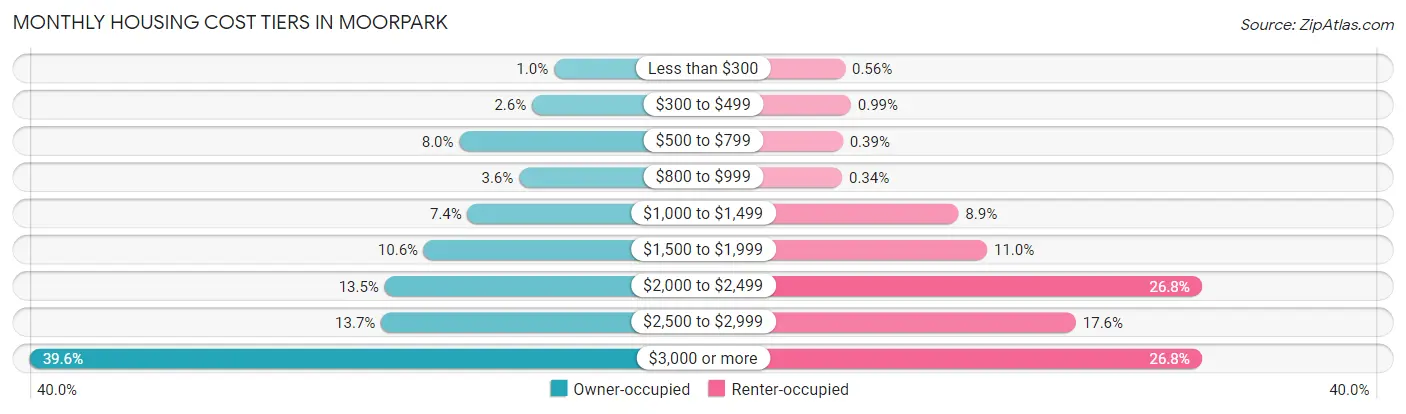
| Monthly Cost | Owner-occupied | Renter-occupied |
| Less than $300 | 90 (1.0%) | 13 (0.6%) |
| $300 to $499 | 235 (2.6%) | 23 (1.0%) |
| $500 to $799 | 714 (8.0%) | 9 (0.4%) |
| $800 to $999 | 320 (3.6%) | 8 (0.3%) |
| $1,000 to $1,499 | 660 (7.4%) | 207 (8.9%) |
| $1,500 to $1,999 | 947 (10.6%) | 256 (11.0%) |
| $2,000 to $2,499 | 1,206 (13.5%) | 623 (26.8%) |
| $2,500 to $2,999 | 1,229 (13.7%) | 408 (17.6%) |
| $3,000 or more | 3,544 (39.6%) | 623 (26.8%) |
| Total | 8,945 (100.0%) | 2,323 (100.0%) |
Physical Housing Characteristics in Moorpark
Housing Structures in Moorpark
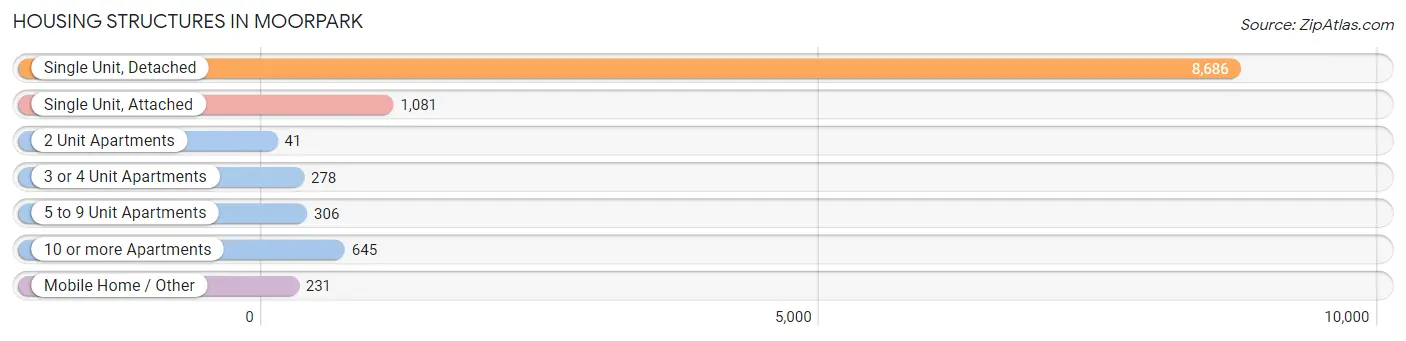
| Structure Type | # Housing Units | % Housing Units |
| Single Unit, Detached | 8,686 | 77.1% |
| Single Unit, Attached | 1,081 | 9.6% |
| 2 Unit Apartments | 41 | 0.4% |
| 3 or 4 Unit Apartments | 278 | 2.5% |
| 5 to 9 Unit Apartments | 306 | 2.7% |
| 10 or more Apartments | 645 | 5.7% |
| Mobile Home / Other | 231 | 2.1% |
| Total | 11,268 | 100.0% |
Housing Structures by Occupancy in Moorpark
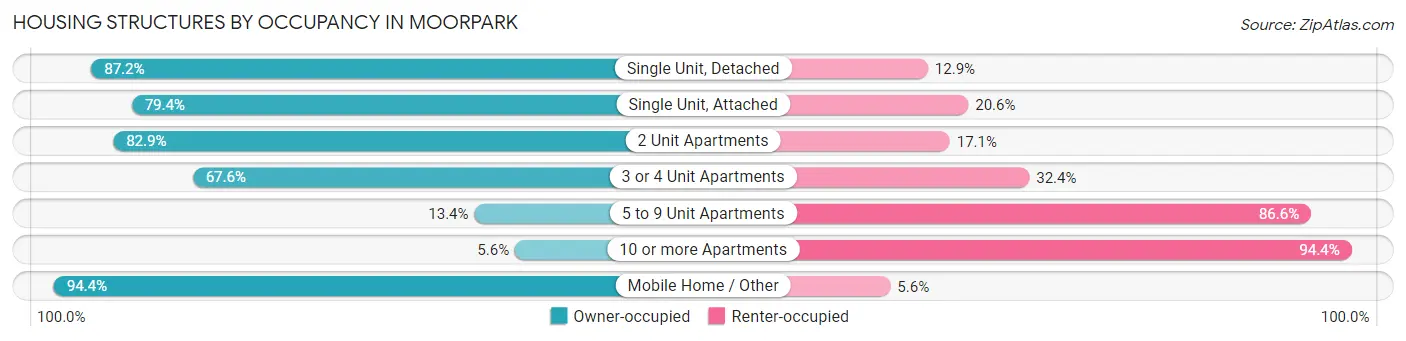
| Structure Type | Owner-occupied | Renter-occupied |
| Single Unit, Detached | 7,570 (87.2%) | 1,116 (12.9%) |
| Single Unit, Attached | 858 (79.4%) | 223 (20.6%) |
| 2 Unit Apartments | 34 (82.9%) | 7 (17.1%) |
| 3 or 4 Unit Apartments | 188 (67.6%) | 90 (32.4%) |
| 5 to 9 Unit Apartments | 41 (13.4%) | 265 (86.6%) |
| 10 or more Apartments | 36 (5.6%) | 609 (94.4%) |
| Mobile Home / Other | 218 (94.4%) | 13 (5.6%) |
| Total | 8,945 (79.4%) | 2,323 (20.6%) |
Housing Structures by Number of Rooms in Moorpark
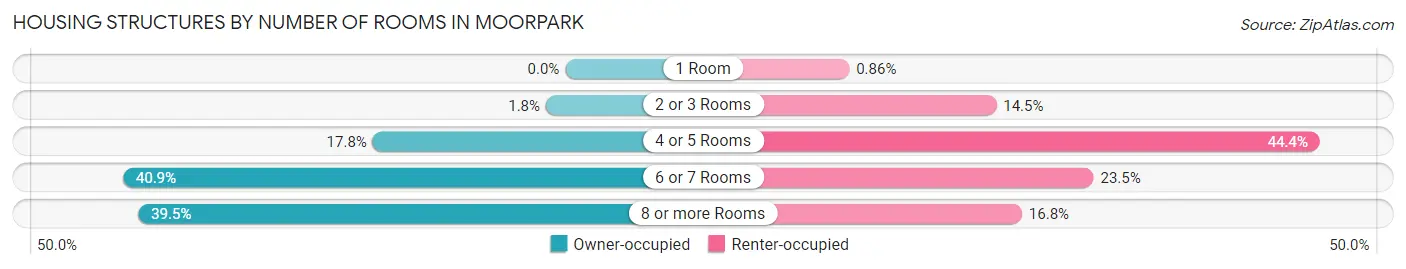
| Number of Rooms | Owner-occupied | Renter-occupied |
| 1 Room | 0 (0.0%) | 20 (0.9%) |
| 2 or 3 Rooms | 160 (1.8%) | 336 (14.5%) |
| 4 or 5 Rooms | 1,593 (17.8%) | 1,031 (44.4%) |
| 6 or 7 Rooms | 3,659 (40.9%) | 545 (23.5%) |
| 8 or more Rooms | 3,533 (39.5%) | 391 (16.8%) |
| Total | 8,945 (100.0%) | 2,323 (100.0%) |
Housing Structure by Heating Type in Moorpark
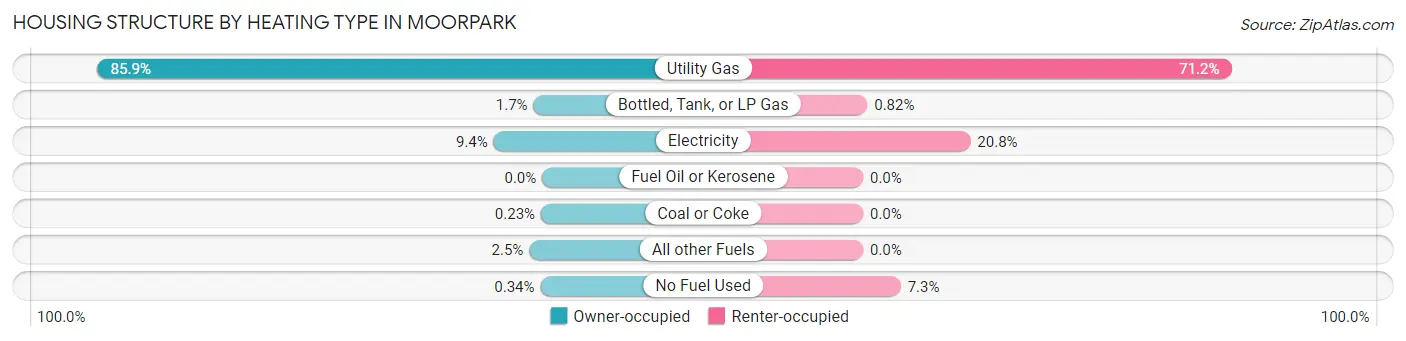
| Heating Type | Owner-occupied | Renter-occupied |
| Utility Gas | 7,682 (85.9%) | 1,653 (71.2%) |
| Bottled, Tank, or LP Gas | 150 (1.7%) | 19 (0.8%) |
| Electricity | 838 (9.4%) | 482 (20.7%) |
| Fuel Oil or Kerosene | 0 (0.0%) | 0 (0.0%) |
| Coal or Coke | 21 (0.2%) | 0 (0.0%) |
| All other Fuels | 224 (2.5%) | 0 (0.0%) |
| No Fuel Used | 30 (0.3%) | 169 (7.3%) |
| Total | 8,945 (100.0%) | 2,323 (100.0%) |
Household Vehicle Usage in Moorpark
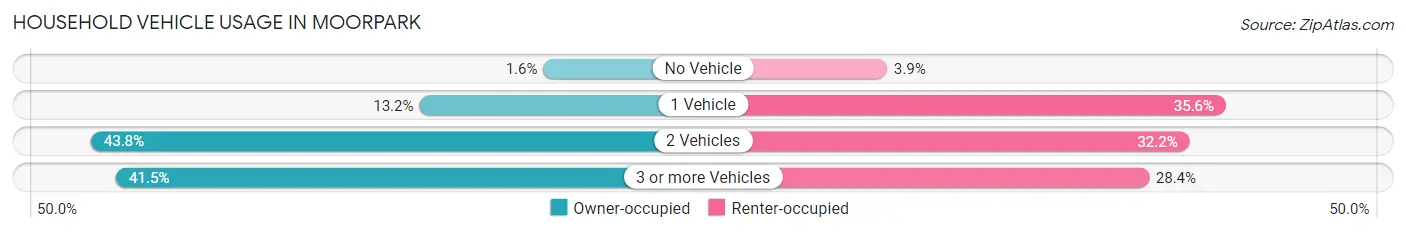
| Vehicles per Household | Owner-occupied | Renter-occupied |
| No Vehicle | 141 (1.6%) | 91 (3.9%) |
| 1 Vehicle | 1,177 (13.2%) | 826 (35.6%) |
| 2 Vehicles | 3,919 (43.8%) | 747 (32.2%) |
| 3 or more Vehicles | 3,708 (41.4%) | 659 (28.4%) |
| Total | 8,945 (100.0%) | 2,323 (100.0%) |
Real Estate & Mortgages in Moorpark
Real Estate and Mortgage Overview in Moorpark
| Characteristic | Without Mortgage | With Mortgage |
| Housing Units | 1,873 | 7,072 |
| Median Property Value | $784,100 | $805,200 |
| Median Household Income | $118,508 | $3,992 |
| Monthly Housing Costs | $795 | $3,540 |
| Real Estate Taxes | $5,253 | $89 |
Property Value by Mortgage Status in Moorpark
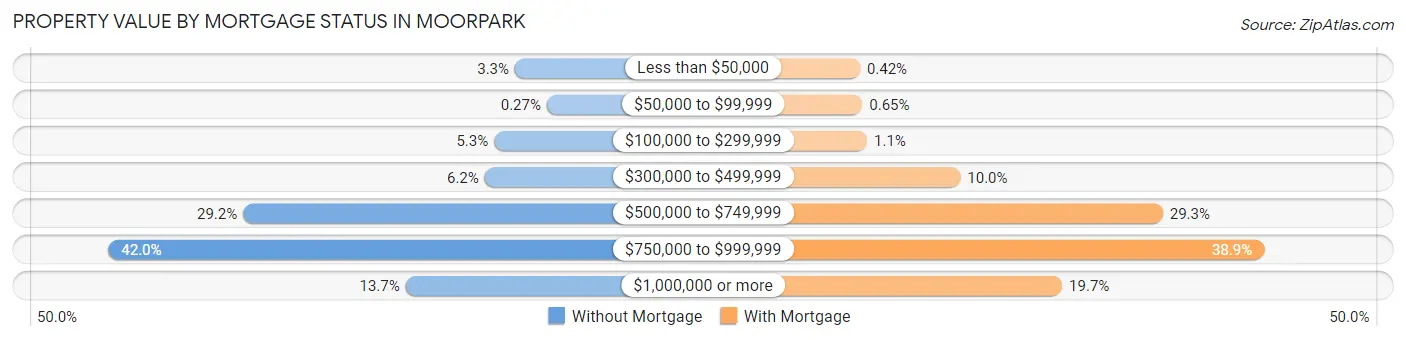
| Property Value | Without Mortgage | With Mortgage |
| Less than $50,000 | 62 (3.3%) | 30 (0.4%) |
| $50,000 to $99,999 | 5 (0.3%) | 46 (0.6%) |
| $100,000 to $299,999 | 99 (5.3%) | 78 (1.1%) |
| $300,000 to $499,999 | 116 (6.2%) | 706 (10.0%) |
| $500,000 to $749,999 | 547 (29.2%) | 2,069 (29.3%) |
| $750,000 to $999,999 | 787 (42.0%) | 2,751 (38.9%) |
| $1,000,000 or more | 257 (13.7%) | 1,392 (19.7%) |
| Total | 1,873 (100.0%) | 7,072 (100.0%) |
Household Income by Mortgage Status in Moorpark
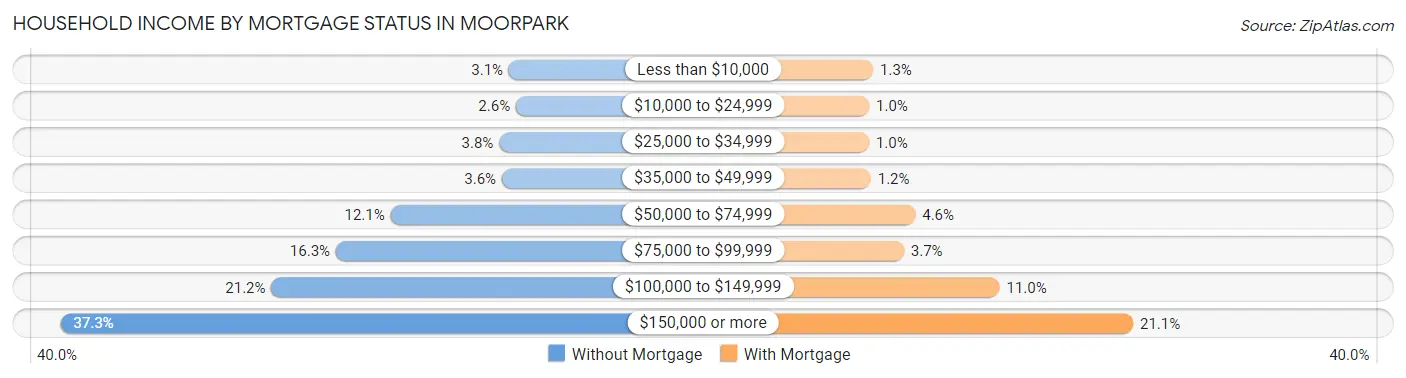
| Household Income | Without Mortgage | With Mortgage |
| Less than $10,000 | 58 (3.1%) | 95 (1.3%) |
| $10,000 to $24,999 | 48 (2.6%) | 73 (1.0%) |
| $25,000 to $34,999 | 72 (3.8%) | 72 (1.0%) |
| $35,000 to $49,999 | 68 (3.6%) | 82 (1.2%) |
| $50,000 to $74,999 | 227 (12.1%) | 322 (4.5%) |
| $75,000 to $99,999 | 305 (16.3%) | 260 (3.7%) |
| $100,000 to $149,999 | 397 (21.2%) | 776 (11.0%) |
| $150,000 or more | 698 (37.3%) | 1,495 (21.1%) |
| Total | 1,873 (100.0%) | 7,072 (100.0%) |
Property Value to Household Income Ratio in Moorpark
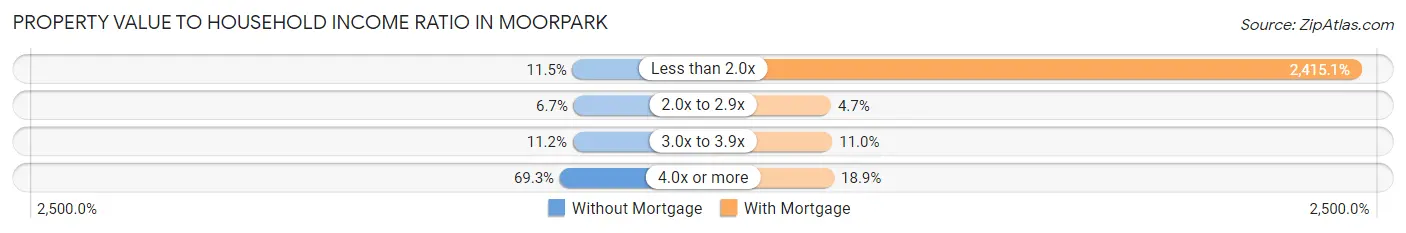
| Value-to-Income Ratio | Without Mortgage | With Mortgage |
| Less than 2.0x | 216 (11.5%) | 170,793 (2,415.1%) |
| 2.0x to 2.9x | 126 (6.7%) | 334 (4.7%) |
| 3.0x to 3.9x | 209 (11.2%) | 777 (11.0%) |
| 4.0x or more | 1,298 (69.3%) | 1,336 (18.9%) |
| Total | 1,873 (100.0%) | 7,072 (100.0%) |
Real Estate Taxes by Mortgage Status in Moorpark
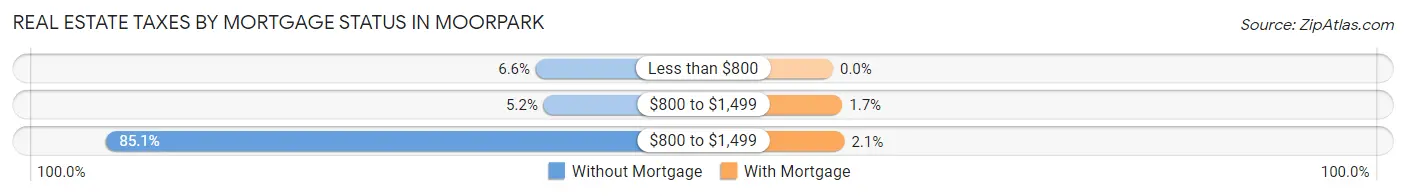
| Property Taxes | Without Mortgage | With Mortgage |
| Less than $800 | 124 (6.6%) | 0 (0.0%) |
| $800 to $1,499 | 97 (5.2%) | 120 (1.7%) |
| $800 to $1,499 | 1,593 (85.1%) | 147 (2.1%) |
| Total | 1,873 (100.0%) | 7,072 (100.0%) |
Health & Disability in Moorpark
Health Insurance Coverage by Age in Moorpark
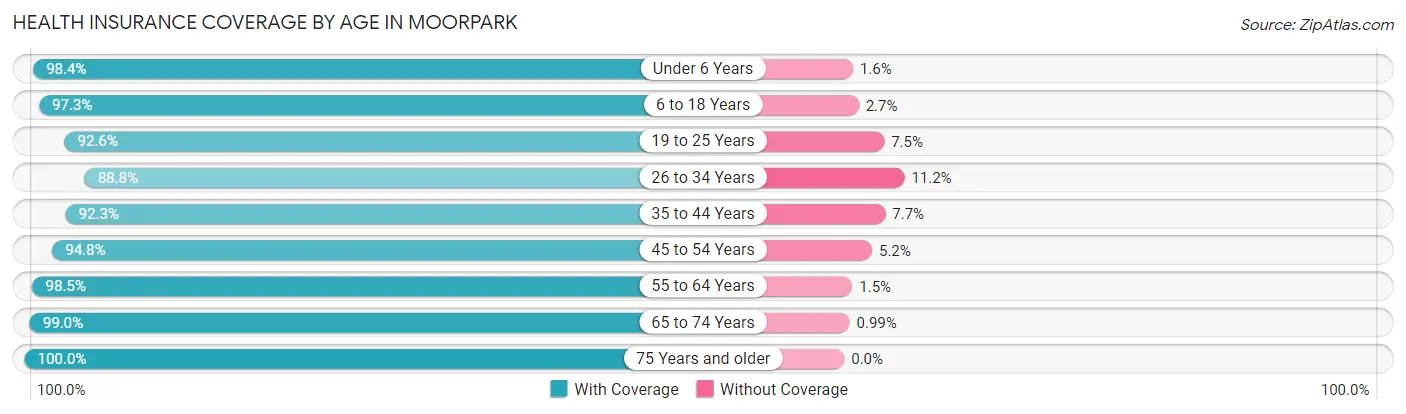
| Age Bracket | With Coverage | Without Coverage |
| Under 6 Years | 2,505 (98.4%) | 41 (1.6%) |
| 6 to 18 Years | 6,195 (97.3%) | 171 (2.7%) |
| 19 to 25 Years | 2,608 (92.5%) | 210 (7.4%) |
| 26 to 34 Years | 4,092 (88.8%) | 517 (11.2%) |
| 35 to 44 Years | 3,736 (92.3%) | 310 (7.7%) |
| 45 to 54 Years | 5,150 (94.8%) | 281 (5.2%) |
| 55 to 64 Years | 4,983 (98.5%) | 76 (1.5%) |
| 65 to 74 Years | 3,316 (99.0%) | 33 (1.0%) |
| 75 Years and older | 1,827 (100.0%) | 0 (0.0%) |
| Total | 34,412 (95.5%) | 1,639 (4.5%) |
Health Insurance Coverage by Citizenship Status in Moorpark
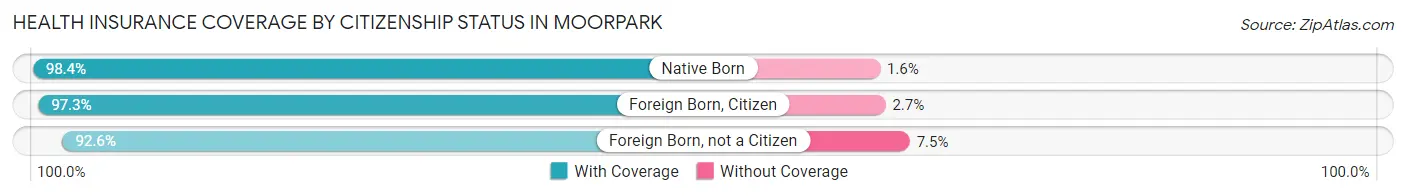
| Citizenship Status | With Coverage | Without Coverage |
| Native Born | 2,505 (98.4%) | 41 (1.6%) |
| Foreign Born, Citizen | 6,195 (97.3%) | 171 (2.7%) |
| Foreign Born, not a Citizen | 2,608 (92.5%) | 210 (7.4%) |
Health Insurance Coverage by Household Income in Moorpark
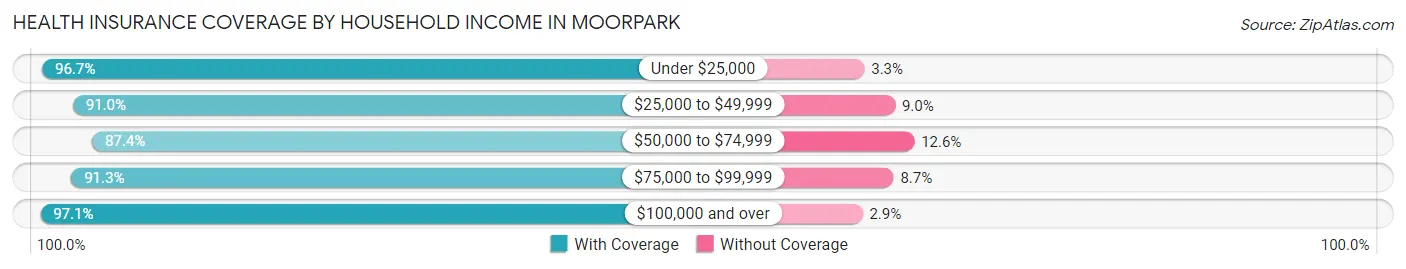
| Household Income | With Coverage | Without Coverage |
| Under $25,000 | 1,122 (96.7%) | 38 (3.3%) |
| $25,000 to $49,999 | 1,632 (91.0%) | 162 (9.0%) |
| $50,000 to $74,999 | 1,813 (87.4%) | 262 (12.6%) |
| $75,000 to $99,999 | 4,216 (91.3%) | 404 (8.7%) |
| $100,000 and over | 25,626 (97.1%) | 773 (2.9%) |
Public vs Private Health Insurance Coverage by Age in Moorpark
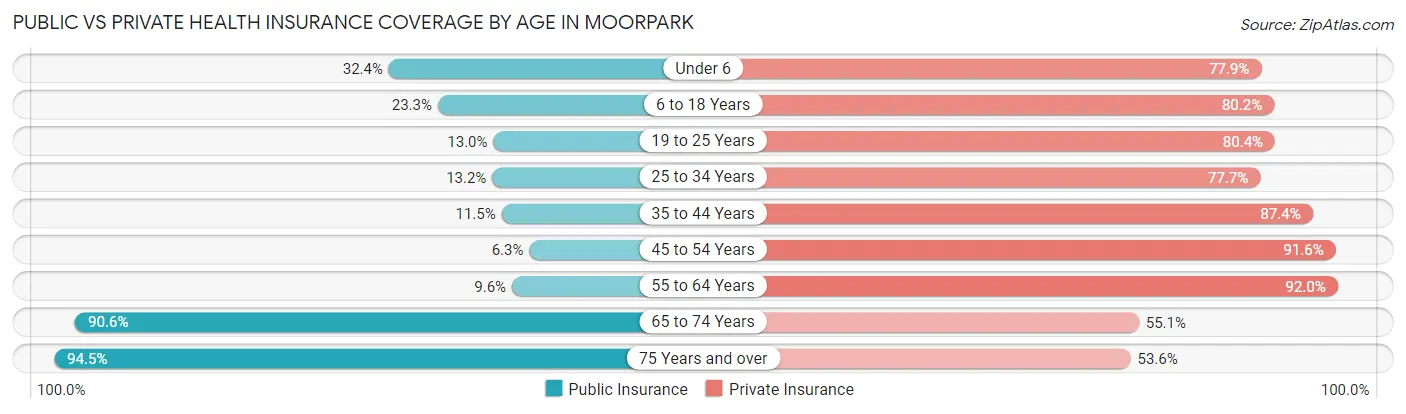
| Age Bracket | Public Insurance | Private Insurance |
| Under 6 | 825 (32.4%) | 1,982 (77.8%) |
| 6 to 18 Years | 1,483 (23.3%) | 5,106 (80.2%) |
| 19 to 25 Years | 366 (13.0%) | 2,265 (80.4%) |
| 25 to 34 Years | 609 (13.2%) | 3,579 (77.6%) |
| 35 to 44 Years | 464 (11.5%) | 3,535 (87.4%) |
| 45 to 54 Years | 343 (6.3%) | 4,977 (91.6%) |
| 55 to 64 Years | 483 (9.6%) | 4,656 (92.0%) |
| 65 to 74 Years | 3,035 (90.6%) | 1,846 (55.1%) |
| 75 Years and over | 1,727 (94.5%) | 979 (53.6%) |
| Total | 9,335 (25.9%) | 28,925 (80.2%) |
Disability Status by Sex by Age in Moorpark
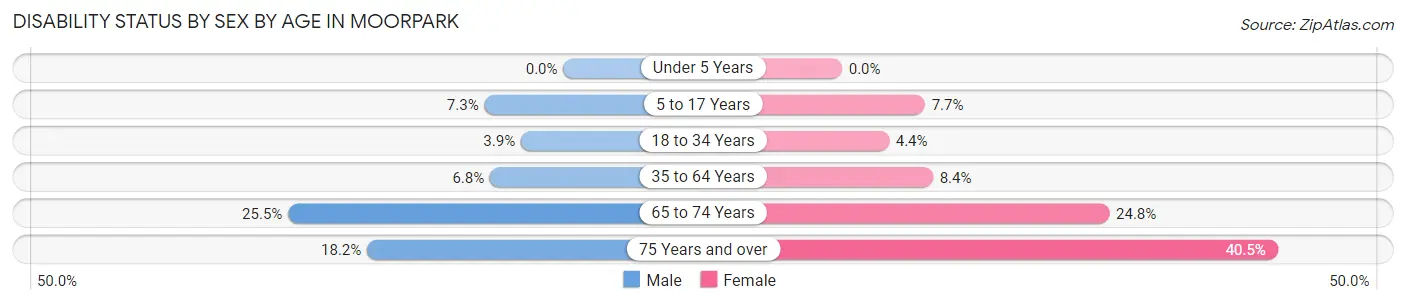
| Age Bracket | Male | Female |
| Under 5 Years | 0 (0.0%) | 0 (0.0%) |
| 5 to 17 Years | 229 (7.3%) | 250 (7.7%) |
| 18 to 34 Years | 159 (3.9%) | 167 (4.4%) |
| 35 to 64 Years | 484 (6.8%) | 626 (8.4%) |
| 65 to 74 Years | 423 (25.5%) | 420 (24.8%) |
| 75 Years and over | 163 (18.2%) | 377 (40.5%) |
Disability Class by Sex by Age in Moorpark
Disability Class: Hearing Difficulty
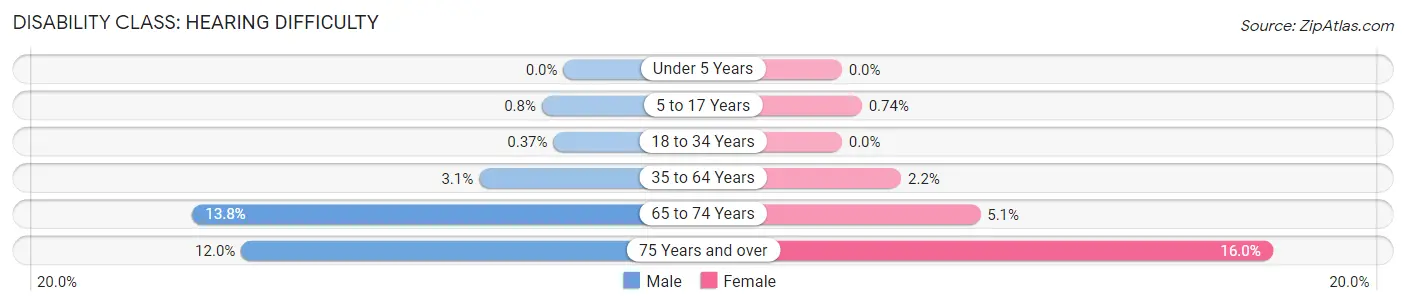
| Age Bracket | Male | Female |
| Under 5 Years | 0 (0.0%) | 0 (0.0%) |
| 5 to 17 Years | 25 (0.8%) | 24 (0.7%) |
| 18 to 34 Years | 15 (0.4%) | 0 (0.0%) |
| 35 to 64 Years | 223 (3.1%) | 163 (2.2%) |
| 65 to 74 Years | 228 (13.8%) | 87 (5.1%) |
| 75 Years and over | 107 (12.0%) | 149 (16.0%) |
Disability Class: Vision Difficulty
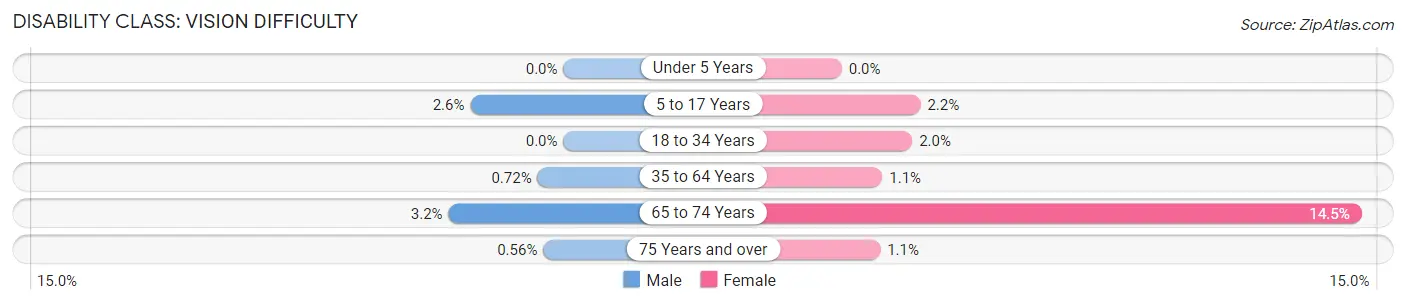
| Age Bracket | Male | Female |
| Under 5 Years | 0 (0.0%) | 0 (0.0%) |
| 5 to 17 Years | 81 (2.6%) | 71 (2.2%) |
| 18 to 34 Years | 0 (0.0%) | 75 (2.0%) |
| 35 to 64 Years | 51 (0.7%) | 84 (1.1%) |
| 65 to 74 Years | 53 (3.2%) | 245 (14.5%) |
| 75 Years and over | 5 (0.6%) | 10 (1.1%) |
Disability Class: Cognitive Difficulty
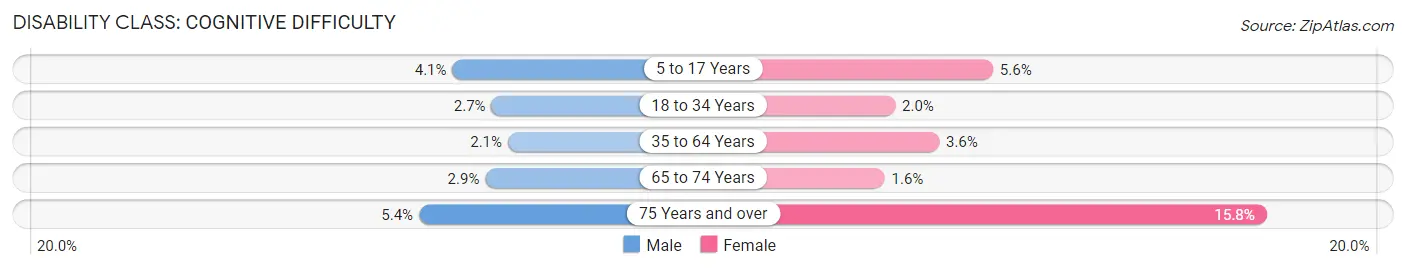
| Age Bracket | Male | Female |
| 5 to 17 Years | 129 (4.1%) | 182 (5.6%) |
| 18 to 34 Years | 108 (2.7%) | 76 (2.0%) |
| 35 to 64 Years | 147 (2.1%) | 268 (3.6%) |
| 65 to 74 Years | 48 (2.9%) | 27 (1.6%) |
| 75 Years and over | 48 (5.4%) | 147 (15.8%) |
Disability Class: Ambulatory Difficulty
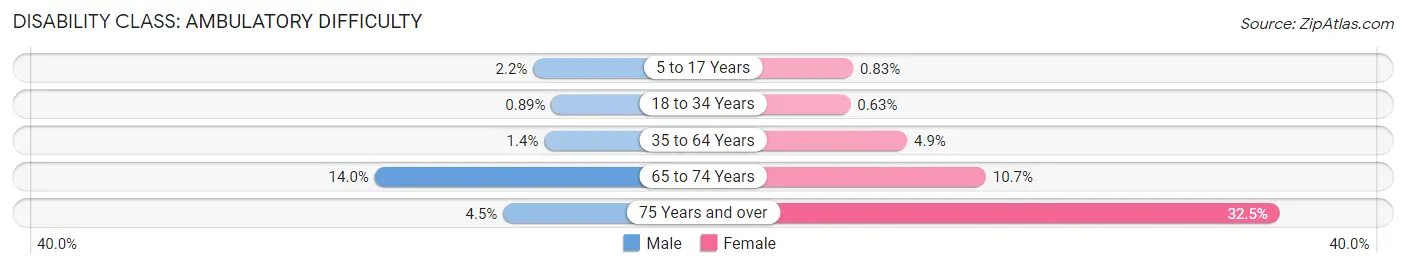
| Age Bracket | Male | Female |
| 5 to 17 Years | 70 (2.2%) | 27 (0.8%) |
| 18 to 34 Years | 36 (0.9%) | 24 (0.6%) |
| 35 to 64 Years | 101 (1.4%) | 360 (4.9%) |
| 65 to 74 Years | 232 (14.0%) | 181 (10.7%) |
| 75 Years and over | 40 (4.5%) | 303 (32.5%) |
Disability Class: Self-Care Difficulty
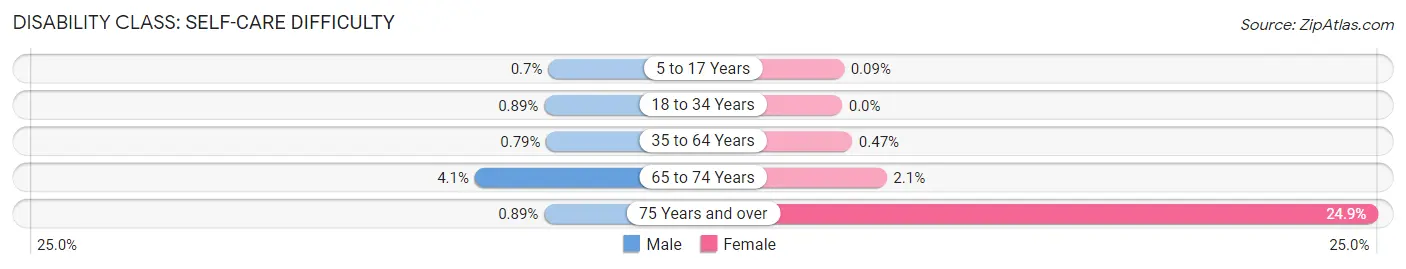
| Age Bracket | Male | Female |
| 5 to 17 Years | 22 (0.7%) | 3 (0.1%) |
| 18 to 34 Years | 36 (0.9%) | 0 (0.0%) |
| 35 to 64 Years | 56 (0.8%) | 35 (0.5%) |
| 65 to 74 Years | 68 (4.1%) | 35 (2.1%) |
| 75 Years and over | 8 (0.9%) | 232 (24.9%) |
Technology Access in Moorpark
Computing Device Access in Moorpark
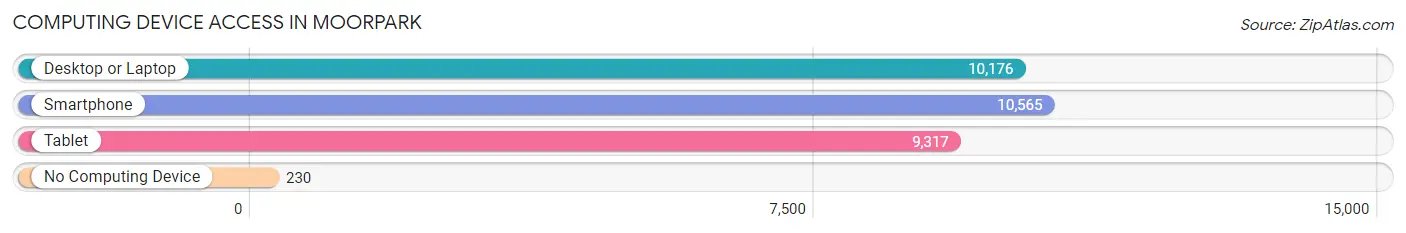
| Device Type | # Households | % Households |
| Desktop or Laptop | 10,176 | 90.3% |
| Smartphone | 10,565 | 93.8% |
| Tablet | 9,317 | 82.7% |
| No Computing Device | 230 | 2.0% |
| Total | 11,268 | 100.0% |
Internet Access in Moorpark
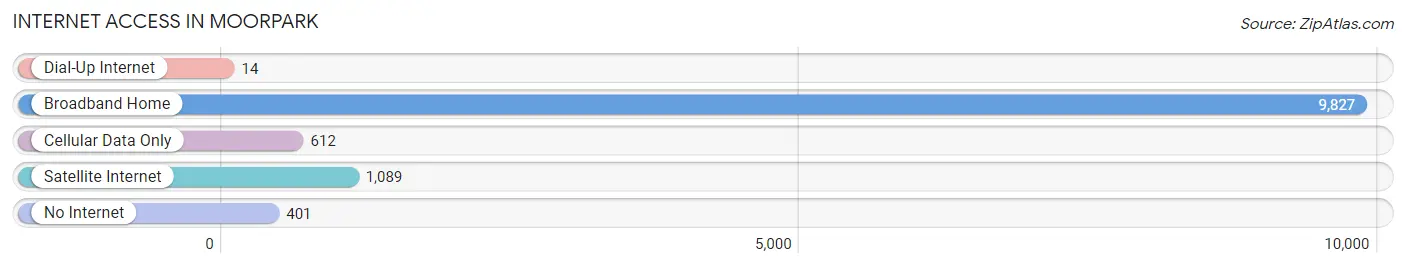
| Internet Type | # Households | % Households |
| Dial-Up Internet | 14 | 0.1% |
| Broadband Home | 9,827 | 87.2% |
| Cellular Data Only | 612 | 5.4% |
| Satellite Internet | 1,089 | 9.7% |
| No Internet | 401 | 3.6% |
| Total | 11,268 | 100.0% |
Moorpark Summary
Moorpark is a city located in Ventura County, California, United States. The population was 34,421 at the 2010 census, up from 31,415 at the 2000 census. Moorpark was founded in 1900 when the application for the Moorpark Post Office was approved and Inocencio C. Villegas was named Moorpark's first postmaster on August 8 of that year. The townsite of Moorpark was owned and surveyed by Robert W. Poindexter and his wife, Madeline. The town has experienced a great amount of growth since the late 1970s.
Geography
Moorpark is located in the southeastern corner of Ventura County, California, at an elevation of 830 feet (253 m). It is bordered by Simi Valley on the northwest, Somis and Santa Rosa Valley on the north, Santa Susana Mountains on the northeast, Thousand Oaks on the east, Camarillo on the south, and the Santa Monica Mountains on the southwest. The city is approximately 30 miles (48 km) from the Pacific Ocean.
Moorpark has a Mediterranean climate (Köppen climate classification Csa) with warm, dry summers and cool, wet winters. The average annual rainfall is about 14.2 inches (360 mm). The average annual temperature is about 68°F (20°C).
Economy
Moorpark's economy is largely based on agriculture and light manufacturing. The city is home to several large employers, including Amgen, a biotechnology company, and the Moorpark Unified School District. The city is also home to several small businesses, including a number of wineries, a brewery, and a distillery.
Demographics
As of the 2010 census, there were 34,421 people, 11,539 households, and 8,817 families residing in the city. The population density was 2,919.7 people per square mile (1,129.2/km2). There were 11,934 housing units at an average density of 1,054.3 per square mile (406.9/km2). The racial makeup of the city was 75.2% White, 1.7% African American, 0.2% Native American, 11.8% Asian, 0.2% Pacific Islander, 7.5% from other races, and 3.4% from two or more races. Hispanic or Latino of any race were 20.6% of the population.
The median income for a household in the city was $87,821, and the median income for a family was $101,964. Males had a median income of $65,938 versus $45,836 for females. The per capita income for the city was $35,902. About 3.2% of families and 4.7% of the population were below the poverty line, including 5.2% of those under age 18 and 4.7% of those age 65 or over.
Moorpark is a diverse community with a variety of cultures and backgrounds. The city is home to a large number of immigrants from Mexico, India, and the Philippines. The city also has a large population of retirees, many of whom are from the Baby Boomer generation.
Common Questions
What is Per Capita Income in Moorpark?
Per Capita income in Moorpark is $52,673.
What is the Median Family Income in Moorpark?
Median Family Income in Moorpark is $155,179.
What is the Median Household income in Moorpark?
Median Household Income in Moorpark is $143,218.
What is Income or Wage Gap in Moorpark?
Income or Wage Gap in Moorpark is 22.1%.
Women in Moorpark earn 77.9 cents for every dollar earned by a man.
What is Inequality or Gini Index in Moorpark?
Inequality or Gini Index in Moorpark is 0.37.
What is the Total Population of Moorpark?
Total Population of Moorpark is 36,073.
What is the Total Male Population of Moorpark?
Total Male Population of Moorpark is 17,937.
What is the Total Female Population of Moorpark?
Total Female Population of Moorpark is 18,136.
What is the Ratio of Males per 100 Females in Moorpark?
There are 98.90 Males per 100 Females in Moorpark.
What is the Ratio of Females per 100 Males in Moorpark?
There are 101.11 Females per 100 Males in Moorpark.
What is the Median Population Age in Moorpark?
Median Population Age in Moorpark is 38.8 Years.
What is the Average Family Size in Moorpark
Average Family Size in Moorpark is 3.6 People.
What is the Average Household Size in Moorpark
Average Household Size in Moorpark is 3.2 People.
How Large is the Labor Force in Moorpark?
There are 19,222 People in the Labor Forcein in Moorpark.
What is the Percentage of People in the Labor Force in Moorpark?
66.7% of People are in the Labor Force in Moorpark.
What is the Unemployment Rate in Moorpark?
Unemployment Rate in Moorpark is 5.1%.