Cities with the Lowest Poverty Level Among Seniors Over the Age of 65 in Maryland
RELATED REPORTS & OPTIONS
Lowest Poverty | Seniors 65+
Maryland
Compare Cities
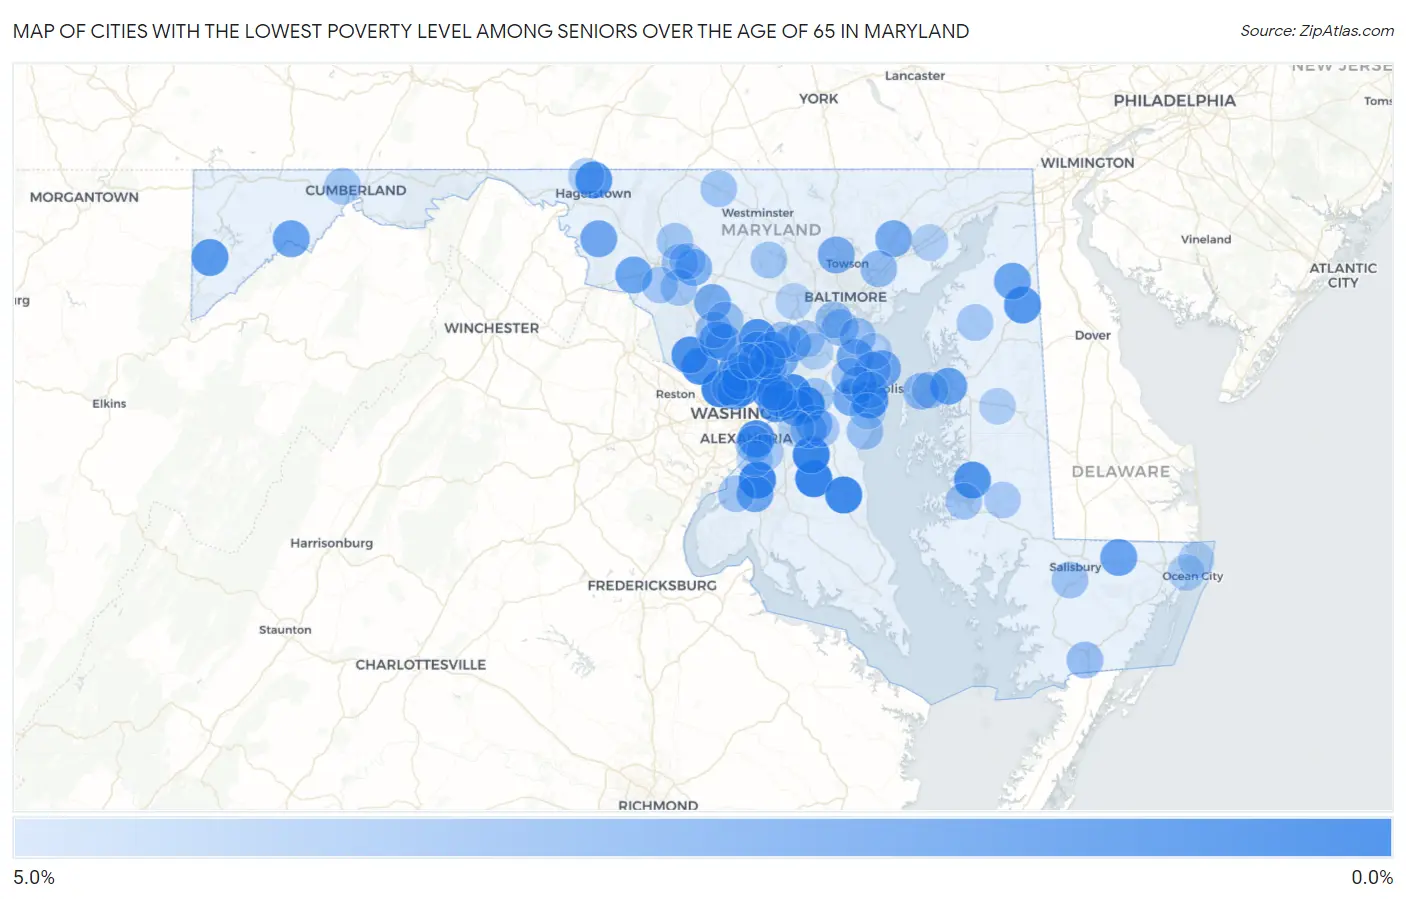
Map of Cities with the Lowest Poverty Level Among Seniors Over the Age of 65 in Maryland
5.0%
0.0%
Cities with the Lowest Poverty Level Among Seniors Over the Age of 65 in Maryland
| City | Senior Poverty | vs State | vs National | |
| 1. | Baden | 0.26% | 8.5%(-8.26)#1 | 10.0%(-9.69)#35 |
| 2. | Cabin John | 0.30% | 8.5%(-8.22)#2 | 10.0%(-9.65)#41 |
| 3. | Croom | 0.34% | 8.5%(-8.18)#3 | 10.0%(-9.61)#48 |
| 4. | Hillandale | 0.38% | 8.5%(-8.14)#4 | 10.0%(-9.57)#55 |
| 5. | Accokeek | 0.39% | 8.5%(-8.13)#5 | 10.0%(-9.56)#59 |
| 6. | Huntingtown | 0.52% | 8.5%(-8.00)#6 | 10.0%(-9.43)#85 |
| 7. | Lanham | 0.58% | 8.5%(-7.94)#7 | 10.0%(-9.37)#100 |
| 8. | Woodmore | 0.63% | 8.5%(-7.89)#8 | 10.0%(-9.32)#114 |
| 9. | Martin S Additions | 0.88% | 8.5%(-7.64)#9 | 10.0%(-9.07)#213 |
| 10. | Annapolis Neck | 0.91% | 8.5%(-7.61)#10 | 10.0%(-9.04)#231 |
| 11. | Travilah | 0.93% | 8.5%(-7.58)#11 | 10.0%(-9.02)#247 |
| 12. | Forest Heights | 1.0% | 8.5%(-7.50)#12 | 10.0%(-8.94)#287 |
| 13. | Ashton Sandy Spring | 1.0% | 8.5%(-7.50)#13 | 10.0%(-8.93)#290 |
| 14. | Darnestown | 1.0% | 8.5%(-7.48)#14 | 10.0%(-8.91)#310 |
| 15. | Cheverly | 1.1% | 8.5%(-7.37)#15 | 10.0%(-8.80)#370 |
| 16. | Fountainhead Orchard Hills | 1.2% | 8.5%(-7.35)#16 | 10.0%(-8.78)#392 |
| 17. | Trappe | 1.2% | 8.5%(-7.33)#17 | 10.0%(-8.76)#407 |
| 18. | Millington | 1.3% | 8.5%(-7.20)#18 | 10.0%(-8.64)#506 |
| 19. | Oakland | 1.4% | 8.5%(-7.14)#19 | 10.0%(-8.57)#561 |
| 20. | Garrett Park | 1.4% | 8.5%(-7.11)#20 | 10.0%(-8.54)#581 |
| 21. | Cloverly | 1.7% | 8.5%(-6.86)#21 | 10.0%(-8.29)#773 |
| 22. | University Park | 1.7% | 8.5%(-6.78)#22 | 10.0%(-8.21)#856 |
| 23. | Somerset | 1.8% | 8.5%(-6.73)#23 | 10.0%(-8.16)#899 |
| 24. | Queenstown | 1.9% | 8.5%(-6.65)#24 | 10.0%(-8.08)#961 |
| 25. | Lake Arbor | 1.9% | 8.5%(-6.59)#25 | 10.0%(-8.02)#1,023 |
| 26. | Westernport | 1.9% | 8.5%(-6.59)#26 | 10.0%(-8.02)#1,024 |
| 27. | Kensington | 2.0% | 8.5%(-6.56)#27 | 10.0%(-7.99)#1,048 |
| 28. | Pittsville | 2.0% | 8.5%(-6.55)#28 | 10.0%(-7.99)#1,065 |
| 29. | Galena | 2.0% | 8.5%(-6.53)#29 | 10.0%(-7.96)#1,086 |
| 30. | Jefferson | 2.0% | 8.5%(-6.52)#30 | 10.0%(-7.95)#1,091 |
| 31. | Bensville | 2.2% | 8.5%(-6.36)#31 | 10.0%(-7.80)#1,227 |
| 32. | Washington Grove | 2.2% | 8.5%(-6.33)#32 | 10.0%(-7.77)#1,263 |
| 33. | Keedysville | 2.2% | 8.5%(-6.33)#33 | 10.0%(-7.76)#1,267 |
| 34. | Cape St Claire | 2.2% | 8.5%(-6.32)#34 | 10.0%(-7.75)#1,272 |
| 35. | Green Valley | 2.2% | 8.5%(-6.28)#35 | 10.0%(-7.71)#1,319 |
| 36. | Riva | 2.3% | 8.5%(-6.19)#36 | 10.0%(-7.62)#1,407 |
| 37. | Severna Park | 2.3% | 8.5%(-6.17)#37 | 10.0%(-7.61)#1,427 |
| 38. | Pleasant Hills | 2.4% | 8.5%(-6.13)#38 | 10.0%(-7.56)#1,488 |
| 39. | Damascus | 2.4% | 8.5%(-6.08)#39 | 10.0%(-7.52)#1,520 |
| 40. | Mays Chapel | 2.5% | 8.5%(-6.07)#40 | 10.0%(-7.50)#1,545 |
| 41. | Konterra | 2.5% | 8.5%(-6.02)#41 | 10.0%(-7.45)#1,583 |
| 42. | Redland | 2.5% | 8.5%(-6.02)#42 | 10.0%(-7.45)#1,598 |
| 43. | North Chevy Chase | 2.6% | 8.5%(-5.96)#43 | 10.0%(-7.39)#1,660 |
| 44. | New Market | 2.8% | 8.5%(-5.74)#44 | 10.0%(-7.17)#1,902 |
| 45. | Brock Hall | 2.8% | 8.5%(-5.68)#45 | 10.0%(-7.11)#1,971 |
| 46. | North Laurel | 2.8% | 8.5%(-5.68)#46 | 10.0%(-7.11)#1,974 |
| 47. | Arnold | 2.9% | 8.5%(-5.61)#47 | 10.0%(-7.04)#2,067 |
| 48. | Calverton | 2.9% | 8.5%(-5.60)#48 | 10.0%(-7.03)#2,075 |
| 49. | Landover Hills | 3.0% | 8.5%(-5.47)#49 | 10.0%(-6.90)#2,239 |
| 50. | Parole | 3.1% | 8.5%(-5.43)#50 | 10.0%(-6.86)#2,286 |
| 51. | Marlboro Village | 3.2% | 8.5%(-5.31)#51 | 10.0%(-6.75)#2,440 |
| 52. | Chester | 3.2% | 8.5%(-5.29)#52 | 10.0%(-6.72)#2,485 |
| 53. | National Harbor | 3.3% | 8.5%(-5.25)#53 | 10.0%(-6.68)#2,530 |
| 54. | White Marsh | 3.3% | 8.5%(-5.24)#54 | 10.0%(-6.67)#2,555 |
| 55. | Ferndale | 3.3% | 8.5%(-5.18)#55 | 10.0%(-6.61)#2,650 |
| 56. | Burtonsville | 3.4% | 8.5%(-5.12)#56 | 10.0%(-6.55)#2,721 |
| 57. | Linthicum | 3.4% | 8.5%(-5.12)#57 | 10.0%(-6.55)#2,724 |
| 58. | Pasadena | 3.5% | 8.5%(-5.05)#58 | 10.0%(-6.49)#2,811 |
| 59. | Pocomoke City | 3.5% | 8.5%(-5.00)#59 | 10.0%(-6.44)#2,871 |
| 60. | Montgomery Village | 3.5% | 8.5%(-5.00)#60 | 10.0%(-6.43)#2,874 |
| 61. | Shady Side | 3.6% | 8.5%(-4.93)#61 | 10.0%(-6.37)#2,988 |
| 62. | Laytonsville | 3.6% | 8.5%(-4.92)#62 | 10.0%(-6.35)#3,016 |
| 63. | Spring Ridge | 3.7% | 8.5%(-4.86)#63 | 10.0%(-6.29)#3,086 |
| 64. | Kent Narrows | 3.7% | 8.5%(-4.83)#64 | 10.0%(-6.26)#3,119 |
| 65. | Fruitland | 3.7% | 8.5%(-4.82)#65 | 10.0%(-6.25)#3,128 |
| 66. | Scaggsville | 3.7% | 8.5%(-4.78)#66 | 10.0%(-6.21)#3,195 |
| 67. | Urbana | 3.8% | 8.5%(-4.77)#67 | 10.0%(-6.20)#3,210 |
| 68. | Taneytown | 3.8% | 8.5%(-4.77)#68 | 10.0%(-6.20)#3,211 |
| 69. | Riverdale Park | 3.8% | 8.5%(-4.75)#69 | 10.0%(-6.19)#3,224 |
| 70. | Crownsville | 3.8% | 8.5%(-4.75)#70 | 10.0%(-6.18)#3,228 |
| 71. | Algonquin | 3.8% | 8.5%(-4.72)#71 | 10.0%(-6.16)#3,245 |
| 72. | Annapolis | 3.8% | 8.5%(-4.70)#72 | 10.0%(-6.13)#3,294 |
| 73. | Bowie | 3.8% | 8.5%(-4.70)#73 | 10.0%(-6.13)#3,295 |
| 74. | Bryans Road | 3.9% | 8.5%(-4.66)#74 | 10.0%(-6.09)#3,355 |
| 75. | Walkersville | 3.9% | 8.5%(-4.65)#75 | 10.0%(-6.08)#3,357 |
| 76. | Eldersburg | 3.9% | 8.5%(-4.65)#76 | 10.0%(-6.08)#3,363 |
| 77. | Jessup | 3.9% | 8.5%(-4.63)#77 | 10.0%(-6.06)#3,384 |
| 78. | Buckeystown | 3.9% | 8.5%(-4.63)#78 | 10.0%(-6.06)#3,389 |
| 79. | Kingstown | 3.9% | 8.5%(-4.62)#79 | 10.0%(-6.06)#3,393 |
| 80. | La Vale | 4.0% | 8.5%(-4.54)#80 | 10.0%(-5.97)#3,510 |
| 81. | Friendly | 4.0% | 8.5%(-4.53)#81 | 10.0%(-5.96)#3,520 |
| 82. | Linganore | 4.0% | 8.5%(-4.52)#82 | 10.0%(-5.95)#3,529 |
| 83. | Colesville | 4.0% | 8.5%(-4.49)#83 | 10.0%(-5.92)#3,588 |
| 84. | Fairland | 4.0% | 8.5%(-4.48)#84 | 10.0%(-5.91)#3,602 |
| 85. | Marlboro Meadows | 4.0% | 8.5%(-4.47)#85 | 10.0%(-5.90)#3,612 |
| 86. | East New Market | 4.1% | 8.5%(-4.44)#86 | 10.0%(-5.87)#3,658 |
| 87. | Hillsboro | 4.2% | 8.5%(-4.35)#87 | 10.0%(-5.79)#3,795 |
| 88. | Bethesda | 4.2% | 8.5%(-4.34)#88 | 10.0%(-5.77)#3,809 |
| 89. | West Ocean City | 4.2% | 8.5%(-4.33)#89 | 10.0%(-5.77)#3,819 |
| 90. | Maugansville | 4.2% | 8.5%(-4.30)#90 | 10.0%(-5.73)#3,855 |
| 91. | Riverside | 4.3% | 8.5%(-4.26)#91 | 10.0%(-5.69)#3,907 |
| 92. | Callaway | 4.3% | 8.5%(-4.25)#92 | 10.0%(-5.68)#3,916 |
| 93. | Ellicott City | 4.3% | 8.5%(-4.21)#93 | 10.0%(-5.64)#3,982 |
| 94. | Lake Shore | 4.3% | 8.5%(-4.18)#94 | 10.0%(-5.61)#4,022 |
| 95. | Mayo | 4.4% | 8.5%(-4.10)#95 | 10.0%(-5.53)#4,167 |
| 96. | Fort Meade | 4.4% | 8.5%(-4.10)#96 | 10.0%(-5.53)#4,169 |
| 97. | Glenmont | 4.4% | 8.5%(-4.09)#97 | 10.0%(-5.53)#4,172 |
| 98. | Westphalia | 4.4% | 8.5%(-4.08)#98 | 10.0%(-5.51)#4,189 |
| 99. | Ocean City | 4.4% | 8.5%(-4.08)#99 | 10.0%(-5.51)#4,196 |
| 100. | Fort Washington | 4.5% | 8.5%(-4.04)#100 | 10.0%(-5.47)#4,272 |
Common Questions
What are the Top 10 Cities with the Lowest Poverty Level Among Seniors Over the Age of 65 in Maryland?
Top 10 Cities with the Lowest Poverty Level Among Seniors Over the Age of 65 in Maryland are:
#1
0.26%
#2
0.30%
#3
0.34%
#4
0.38%
#5
0.39%
#6
0.52%
#7
0.58%
#8
0.63%
#9
0.88%
#10
0.91%
What city has the Lowest Poverty Level Among Seniors Over the Age of 65 in Maryland?
Baden has the Lowest Poverty Level Among Seniors Over the Age of 65 in Maryland with 0.26%.
What is the Poverty Level Among Seniors Over the Age of 65 in the State of Maryland?
Poverty Level Among Seniors Over the Age of 65 in Maryland is 8.5%.
What is the Poverty Level Among Seniors Over the Age of 65 in the United States?
Poverty Level Among Seniors Over the Age of 65 in the United States is 10.0%.