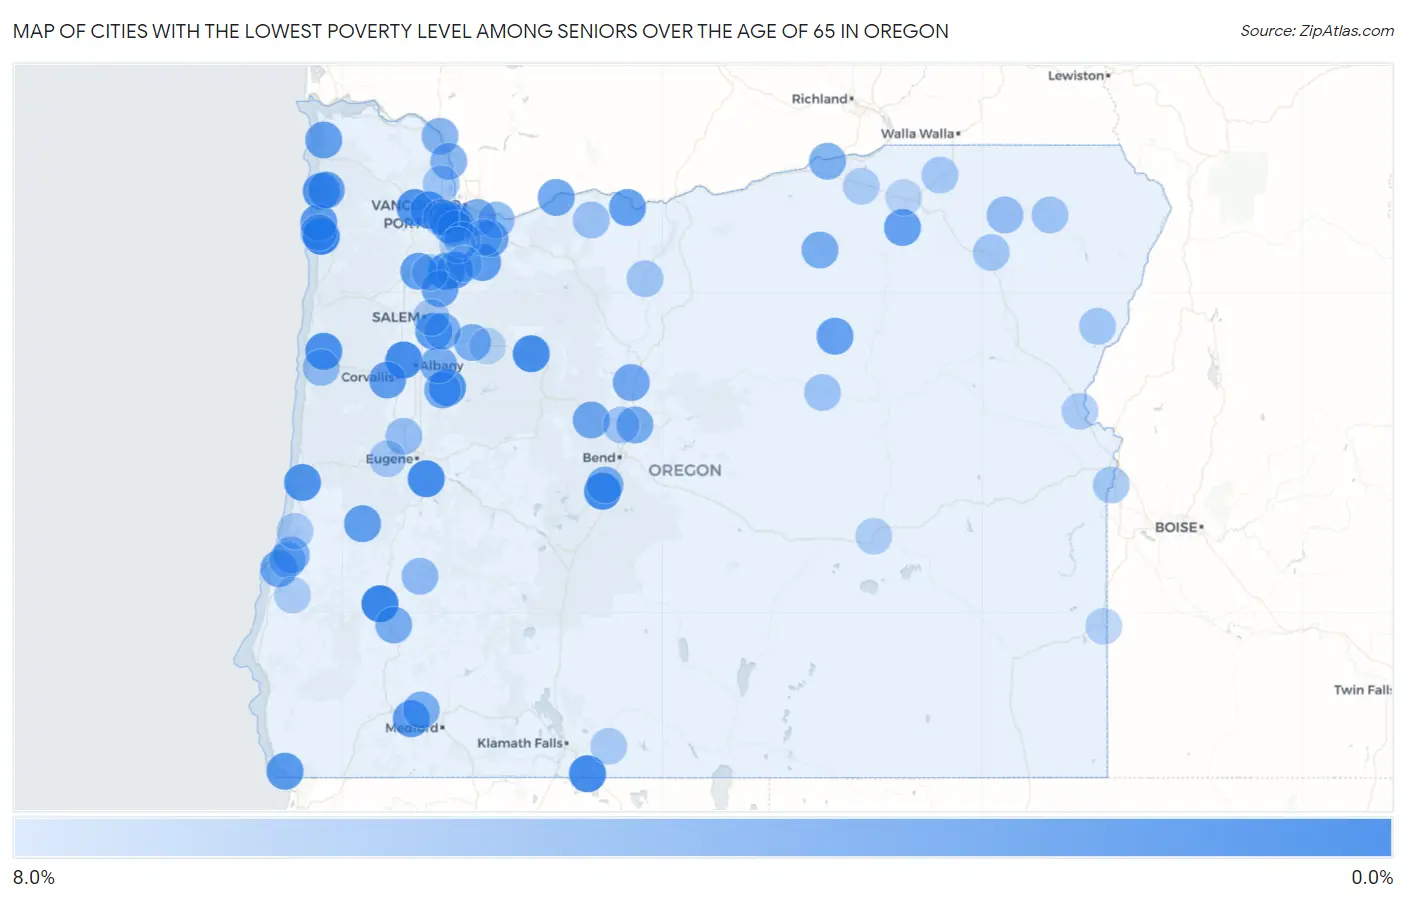
Cities with the Lowest Poverty Level Among Seniors Over the Age of 65 in Oregon
RELATED REPORTS & OPTIONS
Lowest Poverty | Seniors 65+
Oregon
Compare Cities
Map of Cities with the Lowest Poverty Level Among Seniors Over the Age of 65 in Oregon
8.0%
0.0%
Cities with the Lowest Poverty Level Among Seniors Over the Age of 65 in Oregon
| City | Senior Poverty | vs State | vs National | |
| 1. | Netarts | 0.36% | 8.8%(-8.43)#1 | 10.0%(-9.59)#52 |
| 2. | Winston | 0.47% | 8.8%(-8.32)#2 | 10.0%(-9.48)#79 |
| 3. | Merrill | 0.88% | 8.8%(-7.91)#3 | 10.0%(-9.07)#214 |
| 4. | Creswell | 0.93% | 8.8%(-7.85)#4 | 10.0%(-9.02)#246 |
| 5. | Three Rivers | 0.96% | 8.8%(-7.82)#5 | 10.0%(-8.99)#259 |
| 6. | Adair Village | 1.0% | 8.8%(-7.76)#6 | 10.0%(-8.92)#299 |
| 7. | Dunthorpe | 1.1% | 8.8%(-7.68)#7 | 10.0%(-8.85)#347 |
| 8. | Idanha | 1.1% | 8.8%(-7.66)#8 | 10.0%(-8.83)#358 |
| 9. | Siletz | 1.3% | 8.8%(-7.45)#9 | 10.0%(-8.61)#529 |
| 10. | Manzanita | 1.5% | 8.8%(-7.27)#10 | 10.0%(-8.43)#665 |
| 11. | Banks | 1.6% | 8.8%(-7.21)#11 | 10.0%(-8.38)#701 |
| 12. | Dunes City | 1.6% | 8.8%(-7.18)#12 | 10.0%(-8.34)#739 |
| 13. | Donald | 1.7% | 8.8%(-7.09)#13 | 10.0%(-8.26)#802 |
| 14. | Waterloo | 1.7% | 8.8%(-7.09)#14 | 10.0%(-8.26)#813 |
| 15. | Boring | 1.9% | 8.8%(-6.93)#15 | 10.0%(-8.10)#952 |
| 16. | Cedar Hills | 1.9% | 8.8%(-6.93)#16 | 10.0%(-8.09)#954 |
| 17. | North Plains | 1.9% | 8.8%(-6.89)#17 | 10.0%(-8.05)#988 |
| 18. | Harbor | 2.0% | 8.8%(-6.83)#18 | 10.0%(-7.99)#1,046 |
| 19. | Foots Creek | 2.0% | 8.8%(-6.75)#19 | 10.0%(-7.91)#1,121 |
| 20. | Beavercreek | 2.1% | 8.8%(-6.70)#20 | 10.0%(-7.87)#1,167 |
| 21. | Aurora | 2.2% | 8.8%(-6.60)#21 | 10.0%(-7.77)#1,257 |
| 22. | Cape Meares | 2.2% | 8.8%(-6.55)#22 | 10.0%(-7.71)#1,314 |
| 23. | Philomath | 2.3% | 8.8%(-6.50)#23 | 10.0%(-7.66)#1,366 |
| 24. | Turner | 2.3% | 8.8%(-6.45)#24 | 10.0%(-7.61)#1,416 |
| 25. | Elkton | 2.4% | 8.8%(-6.43)#25 | 10.0%(-7.60)#1,433 |
| 26. | Dayton | 2.4% | 8.8%(-6.40)#26 | 10.0%(-7.57)#1,480 |
| 27. | Chenoweth | 2.4% | 8.8%(-6.36)#27 | 10.0%(-7.52)#1,514 |
| 28. | Nehalem | 2.5% | 8.8%(-6.29)#28 | 10.0%(-7.45)#1,590 |
| 29. | Monument | 2.5% | 8.8%(-6.29)#29 | 10.0%(-7.45)#1,593 |
| 30. | Gearhart | 2.5% | 8.8%(-6.28)#30 | 10.0%(-7.45)#1,597 |
| 31. | Pilot Rock | 2.5% | 8.8%(-6.27)#31 | 10.0%(-7.43)#1,611 |
| 32. | Gervais | 2.7% | 8.8%(-6.07)#32 | 10.0%(-7.23)#1,851 |
| 33. | Damascus | 2.8% | 8.8%(-6.03)#33 | 10.0%(-7.19)#1,880 |
| 34. | Cascade Locks | 2.8% | 8.8%(-5.95)#34 | 10.0%(-7.11)#1,972 |
| 35. | West Haven Sylvan | 2.9% | 8.8%(-5.88)#35 | 10.0%(-7.05)#2,060 |
| 36. | Cedar Mill | 2.9% | 8.8%(-5.88)#36 | 10.0%(-7.05)#2,062 |
| 37. | Barview | 2.9% | 8.8%(-5.86)#37 | 10.0%(-7.03)#2,079 |
| 38. | Sisters | 2.9% | 8.8%(-5.84)#38 | 10.0%(-7.01)#2,121 |
| 39. | Culver | 3.0% | 8.8%(-5.74)#39 | 10.0%(-6.90)#2,238 |
| 40. | Marlene | 3.2% | 8.8%(-5.62)#40 | 10.0%(-6.78)#2,395 |
| 41. | Redmond | 3.3% | 8.8%(-5.44)#41 | 10.0%(-6.61)#2,652 |
| 42. | Oak Hills | 3.4% | 8.8%(-5.38)#42 | 10.0%(-6.54)#2,726 |
| 43. | Maywood Park | 3.4% | 8.8%(-5.36)#43 | 10.0%(-6.53)#2,748 |
| 44. | Sodaville | 3.4% | 8.8%(-5.34)#44 | 10.0%(-6.50)#2,790 |
| 45. | Tri City | 3.5% | 8.8%(-5.29)#45 | 10.0%(-6.46)#2,839 |
| 46. | Heppner | 3.5% | 8.8%(-5.29)#46 | 10.0%(-6.46)#2,843 |
| 47. | Crabtree | 3.5% | 8.8%(-5.29)#47 | 10.0%(-6.46)#2,845 |
| 48. | Sunriver | 3.5% | 8.8%(-5.26)#48 | 10.0%(-6.43)#2,878 |
| 49. | Lyons | 3.6% | 8.8%(-5.23)#49 | 10.0%(-6.39)#2,923 |
| 50. | Gold Hill | 3.6% | 8.8%(-5.19)#50 | 10.0%(-6.35)#3,010 |
| 51. | Irrigon | 3.7% | 8.8%(-5.08)#51 | 10.0%(-6.25)#3,132 |
| 52. | Aumsville | 3.7% | 8.8%(-5.06)#52 | 10.0%(-6.22)#3,178 |
| 53. | Prescott | 3.8% | 8.8%(-4.94)#53 | 10.0%(-6.11)#3,344 |
| 54. | Columbia City | 3.9% | 8.8%(-4.89)#54 | 10.0%(-6.06)#3,386 |
| 55. | Glasgow | 3.9% | 8.8%(-4.86)#55 | 10.0%(-6.03)#3,425 |
| 56. | Raleigh Hills | 4.0% | 8.8%(-4.81)#56 | 10.0%(-5.97)#3,505 |
| 57. | Troutdale | 4.4% | 8.8%(-4.36)#57 | 10.0%(-5.52)#4,177 |
| 58. | Glide | 4.5% | 8.8%(-4.29)#58 | 10.0%(-5.46)#4,288 |
| 59. | North Bend | 4.6% | 8.8%(-4.23)#59 | 10.0%(-5.40)#4,386 |
| 60. | Toledo | 4.6% | 8.8%(-4.14)#60 | 10.0%(-5.30)#4,500 |
| 61. | Green Meadows | 4.8% | 8.8%(-4.02)#61 | 10.0%(-5.19)#4,639 |
| 62. | Oceanside | 4.8% | 8.8%(-4.02)#62 | 10.0%(-5.19)#4,642 |
| 63. | Elgin | 4.8% | 8.8%(-3.96)#63 | 10.0%(-5.13)#4,752 |
| 64. | Junction City | 4.9% | 8.8%(-3.89)#64 | 10.0%(-5.06)#4,840 |
| 65. | Prineville Lake Acres | 5.0% | 8.8%(-3.80)#65 | 10.0%(-4.96)#4,971 |
| 66. | Mount Hood | 5.0% | 8.8%(-3.75)#66 | 10.0%(-4.92)#5,046 |
| 67. | Dayville | 5.2% | 8.8%(-3.61)#67 | 10.0%(-4.78)#5,247 |
| 68. | Wallowa | 5.2% | 8.8%(-3.60)#68 | 10.0%(-4.77)#5,262 |
| 69. | Santa Clara | 5.2% | 8.8%(-3.59)#69 | 10.0%(-4.76)#5,278 |
| 70. | Scappoose | 5.2% | 8.8%(-3.56)#70 | 10.0%(-4.72)#5,325 |
| 71. | Happy Valley | 5.3% | 8.8%(-3.53)#71 | 10.0%(-4.70)#5,363 |
| 72. | Maupin | 5.3% | 8.8%(-3.52)#72 | 10.0%(-4.69)#5,389 |
| 73. | Eagle Crest | 5.3% | 8.8%(-3.52)#73 | 10.0%(-4.69)#5,423 |
| 74. | Rockcreek | 5.3% | 8.8%(-3.45)#74 | 10.0%(-4.62)#5,511 |
| 75. | Four Corners | 5.4% | 8.8%(-3.42)#75 | 10.0%(-4.59)#5,552 |
| 76. | Island City | 5.4% | 8.8%(-3.39)#76 | 10.0%(-4.55)#5,594 |
| 77. | Halfway | 5.4% | 8.8%(-3.35)#77 | 10.0%(-4.52)#5,664 |
| 78. | Veneta | 5.5% | 8.8%(-3.31)#78 | 10.0%(-4.48)#5,724 |
| 79. | Nyssa | 5.5% | 8.8%(-3.28)#79 | 10.0%(-4.45)#5,777 |
| 80. | Keno | 5.5% | 8.8%(-3.26)#80 | 10.0%(-4.43)#5,818 |
| 81. | Lake Oswego | 5.6% | 8.8%(-3.19)#81 | 10.0%(-4.35)#5,956 |
| 82. | Athena | 5.6% | 8.8%(-3.17)#82 | 10.0%(-4.34)#5,976 |
| 83. | Lakeside | 5.8% | 8.8%(-3.03)#83 | 10.0%(-4.19)#6,203 |
| 84. | Juniper Canyon | 5.8% | 8.8%(-3.00)#84 | 10.0%(-4.17)#6,247 |
| 85. | Bonanza | 5.9% | 8.8%(-2.94)#85 | 10.0%(-4.10)#6,351 |
| 86. | Huntington | 5.9% | 8.8%(-2.93)#86 | 10.0%(-4.10)#6,358 |
| 87. | Running Y Ranch | 5.9% | 8.8%(-2.92)#87 | 10.0%(-4.09)#6,373 |
| 88. | Svensen | 5.9% | 8.8%(-2.90)#88 | 10.0%(-4.07)#6,408 |
| 89. | Echo | 5.9% | 8.8%(-2.90)#89 | 10.0%(-4.07)#6,419 |
| 90. | St Paul | 5.9% | 8.8%(-2.90)#90 | 10.0%(-4.07)#6,421 |
| 91. | Coquille | 6.0% | 8.8%(-2.83)#91 | 10.0%(-4.00)#6,548 |
| 92. | Hines | 6.0% | 8.8%(-2.79)#92 | 10.0%(-3.96)#6,603 |
| 93. | Rivergrove | 6.1% | 8.8%(-2.68)#93 | 10.0%(-3.84)#6,777 |
| 94. | Marcola | 6.1% | 8.8%(-2.66)#94 | 10.0%(-3.83)#6,803 |
| 95. | Jordan Valley | 6.2% | 8.8%(-2.54)#95 | 10.0%(-3.70)#7,022 |
| 96. | Canby | 6.3% | 8.8%(-2.46)#96 | 10.0%(-3.62)#7,129 |
| 97. | Heceta Beach | 6.4% | 8.8%(-2.41)#97 | 10.0%(-3.57)#7,198 |
| 98. | Pendleton | 6.4% | 8.8%(-2.40)#98 | 10.0%(-3.57)#7,215 |
| 99. | Mill City | 6.4% | 8.8%(-2.38)#99 | 10.0%(-3.55)#7,235 |
| 100. | Bayshore | 6.4% | 8.8%(-2.37)#100 | 10.0%(-3.54)#7,247 |
Common Questions
What are the Top 10 Cities with the Lowest Poverty Level Among Seniors Over the Age of 65 in Oregon?
Top 10 Cities with the Lowest Poverty Level Among Seniors Over the Age of 65 in Oregon are:
#1
0.36%
#2
0.47%
#3
0.88%
#4
0.93%
#5
0.96%
#6
1.0%
#7
1.1%
#8
1.3%
#9
1.5%
#10
1.6%
What city has the Lowest Poverty Level Among Seniors Over the Age of 65 in Oregon?
Netarts has the Lowest Poverty Level Among Seniors Over the Age of 65 in Oregon with 0.36%.
What is the Poverty Level Among Seniors Over the Age of 65 in the State of Oregon?
Poverty Level Among Seniors Over the Age of 65 in Oregon is 8.8%.
What is the Poverty Level Among Seniors Over the Age of 65 in the United States?
Poverty Level Among Seniors Over the Age of 65 in the United States is 10.0%.