Cities with the Lowest Poverty Level Among Seniors Over the Age of 65 in Kansas
RELATED REPORTS & OPTIONS
Lowest Poverty | Seniors 65+
Kansas
Compare Cities
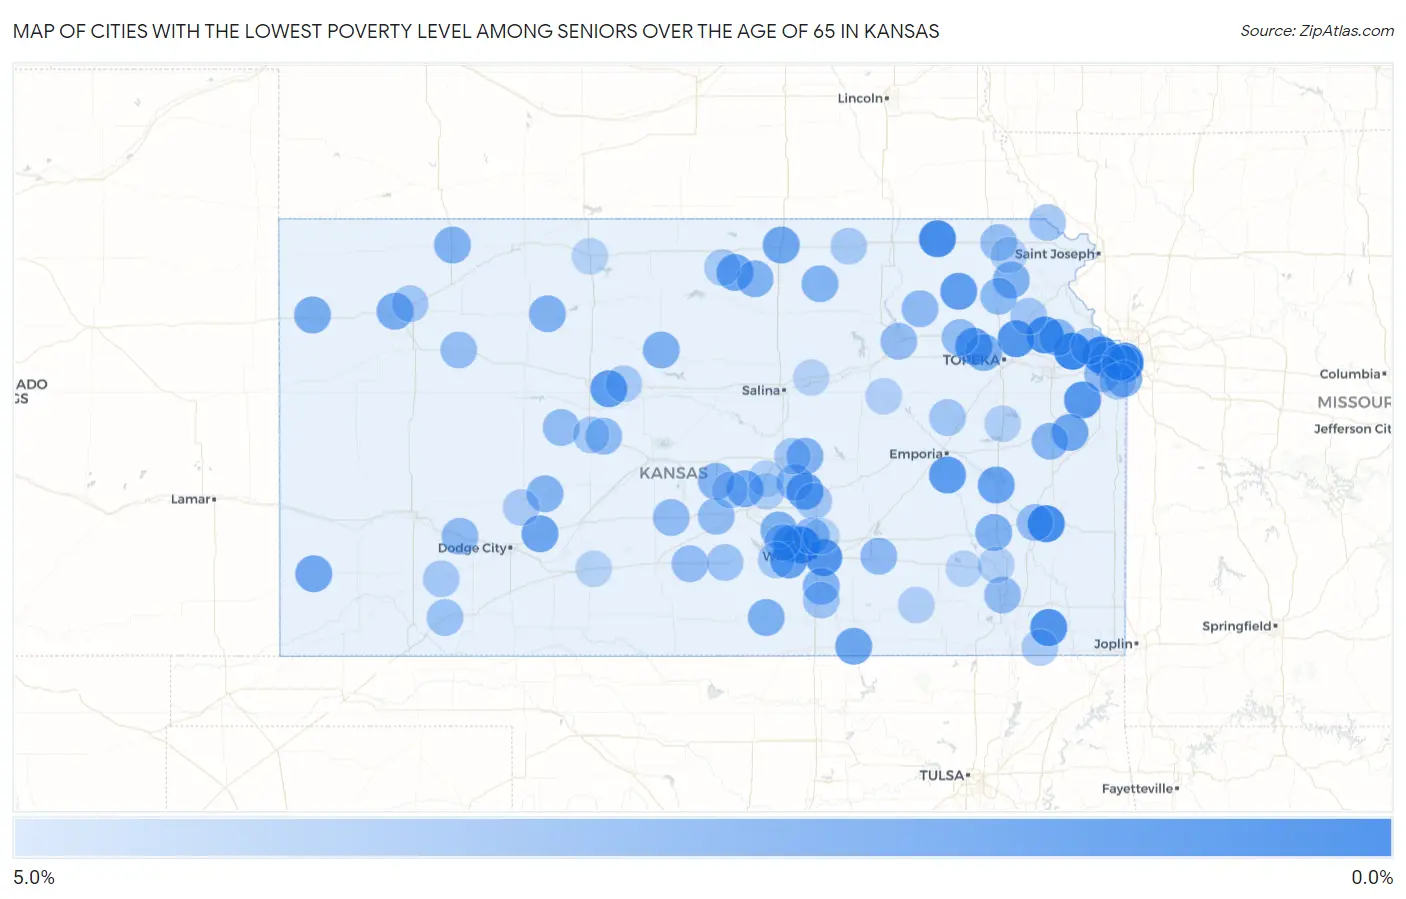
Map of Cities with the Lowest Poverty Level Among Seniors Over the Age of 65 in Kansas
5.0%
0.0%
Cities with the Lowest Poverty Level Among Seniors Over the Age of 65 in Kansas
| City | Senior Poverty | vs State | vs National | |
| 1. | Maize | 0.20% | 8.2%(-8.03)#1 | 10.0%(-9.75)#16 |
| 2. | Edwardsville | 0.22% | 8.2%(-8.00)#2 | 10.0%(-9.73)#24 |
| 3. | Tonganoxie | 0.26% | 8.2%(-7.97)#3 | 10.0%(-9.70)#34 |
| 4. | La Harpe | 0.68% | 8.2%(-7.54)#4 | 10.0%(-9.27)#133 |
| 5. | Axtell | 0.75% | 8.2%(-7.48)#5 | 10.0%(-9.20)#161 |
| 6. | Oskaloosa | 0.85% | 8.2%(-7.37)#6 | 10.0%(-9.10)#198 |
| 7. | Westwood | 1.0% | 8.2%(-7.19)#7 | 10.0%(-8.92)#305 |
| 8. | Altamont | 1.1% | 8.2%(-7.16)#8 | 10.0%(-8.88)#319 |
| 9. | Mission Hills | 1.1% | 8.2%(-7.14)#9 | 10.0%(-8.86)#333 |
| 10. | Meriden | 1.2% | 8.2%(-7.02)#10 | 10.0%(-8.75)#422 |
| 11. | Eastborough | 1.3% | 8.2%(-6.95)#11 | 10.0%(-8.67)#479 |
| 12. | Edgerton | 1.4% | 8.2%(-6.88)#12 | 10.0%(-8.60)#542 |
| 13. | Victoria | 1.6% | 8.2%(-6.68)#13 | 10.0%(-8.40)#684 |
| 14. | Olpe | 1.6% | 8.2%(-6.67)#14 | 10.0%(-8.39)#696 |
| 15. | Rossville | 1.6% | 8.2%(-6.63)#15 | 10.0%(-8.35)#727 |
| 16. | Colwich | 1.7% | 8.2%(-6.54)#16 | 10.0%(-8.26)#798 |
| 17. | Havensville | 1.7% | 8.2%(-6.50)#17 | 10.0%(-8.23)#844 |
| 18. | Hesston | 1.8% | 8.2%(-6.48)#18 | 10.0%(-8.20)#861 |
| 19. | Goddard | 1.9% | 8.2%(-6.35)#19 | 10.0%(-8.07)#970 |
| 20. | Burlington | 2.1% | 8.2%(-6.13)#20 | 10.0%(-7.85)#1,188 |
| 21. | Randall | 2.1% | 8.2%(-6.10)#21 | 10.0%(-7.82)#1,214 |
| 22. | Belleville | 2.2% | 8.2%(-5.99)#22 | 10.0%(-7.72)#1,311 |
| 23. | Spearville | 2.2% | 8.2%(-5.98)#23 | 10.0%(-7.70)#1,325 |
| 24. | Parkerfield | 2.3% | 8.2%(-5.96)#24 | 10.0%(-7.68)#1,352 |
| 25. | Rantoul | 2.3% | 8.2%(-5.96)#25 | 10.0%(-7.68)#1,356 |
| 26. | Johnson City | 2.3% | 8.2%(-5.90)#26 | 10.0%(-7.63)#1,397 |
| 27. | The Highlands | 2.5% | 8.2%(-5.71)#27 | 10.0%(-7.44)#1,610 |
| 28. | Colby | 2.6% | 8.2%(-5.61)#28 | 10.0%(-7.33)#1,727 |
| 29. | Goodland | 2.6% | 8.2%(-5.59)#29 | 10.0%(-7.31)#1,760 |
| 30. | Mount Hope | 2.8% | 8.2%(-5.47)#30 | 10.0%(-7.19)#1,884 |
| 31. | Argonia | 2.8% | 8.2%(-5.40)#31 | 10.0%(-7.12)#1,963 |
| 32. | Whiting | 2.9% | 8.2%(-5.37)#32 | 10.0%(-7.09)#2,005 |
| 33. | Luray | 2.9% | 8.2%(-5.37)#33 | 10.0%(-7.09)#2,010 |
| 34. | Yates Center | 2.9% | 8.2%(-5.35)#34 | 10.0%(-7.08)#2,032 |
| 35. | Silver Lake | 2.9% | 8.2%(-5.35)#35 | 10.0%(-7.08)#2,033 |
| 36. | Lake Quivira | 2.9% | 8.2%(-5.34)#36 | 10.0%(-7.06)#2,044 |
| 37. | Leawood | 2.9% | 8.2%(-5.33)#37 | 10.0%(-7.05)#2,058 |
| 38. | Oberlin | 2.9% | 8.2%(-5.29)#38 | 10.0%(-7.02)#2,091 |
| 39. | Jamestown | 2.9% | 8.2%(-5.29)#39 | 10.0%(-7.01)#2,113 |
| 40. | Bogue | 2.9% | 8.2%(-5.29)#40 | 10.0%(-7.01)#2,119 |
| 41. | Canton | 3.0% | 8.2%(-5.24)#41 | 10.0%(-6.97)#2,162 |
| 42. | Mulvane | 3.0% | 8.2%(-5.23)#42 | 10.0%(-6.95)#2,172 |
| 43. | Vining | 3.0% | 8.2%(-5.20)#43 | 10.0%(-6.92)#2,227 |
| 44. | Hanston | 3.1% | 8.2%(-5.10)#44 | 10.0%(-6.83)#2,337 |
| 45. | Sterling | 3.2% | 8.2%(-5.04)#45 | 10.0%(-6.77)#2,418 |
| 46. | Princeton | 3.2% | 8.2%(-5.00)#46 | 10.0%(-6.73)#2,476 |
| 47. | Mclouth | 3.3% | 8.2%(-4.95)#47 | 10.0%(-6.67)#2,538 |
| 48. | Holton | 3.3% | 8.2%(-4.89)#48 | 10.0%(-6.61)#2,648 |
| 49. | Westmoreland | 3.4% | 8.2%(-4.82)#49 | 10.0%(-6.54)#2,732 |
| 50. | Lenexa | 3.4% | 8.2%(-4.82)#50 | 10.0%(-6.54)#2,734 |
| 51. | Valley Center | 3.4% | 8.2%(-4.80)#51 | 10.0%(-6.53)#2,745 |
| 52. | Leon | 3.4% | 8.2%(-4.78)#52 | 10.0%(-6.50)#2,783 |
| 53. | Ingalls | 3.4% | 8.2%(-4.78)#53 | 10.0%(-6.50)#2,794 |
| 54. | Moundridge | 3.5% | 8.2%(-4.73)#54 | 10.0%(-6.46)#2,837 |
| 55. | Stafford | 3.5% | 8.2%(-4.70)#55 | 10.0%(-6.42)#2,887 |
| 56. | St Marys | 3.6% | 8.2%(-4.66)#56 | 10.0%(-6.38)#2,933 |
| 57. | Bison | 3.6% | 8.2%(-4.66)#57 | 10.0%(-6.38)#2,959 |
| 58. | Mccracken | 3.6% | 8.2%(-4.66)#58 | 10.0%(-6.38)#2,966 |
| 59. | Abbyville | 3.6% | 8.2%(-4.66)#59 | 10.0%(-6.38)#2,972 |
| 60. | Neodesha | 3.6% | 8.2%(-4.61)#60 | 10.0%(-6.34)#3,024 |
| 61. | Manhattan | 3.6% | 8.2%(-4.60)#61 | 10.0%(-6.32)#3,047 |
| 62. | Iola | 3.7% | 8.2%(-4.57)#62 | 10.0%(-6.29)#3,072 |
| 63. | Cunningham | 3.7% | 8.2%(-4.56)#63 | 10.0%(-6.28)#3,092 |
| 64. | Fairview | 3.7% | 8.2%(-4.52)#64 | 10.0%(-6.25)#3,148 |
| 65. | Grainfield | 3.7% | 8.2%(-4.52)#65 | 10.0%(-6.25)#3,154 |
| 66. | Greeley County Unified Government (Balance) | 3.8% | 8.2%(-4.38)#66 | 10.0%(-6.11)#3,334 |
| 67. | Andale | 3.9% | 8.2%(-4.34)#67 | 10.0%(-6.07)#3,375 |
| 68. | Kingman | 4.0% | 8.2%(-4.25)#68 | 10.0%(-5.97)#3,508 |
| 69. | Plains | 4.0% | 8.2%(-4.23)#69 | 10.0%(-5.95)#3,536 |
| 70. | White Cloud | 4.0% | 8.2%(-4.23)#70 | 10.0%(-5.95)#3,569 |
| 71. | Belle Plaine | 4.1% | 8.2%(-4.14)#71 | 10.0%(-5.86)#3,669 |
| 72. | North Newton | 4.1% | 8.2%(-4.13)#72 | 10.0%(-5.85)#3,682 |
| 73. | Valley Falls | 4.2% | 8.2%(-4.06)#73 | 10.0%(-5.79)#3,771 |
| 74. | Allen | 4.2% | 8.2%(-4.06)#74 | 10.0%(-5.79)#3,791 |
| 75. | Gem | 4.2% | 8.2%(-4.06)#75 | 10.0%(-5.79)#3,797 |
| 76. | Basehor | 4.2% | 8.2%(-4.03)#76 | 10.0%(-5.75)#3,831 |
| 77. | La Crosse | 4.3% | 8.2%(-3.97)#77 | 10.0%(-5.70)#3,887 |
| 78. | Copeland | 4.3% | 8.2%(-3.97)#78 | 10.0%(-5.70)#3,894 |
| 79. | Galva | 4.3% | 8.2%(-3.93)#79 | 10.0%(-5.65)#3,957 |
| 80. | Garden Plain | 4.3% | 8.2%(-3.93)#80 | 10.0%(-5.65)#3,958 |
| 81. | Overland Park | 4.3% | 8.2%(-3.91)#81 | 10.0%(-5.64)#3,987 |
| 82. | Washington | 4.3% | 8.2%(-3.90)#82 | 10.0%(-5.62)#4,003 |
| 83. | Jewell | 4.4% | 8.2%(-3.83)#83 | 10.0%(-5.56)#4,122 |
| 84. | Nickerson | 4.4% | 8.2%(-3.82)#84 | 10.0%(-5.54)#4,146 |
| 85. | Gorham | 4.4% | 8.2%(-3.82)#85 | 10.0%(-5.54)#4,157 |
| 86. | Edna | 4.4% | 8.2%(-3.82)#86 | 10.0%(-5.54)#4,158 |
| 87. | Jetmore | 4.4% | 8.2%(-3.78)#87 | 10.0%(-5.51)#4,205 |
| 88. | Inman | 4.7% | 8.2%(-3.57)#88 | 10.0%(-5.29)#4,532 |
| 89. | Buhler | 4.7% | 8.2%(-3.55)#89 | 10.0%(-5.27)#4,549 |
| 90. | Grenola | 4.7% | 8.2%(-3.54)#90 | 10.0%(-5.26)#4,563 |
| 91. | Lyndon | 4.7% | 8.2%(-3.52)#91 | 10.0%(-5.25)#4,582 |
| 92. | White City | 4.7% | 8.2%(-3.50)#92 | 10.0%(-5.22)#4,603 |
| 93. | Powhattan | 4.8% | 8.2%(-3.47)#93 | 10.0%(-5.19)#4,672 |
| 94. | Benedict | 4.8% | 8.2%(-3.47)#94 | 10.0%(-5.19)#4,673 |
| 95. | Kechi | 4.8% | 8.2%(-3.40)#95 | 10.0%(-5.13)#4,753 |
| 96. | Greensburg | 4.8% | 8.2%(-3.38)#96 | 10.0%(-5.10)#4,787 |
| 97. | Phillipsburg | 4.9% | 8.2%(-3.37)#97 | 10.0%(-5.09)#4,795 |
| 98. | Fall River | 4.9% | 8.2%(-3.35)#98 | 10.0%(-5.07)#4,825 |
| 99. | Mission | 4.9% | 8.2%(-3.34)#99 | 10.0%(-5.06)#4,832 |
| 100. | Solomon | 4.9% | 8.2%(-3.31)#100 | 10.0%(-5.03)#4,877 |
Common Questions
What are the Top 10 Cities with the Lowest Poverty Level Among Seniors Over the Age of 65 in Kansas?
Top 10 Cities with the Lowest Poverty Level Among Seniors Over the Age of 65 in Kansas are:
#1
0.20%
#2
0.22%
#3
0.26%
#4
0.68%
#5
0.75%
#6
0.85%
#7
1.0%
#8
1.1%
#9
1.1%
#10
1.2%
What city has the Lowest Poverty Level Among Seniors Over the Age of 65 in Kansas?
Maize has the Lowest Poverty Level Among Seniors Over the Age of 65 in Kansas with 0.20%.
What is the Poverty Level Among Seniors Over the Age of 65 in the State of Kansas?
Poverty Level Among Seniors Over the Age of 65 in Kansas is 8.2%.
What is the Poverty Level Among Seniors Over the Age of 65 in the United States?
Poverty Level Among Seniors Over the Age of 65 in the United States is 10.0%.