Alpine, CA Map & Demographics
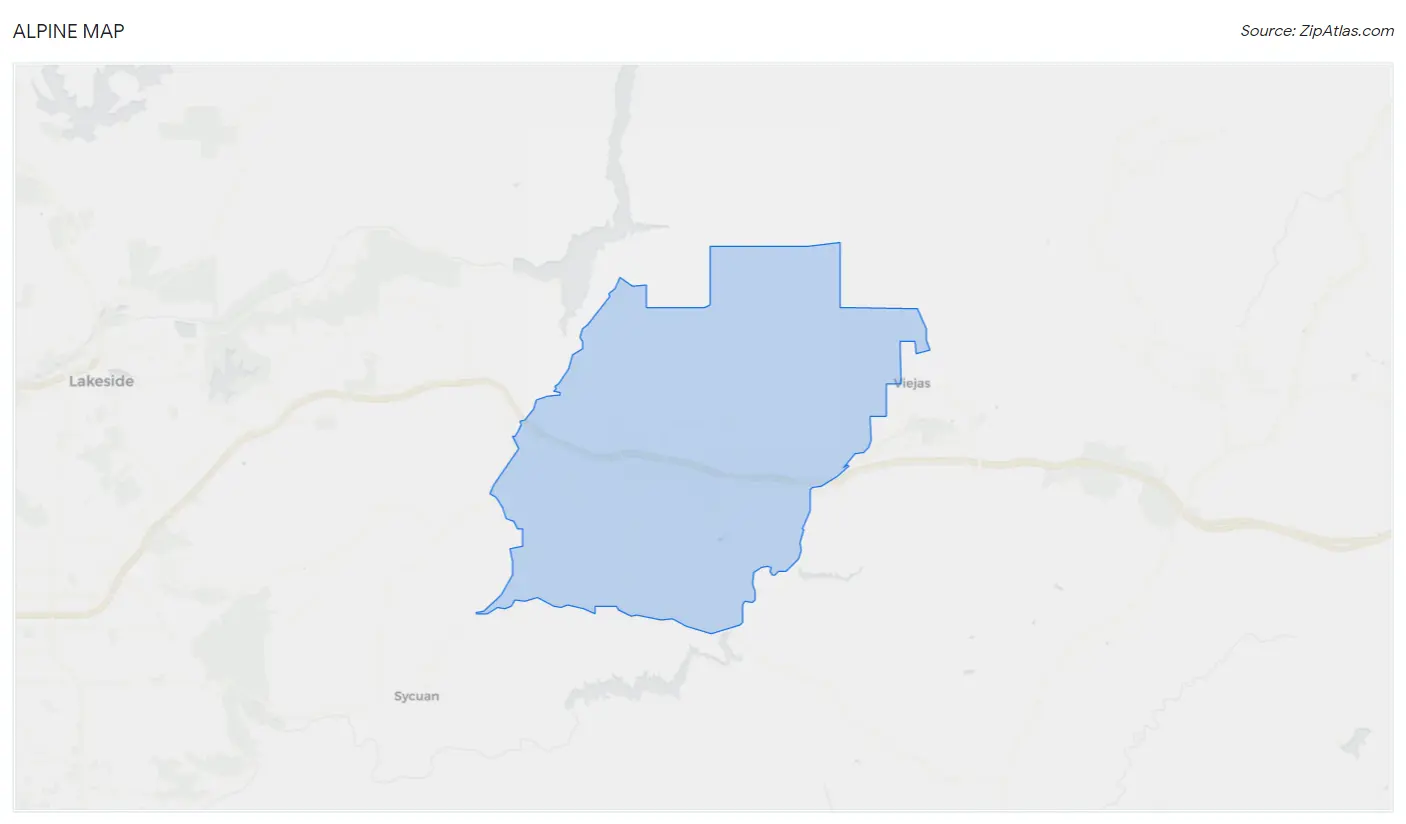
Alpine Map
Alpine Overview
$49,005
PER CAPITA INCOME
$120,216
AVG FAMILY INCOME
$106,433
AVG HOUSEHOLD INCOME
9.3%
WAGE / INCOME GAP [ % ]
90.7¢/ $1
WAGE / INCOME GAP [ $ ]
$8,124
FAMILY INCOME DEFICIT
0.43
INEQUALITY / GINI INDEX
15,911
TOTAL POPULATION
7,660
MALE POPULATION
8,251
FEMALE POPULATION
92.84
MALES / 100 FEMALES
107.72
FEMALES / 100 MALES
41.8
MEDIAN AGE
3.2
AVG FAMILY SIZE
2.9
AVG HOUSEHOLD SIZE
7,692
LABOR FORCE [ PEOPLE ]
60.8%
PERCENT IN LABOR FORCE
5.9%
UNEMPLOYMENT RATE
Alpine Zip Codes
Alpine Area Codes
Income in Alpine
Income Overview in Alpine
Per Capita Income in Alpine is $49,005, while median incomes of families and households are $120,216 and $106,433 respectively.
| Characteristic | Number | Measure |
| Per Capita Income | 15,911 | $49,005 |
| Median Family Income | 4,104 | $120,216 |
| Mean Family Income | 4,104 | $152,249 |
| Median Household Income | 5,464 | $106,433 |
| Mean Household Income | 5,464 | $139,210 |
| Income Deficit | 4,104 | $8,124 |
| Wage / Income Gap (%) | 15,911 | 9.30% |
| Wage / Income Gap ($) | 15,911 | 90.70¢ per $1 |
| Gini / Inequality Index | 15,911 | 0.43 |
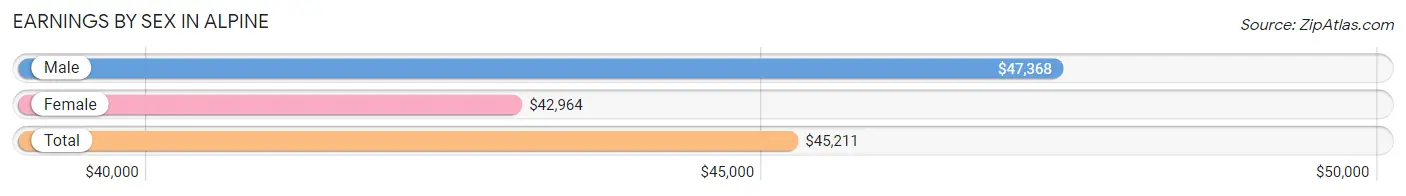
Earnings by Sex in Alpine
Average Earnings in Alpine are $45,211, $47,368 for men and $42,964 for women, a difference of 9.3%.
| Sex | Number | Average Earnings |
| Male | 4,403 (53.0%) | $47,368 |
| Female | 3,898 (47.0%) | $42,964 |
| Total | 8,301 (100.0%) | $45,211 |
Earnings by Sex by Income Bracket in Alpine
The most common earnings brackets in Alpine are $100,000+ for men (1,090 | 24.8%) and $100,000+ for women (791 | 20.3%).
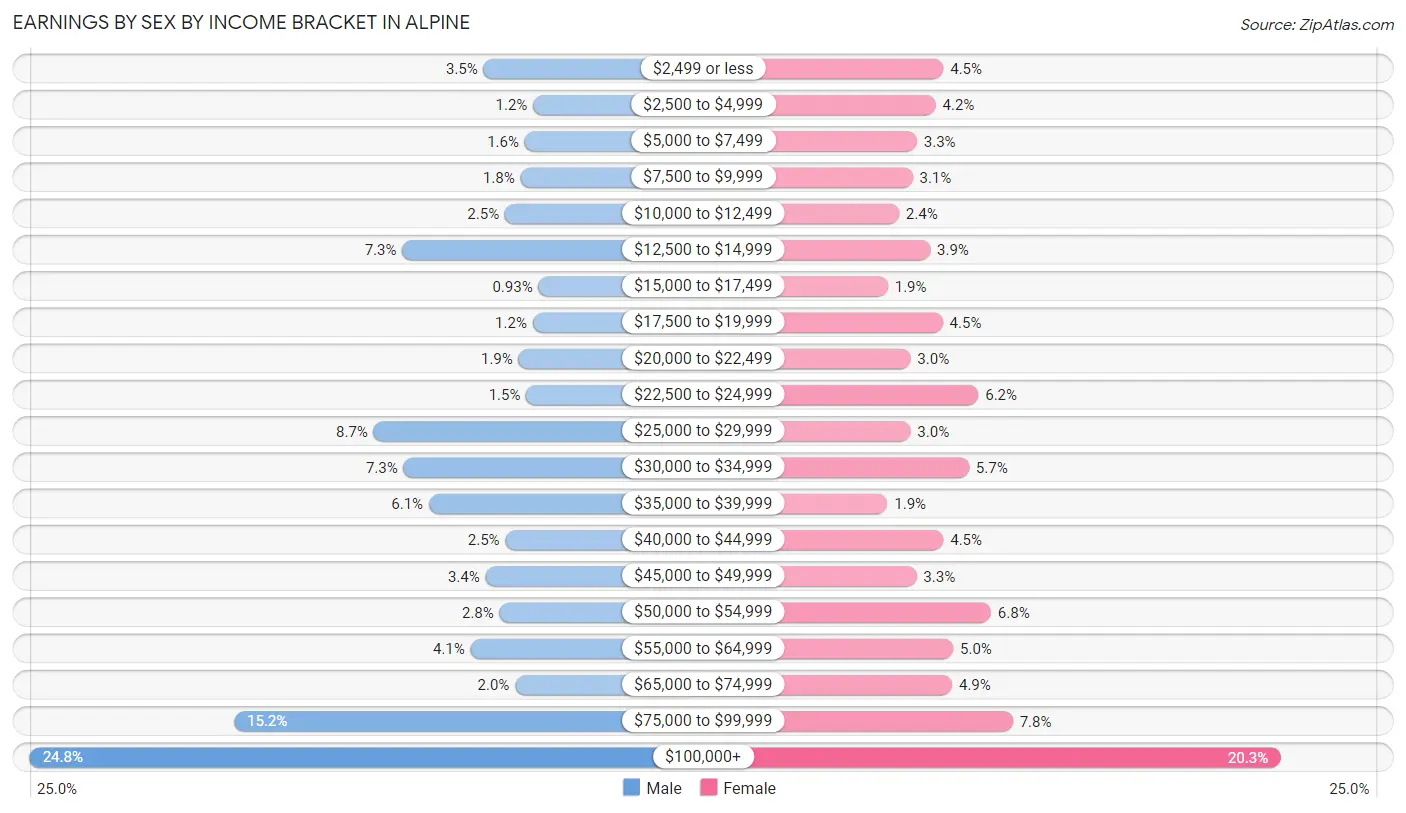
| Income | Male | Female |
| $2,499 or less | 154 (3.5%) | 176 (4.5%) |
| $2,500 to $4,999 | 52 (1.2%) | 162 (4.2%) |
| $5,000 to $7,499 | 69 (1.6%) | 128 (3.3%) |
| $7,500 to $9,999 | 78 (1.8%) | 120 (3.1%) |
| $10,000 to $12,499 | 110 (2.5%) | 95 (2.4%) |
| $12,500 to $14,999 | 322 (7.3%) | 152 (3.9%) |
| $15,000 to $17,499 | 41 (0.9%) | 75 (1.9%) |
| $17,500 to $19,999 | 53 (1.2%) | 175 (4.5%) |
| $20,000 to $22,499 | 82 (1.9%) | 116 (3.0%) |
| $22,500 to $24,999 | 66 (1.5%) | 240 (6.2%) |
| $25,000 to $29,999 | 381 (8.6%) | 116 (3.0%) |
| $30,000 to $34,999 | 319 (7.2%) | 223 (5.7%) |
| $35,000 to $39,999 | 267 (6.1%) | 74 (1.9%) |
| $40,000 to $44,999 | 109 (2.5%) | 176 (4.5%) |
| $45,000 to $49,999 | 150 (3.4%) | 127 (3.3%) |
| $50,000 to $54,999 | 121 (2.8%) | 263 (6.8%) |
| $55,000 to $64,999 | 181 (4.1%) | 194 (5.0%) |
| $65,000 to $74,999 | 89 (2.0%) | 192 (4.9%) |
| $75,000 to $99,999 | 669 (15.2%) | 303 (7.8%) |
| $100,000+ | 1,090 (24.8%) | 791 (20.3%) |
| Total | 4,403 (100.0%) | 3,898 (100.0%) |
Earnings by Sex by Educational Attainment in Alpine
Average earnings in Alpine are $57,195 for men and $47,087 for women, a difference of 17.7%. Men with an educational attainment of graduate degree enjoy the highest average annual earnings of $130,125, while those with high school diploma education earn the least with $36,386. Women with an educational attainment of bachelor's degree earn the most with the average annual earnings of $91,563, while those with less than high school education have the smallest earnings of $16,406.
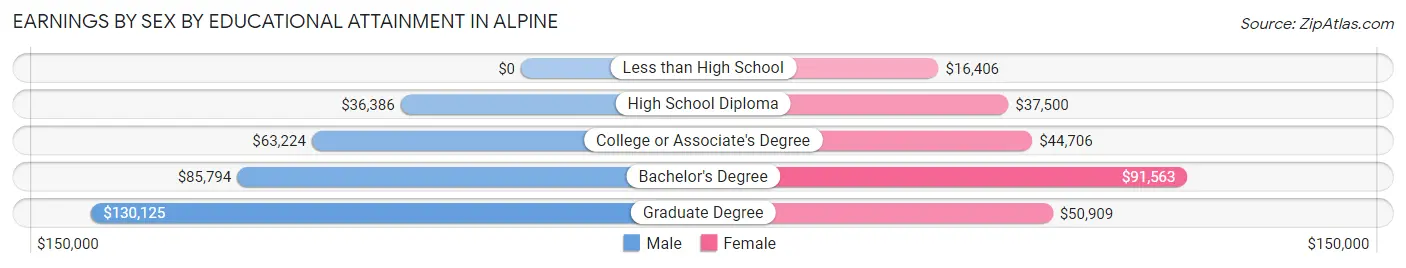
| Educational Attainment | Male Income | Female Income |
| Less than High School | - | - |
| High School Diploma | $36,386 | $37,500 |
| College or Associate's Degree | $63,224 | $44,706 |
| Bachelor's Degree | $85,794 | $91,563 |
| Graduate Degree | $130,125 | $50,909 |
| Total | $57,195 | $47,087 |
Family Income in Alpine
Family Income Brackets in Alpine
According to the Alpine family income data, there are 1,207 families falling into the $100,000 to $149,999 income range, which is the most common income bracket and makes up 29.4% of all families. Conversely, the $10,000 to $14,999 income bracket is the least frequent group with only 21 families (0.5%) belonging to this category.
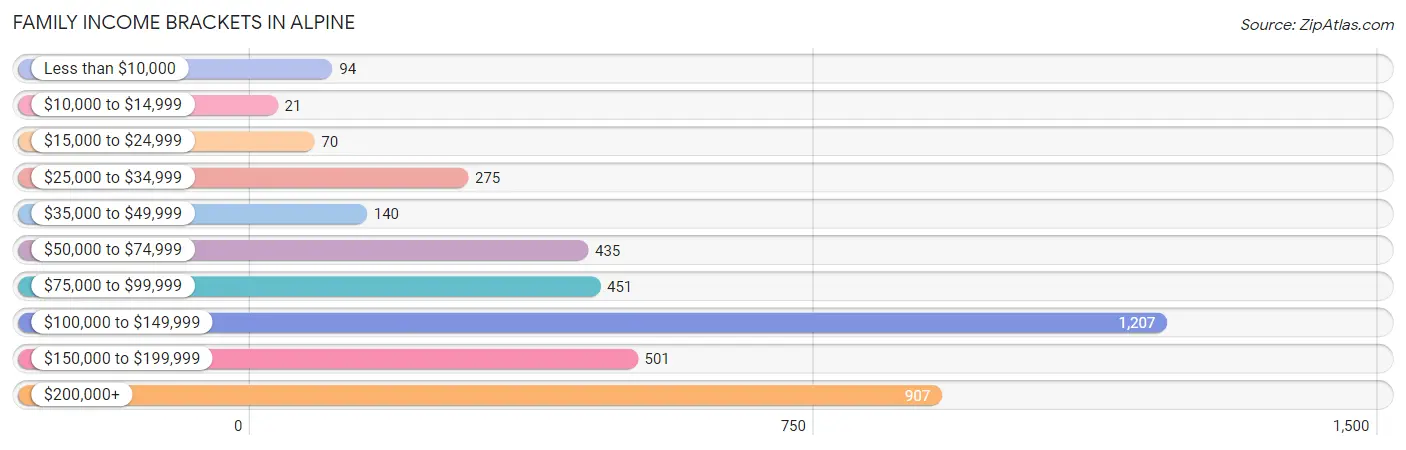
| Income Bracket | # Families | % Families |
| Less than $10,000 | 94 | 2.3% |
| $10,000 to $14,999 | 21 | 0.5% |
| $15,000 to $24,999 | 70 | 1.7% |
| $25,000 to $34,999 | 275 | 6.7% |
| $35,000 to $49,999 | 140 | 3.4% |
| $50,000 to $74,999 | 435 | 10.6% |
| $75,000 to $99,999 | 451 | 11.0% |
| $100,000 to $149,999 | 1,207 | 29.4% |
| $150,000 to $199,999 | 501 | 12.2% |
| $200,000+ | 907 | 22.1% |
Family Income by Famaliy Size in Alpine
7+ person families (45 | 1.1%) account for the highest median family income in Alpine with $177,404 per family, while 2-person families (1,708 | 41.6%) have the highest median income of $58,980 per family member.
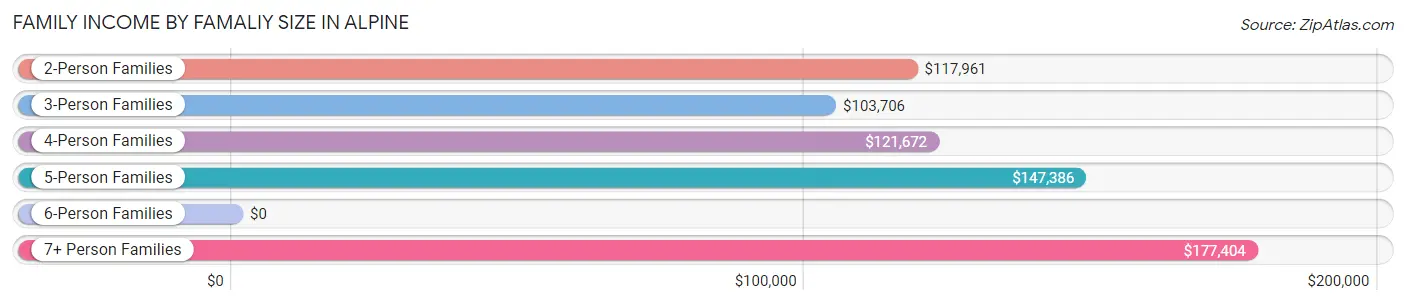
| Income Bracket | # Families | Median Income |
| 2-Person Families | 1,708 (41.6%) | $117,961 |
| 3-Person Families | 905 (22.1%) | $103,706 |
| 4-Person Families | 1,057 (25.8%) | $121,672 |
| 5-Person Families | 251 (6.1%) | $147,386 |
| 6-Person Families | 138 (3.4%) | $0 |
| 7+ Person Families | 45 (1.1%) | $177,404 |
| Total | 4,104 (100.0%) | $120,216 |
Family Income by Number of Earners in Alpine
The median family income in Alpine is $120,216, with families comprising 3+ earners (469) having the highest median family income of $178,373, while families with 1 earner (1,337) have the lowest median family income of $102,863, accounting for 11.4% and 32.6% of families, respectively.
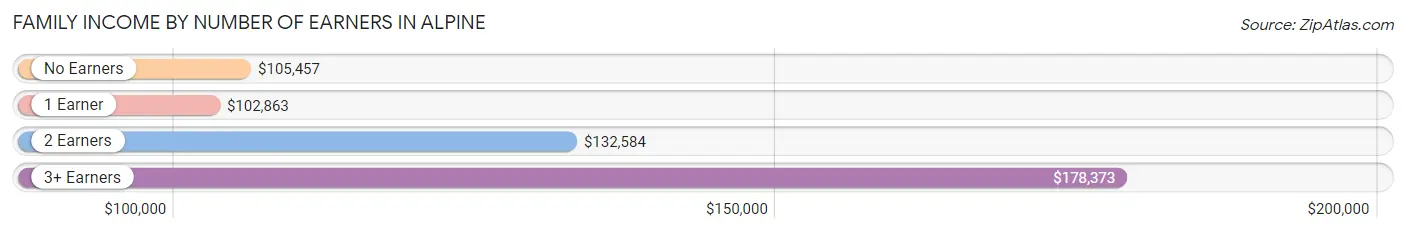
| Number of Earners | # Families | Median Income |
| No Earners | 677 (16.5%) | $105,457 |
| 1 Earner | 1,337 (32.6%) | $102,863 |
| 2 Earners | 1,621 (39.5%) | $132,584 |
| 3+ Earners | 469 (11.4%) | $178,373 |
| Total | 4,104 (100.0%) | $120,216 |
Household Income in Alpine
Household Income Brackets in Alpine
With 1,328 households falling in the category, the $100,000 to $149,999 income range is the most frequent in Alpine, accounting for 24.3% of all households. In contrast, only 98 households (1.8%) fall into the $10,000 to $14,999 income bracket, making it the least populous group.
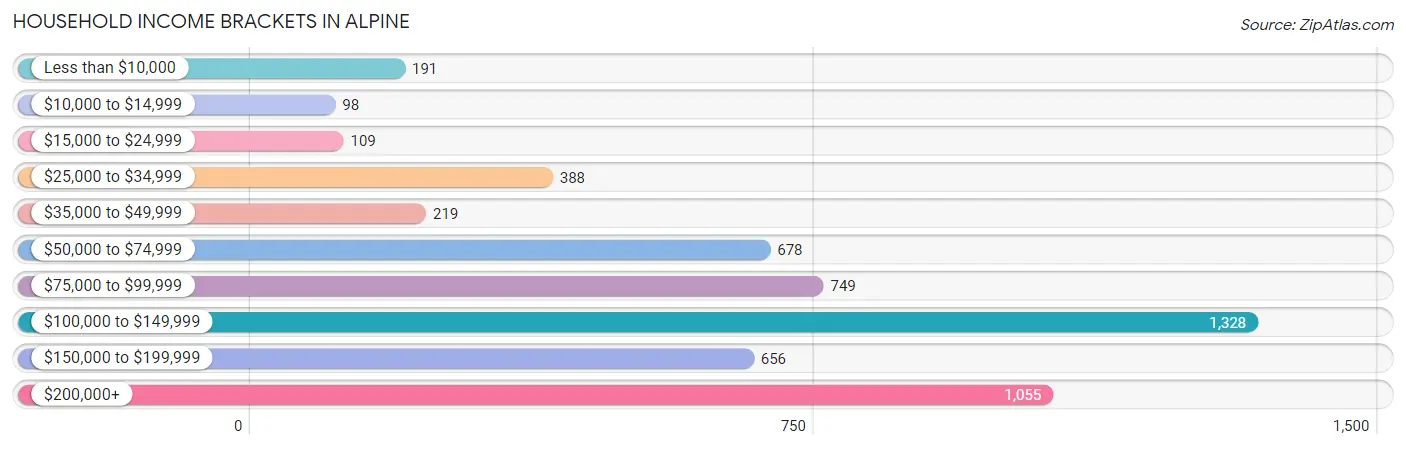
| Income Bracket | # Households | % Households |
| Less than $10,000 | 191 | 3.5% |
| $10,000 to $14,999 | 98 | 1.8% |
| $15,000 to $24,999 | 109 | 2.0% |
| $25,000 to $34,999 | 388 | 7.1% |
| $35,000 to $49,999 | 219 | 4.0% |
| $50,000 to $74,999 | 678 | 12.4% |
| $75,000 to $99,999 | 749 | 13.7% |
| $100,000 to $149,999 | 1,328 | 24.3% |
| $150,000 to $199,999 | 656 | 12.0% |
| $200,000+ | 1,055 | 19.3% |
Household Income by Householder Age in Alpine
The median household income in Alpine is $106,433, with the highest median household income of $113,125 found in the 25 to 44 years age bracket for the primary householder. A total of 1,492 households (27.3%) fall into this category. Meanwhile, the 15 to 24 years age bracket for the primary householder has the lowest median household income of $2,499, with 138 households (2.5%) in this group.
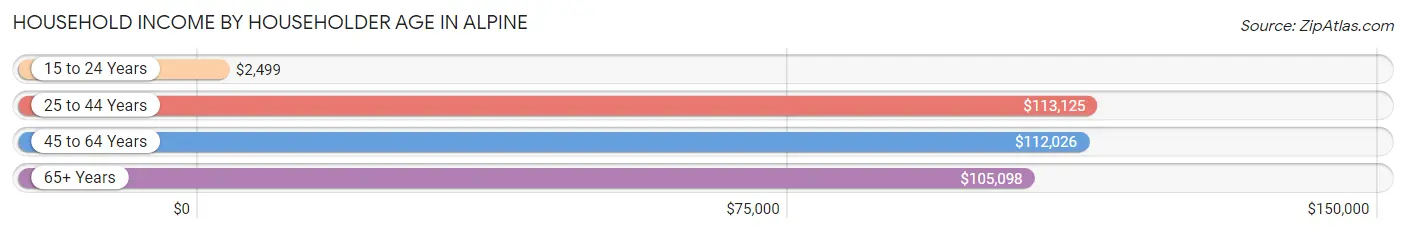
| Income Bracket | # Households | Median Income |
| 15 to 24 Years | 138 (2.5%) | $2,499 |
| 25 to 44 Years | 1,492 (27.3%) | $113,125 |
| 45 to 64 Years | 2,419 (44.3%) | $112,026 |
| 65+ Years | 1,415 (25.9%) | $105,098 |
| Total | 5,464 (100.0%) | $106,433 |
Poverty in Alpine
Income Below Poverty by Sex and Age in Alpine
With 10.2% poverty level for males and 7.7% for females among the residents of Alpine, 18 to 24 year old males and under 5 year old females are the most vulnerable to poverty, with 144 males (20.1%) and 62 females (19.9%) in their respective age groups living below the poverty level.
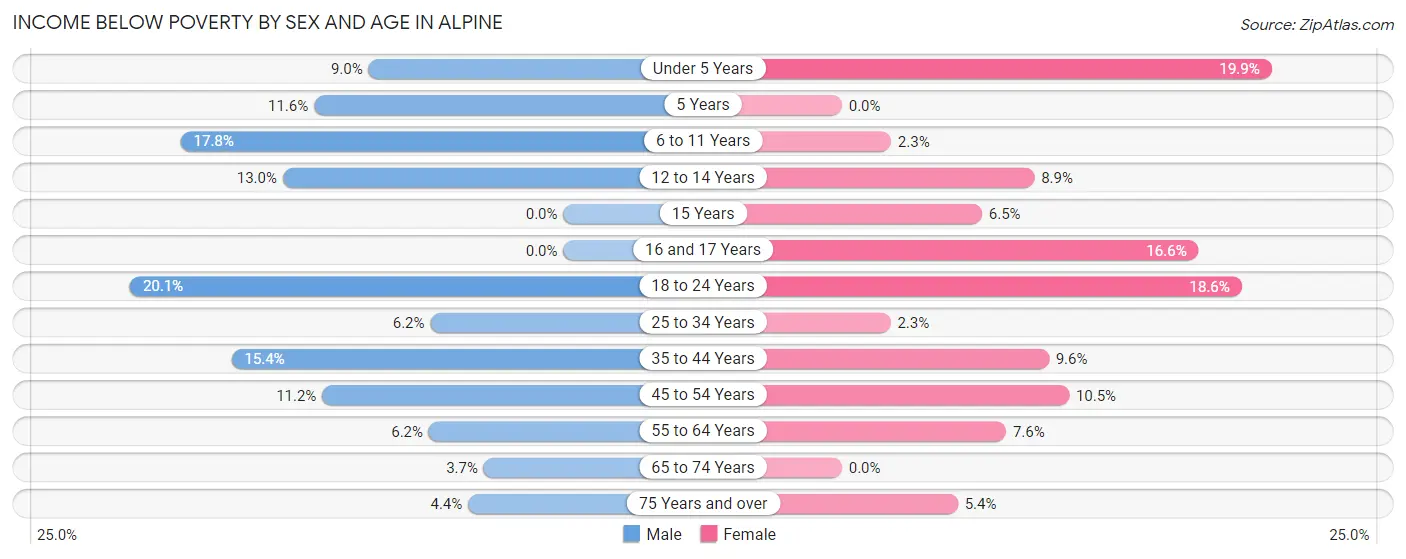
| Age Bracket | Male | Female |
| Under 5 Years | 45 (9.0%) | 62 (19.9%) |
| 5 Years | 14 (11.6%) | 0 (0.0%) |
| 6 to 11 Years | 73 (17.8%) | 17 (2.3%) |
| 12 to 14 Years | 41 (13.0%) | 36 (8.9%) |
| 15 Years | 0 (0.0%) | 8 (6.5%) |
| 16 and 17 Years | 0 (0.0%) | 46 (16.6%) |
| 18 to 24 Years | 144 (20.1%) | 97 (18.5%) |
| 25 to 34 Years | 55 (6.2%) | 22 (2.3%) |
| 35 to 44 Years | 150 (15.4%) | 88 (9.6%) |
| 45 to 54 Years | 139 (11.2%) | 131 (10.5%) |
| 55 to 64 Years | 58 (6.2%) | 83 (7.6%) |
| 65 to 74 Years | 28 (3.7%) | 0 (0.0%) |
| 75 Years and over | 20 (4.4%) | 41 (5.4%) |
| Total | 767 (10.2%) | 631 (7.7%) |
Income Above Poverty by Sex and Age in Alpine
According to the poverty statistics in Alpine, males aged 15 years and females aged 5 years are the age groups that are most secure financially, with 100.0% of males and 100.0% of females in these age groups living above the poverty line.
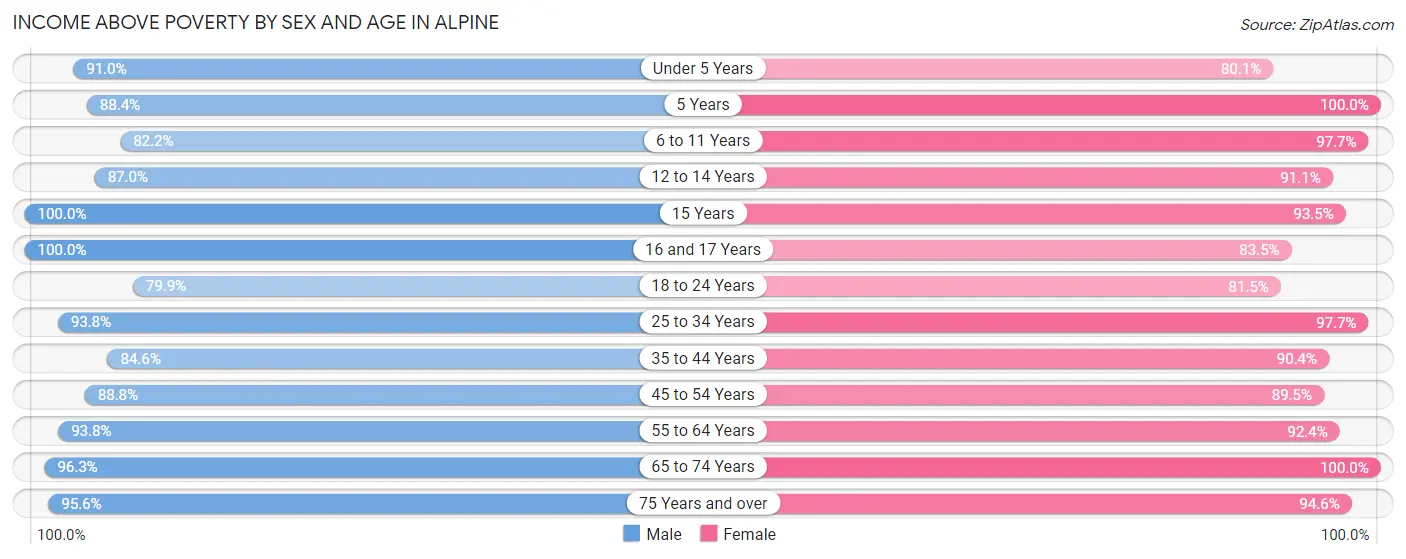
| Age Bracket | Male | Female |
| Under 5 Years | 453 (91.0%) | 249 (80.1%) |
| 5 Years | 107 (88.4%) | 66 (100.0%) |
| 6 to 11 Years | 338 (82.2%) | 729 (97.7%) |
| 12 to 14 Years | 274 (87.0%) | 367 (91.1%) |
| 15 Years | 129 (100.0%) | 115 (93.5%) |
| 16 and 17 Years | 107 (100.0%) | 232 (83.5%) |
| 18 to 24 Years | 572 (79.9%) | 426 (81.5%) |
| 25 to 34 Years | 837 (93.8%) | 952 (97.7%) |
| 35 to 44 Years | 824 (84.6%) | 829 (90.4%) |
| 45 to 54 Years | 1,103 (88.8%) | 1,112 (89.5%) |
| 55 to 64 Years | 871 (93.8%) | 1,006 (92.4%) |
| 65 to 74 Years | 730 (96.3%) | 794 (100.0%) |
| 75 Years and over | 432 (95.6%) | 721 (94.6%) |
| Total | 6,777 (89.8%) | 7,598 (92.3%) |
Income Below Poverty Among Married-Couple Families in Alpine
The poverty statistics for married-couple families in Alpine show that 3.9% or 129 of the total 3,324 families live below the poverty line. Families with 1 or 2 children have the highest poverty rate of 4.5%, comprising of 62 families. On the other hand, families with 3 or 4 children have the lowest poverty rate of 0.0%, which includes 0 families.
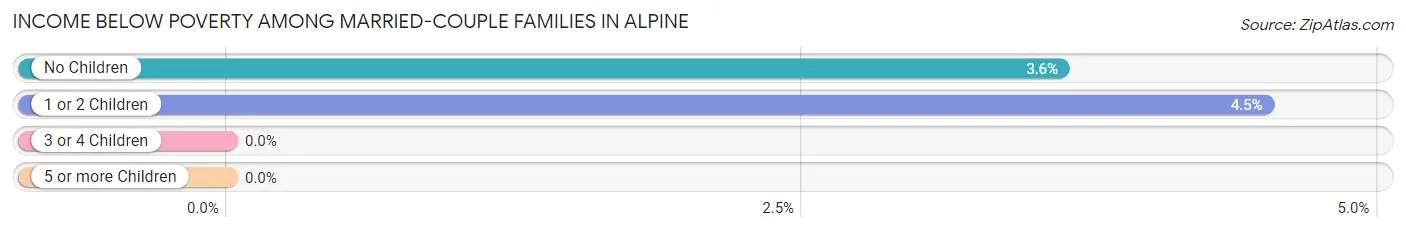
| Children | Above Poverty | Below Poverty |
| No Children | 1,782 (96.4%) | 67 (3.6%) |
| 1 or 2 Children | 1,312 (95.5%) | 62 (4.5%) |
| 3 or 4 Children | 91 (100.0%) | 0 (0.0%) |
| 5 or more Children | 10 (100.0%) | 0 (0.0%) |
| Total | 3,195 (96.1%) | 129 (3.9%) |
Income Below Poverty Among Single-Parent Households in Alpine
According to the poverty data in Alpine, 35.4% or 96 single-father households and 7.9% or 40 single-mother households are living below the poverty line. Among single-father households, those with 3 or 4 children have the highest poverty rate, with 42 households (66.7%) experiencing poverty. Likewise, among single-mother households, those with no children have the highest poverty rate, with 29 households (10.2%) falling below the poverty line.
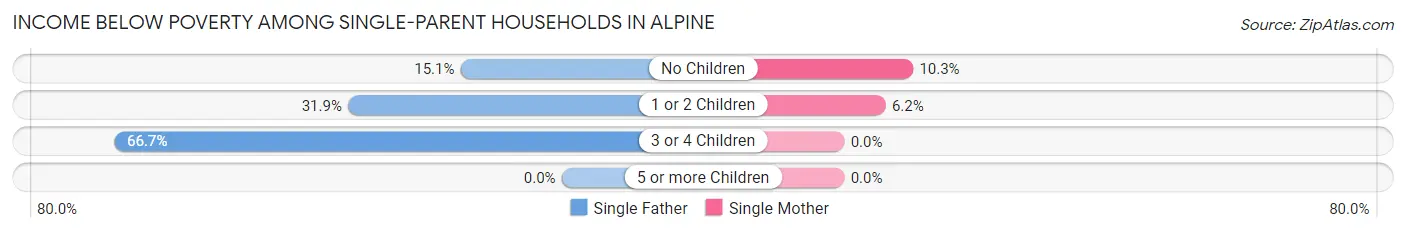
| Children | Single Father | Single Mother |
| No Children | 11 (15.1%) | 29 (10.2%) |
| 1 or 2 Children | 43 (31.9%) | 11 (6.1%) |
| 3 or 4 Children | 42 (66.7%) | 0 (0.0%) |
| 5 or more Children | 0 (0.0%) | 0 (0.0%) |
| Total | 96 (35.4%) | 40 (7.9%) |
Income Below Poverty Among Married-Couple vs Single-Parent Households in Alpine
The poverty data for Alpine shows that 129 of the married-couple family households (3.9%) and 136 of the single-parent households (17.4%) are living below the poverty level. Within the married-couple family households, those with 1 or 2 children have the highest poverty rate, with 62 households (4.5%) falling below the poverty line. Among the single-parent households, those with 3 or 4 children have the highest poverty rate, with 42 household (38.2%) living below poverty.
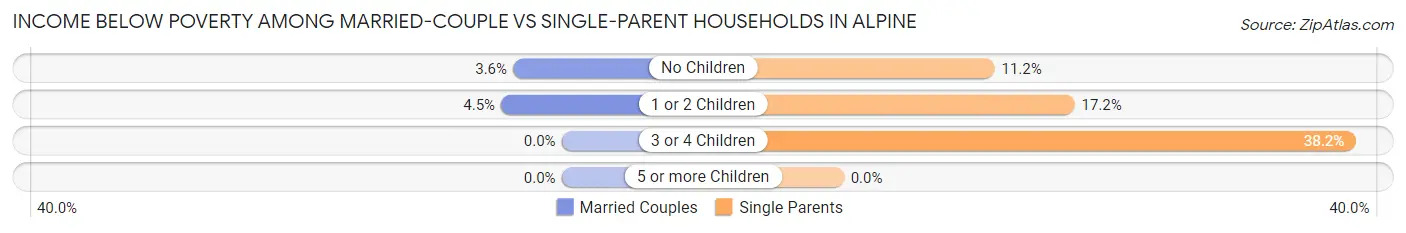
| Children | Married-Couple Families | Single-Parent Households |
| No Children | 67 (3.6%) | 40 (11.2%) |
| 1 or 2 Children | 62 (4.5%) | 54 (17.2%) |
| 3 or 4 Children | 0 (0.0%) | 42 (38.2%) |
| 5 or more Children | 0 (0.0%) | 0 (0.0%) |
| Total | 129 (3.9%) | 136 (17.4%) |
Race in Alpine
The most populous races in Alpine are White / Caucasian (12,650 | 79.5%), Hispanic or Latino (3,072 | 19.3%), and Two or more Races (1,650 | 10.4%).
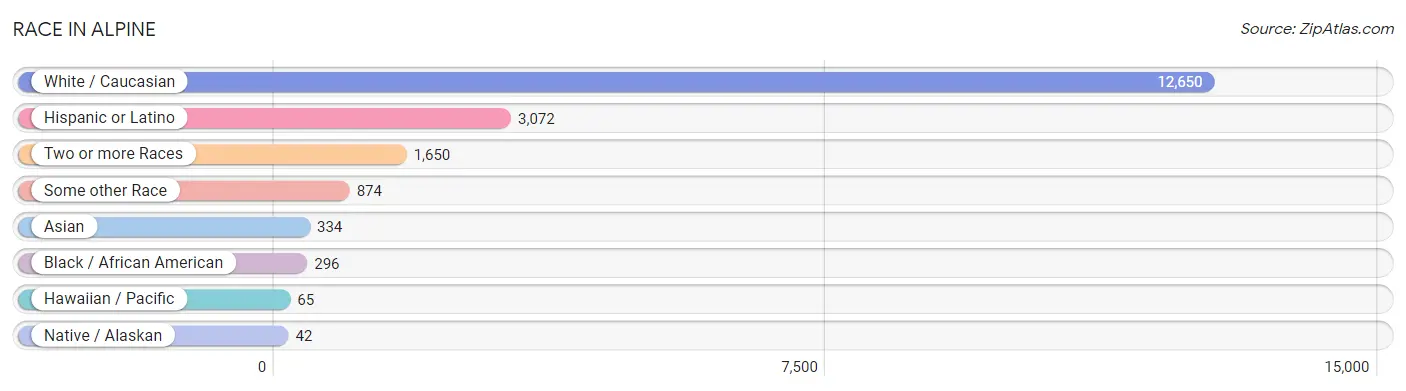
| Race | # Population | % Population |
| Asian | 334 | 2.1% |
| Black / African American | 296 | 1.9% |
| Hawaiian / Pacific | 65 | 0.4% |
| Hispanic or Latino | 3,072 | 19.3% |
| Native / Alaskan | 42 | 0.3% |
| White / Caucasian | 12,650 | 79.5% |
| Two or more Races | 1,650 | 10.4% |
| Some other Race | 874 | 5.5% |
| Total | 15,911 | 100.0% |
Ancestry in Alpine
The most populous ancestries reported in Alpine are Mexican (2,619 | 16.5%), German (2,611 | 16.4%), English (1,947 | 12.2%), Irish (1,704 | 10.7%), and Italian (1,457 | 9.2%), together accounting for 65.0% of all Alpine residents.
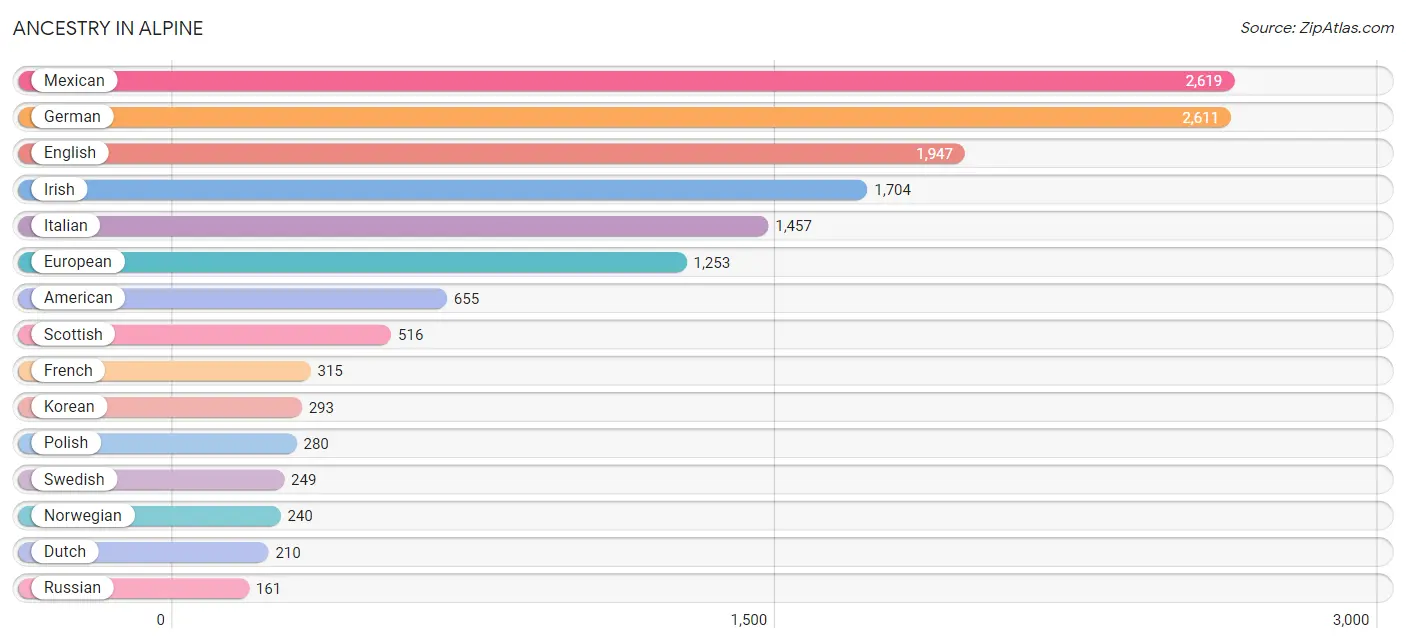
| Ancestry | # Population | % Population |
| African | 11 | 0.1% |
| American | 655 | 4.1% |
| Arab | 81 | 0.5% |
| Austrian | 19 | 0.1% |
| Barbadian | 24 | 0.2% |
| Basque | 15 | 0.1% |
| Belgian | 10 | 0.1% |
| Bhutanese | 67 | 0.4% |
| British | 123 | 0.8% |
| Burmese | 41 | 0.3% |
| Cajun | 10 | 0.1% |
| Canadian | 44 | 0.3% |
| Central American | 24 | 0.2% |
| Cherokee | 50 | 0.3% |
| Chickasaw | 49 | 0.3% |
| Colombian | 8 | 0.1% |
| Croatian | 37 | 0.2% |
| Cuban | 15 | 0.1% |
| Czech | 23 | 0.1% |
| Danish | 43 | 0.3% |
| Dutch | 210 | 1.3% |
| Eastern European | 82 | 0.5% |
| English | 1,947 | 12.2% |
| European | 1,253 | 7.9% |
| Finnish | 56 | 0.4% |
| French | 315 | 2.0% |
| French Canadian | 116 | 0.7% |
| German | 2,611 | 16.4% |
| Greek | 85 | 0.5% |
| Guamanian / Chamorro | 74 | 0.5% |
| Hungarian | 114 | 0.7% |
| Indian (Asian) | 97 | 0.6% |
| Iraqi | 53 | 0.3% |
| Irish | 1,704 | 10.7% |
| Israeli | 14 | 0.1% |
| Italian | 1,457 | 9.2% |
| Korean | 293 | 1.8% |
| Luxembourger | 11 | 0.1% |
| Mexican | 2,619 | 16.5% |
| Mexican American Indian | 7 | 0.0% |
| Native Hawaiian | 40 | 0.3% |
| Navajo | 97 | 0.6% |
| Northern European | 127 | 0.8% |
| Norwegian | 240 | 1.5% |
| Pakistani | 36 | 0.2% |
| Polish | 280 | 1.8% |
| Portuguese | 66 | 0.4% |
| Puerto Rican | 154 | 1.0% |
| Russian | 161 | 1.0% |
| Salvadoran | 24 | 0.2% |
| Samoan | 15 | 0.1% |
| Scandinavian | 127 | 0.8% |
| Scotch-Irish | 45 | 0.3% |
| Scottish | 516 | 3.2% |
| Slovak | 43 | 0.3% |
| Slovene | 14 | 0.1% |
| South American | 8 | 0.1% |
| Spaniard | 52 | 0.3% |
| Spanish | 102 | 0.6% |
| Sri Lankan | 36 | 0.2% |
| Subsaharan African | 11 | 0.1% |
| Swedish | 249 | 1.6% |
| Swiss | 70 | 0.4% |
| Trinidadian and Tobagonian | 42 | 0.3% |
| Ukrainian | 37 | 0.2% |
| Welsh | 147 | 0.9% | View All 66 Rows |
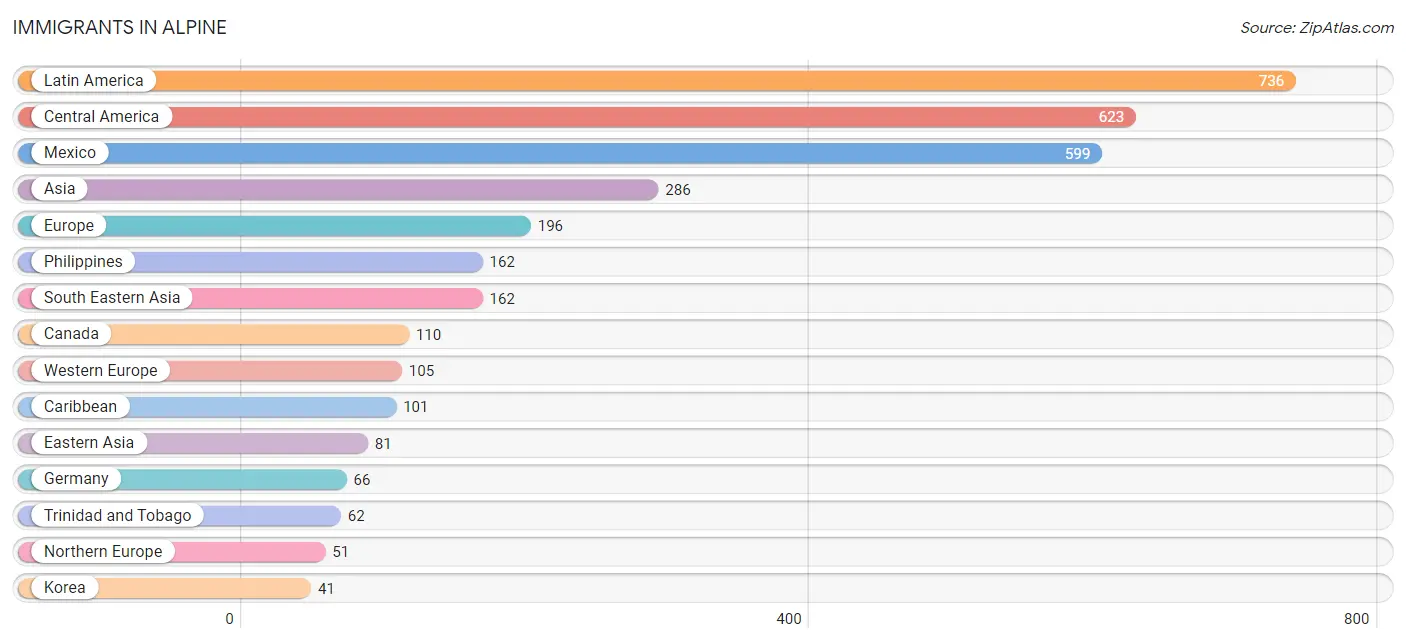
Immigrants in Alpine
The most numerous immigrant groups reported in Alpine came from Latin America (736 | 4.6%), Central America (623 | 3.9%), Mexico (599 | 3.8%), Asia (286 | 1.8%), and Europe (196 | 1.2%), together accounting for 15.3% of all Alpine residents.
| Immigration Origin | # Population | % Population |
| Asia | 286 | 1.8% |
| Austria | 14 | 0.1% |
| Azores | 12 | 0.1% |
| Barbados | 24 | 0.2% |
| Brazil | 12 | 0.1% |
| Canada | 110 | 0.7% |
| Caribbean | 101 | 0.6% |
| Central America | 623 | 3.9% |
| China | 40 | 0.3% |
| Cuba | 15 | 0.1% |
| Czechoslovakia | 23 | 0.1% |
| Eastern Asia | 81 | 0.5% |
| Eastern Europe | 23 | 0.1% |
| El Salvador | 24 | 0.2% |
| England | 11 | 0.1% |
| Europe | 196 | 1.2% |
| Germany | 66 | 0.4% |
| Iraq | 12 | 0.1% |
| Israel | 14 | 0.1% |
| Italy | 5 | 0.0% |
| Korea | 41 | 0.3% |
| Latin America | 736 | 4.6% |
| Mexico | 599 | 3.8% |
| Netherlands | 16 | 0.1% |
| Northern Europe | 51 | 0.3% |
| Pakistan | 17 | 0.1% |
| Philippines | 162 | 1.0% |
| Portugal | 12 | 0.1% |
| South America | 12 | 0.1% |
| South Central Asia | 17 | 0.1% |
| South Eastern Asia | 162 | 1.0% |
| Southern Europe | 17 | 0.1% |
| Sweden | 23 | 0.1% |
| Switzerland | 9 | 0.1% |
| Trinidad and Tobago | 62 | 0.4% |
| Western Asia | 26 | 0.2% |
| Western Europe | 105 | 0.7% | View All 37 Rows |
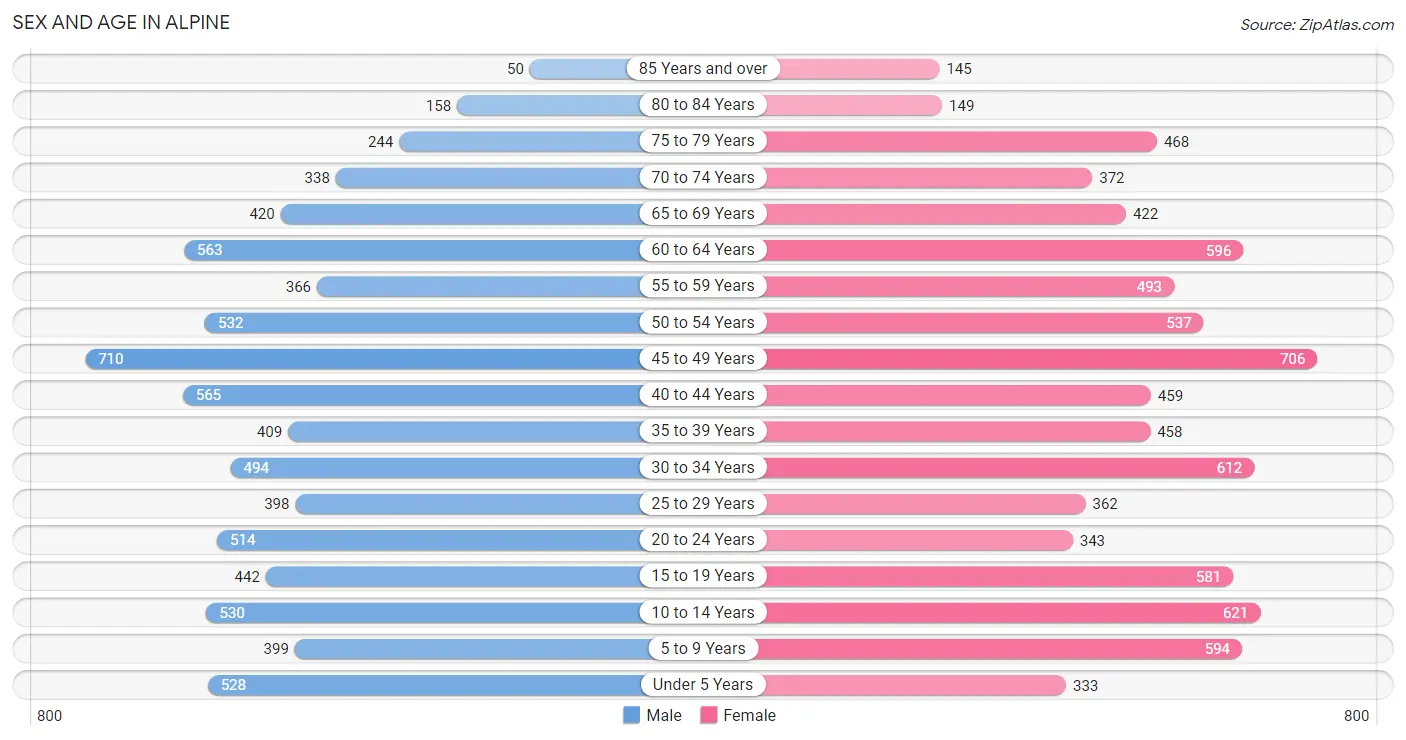
Sex and Age in Alpine
Sex and Age in Alpine
The most populous age groups in Alpine are 45 to 49 Years (710 | 9.3%) for men and 45 to 49 Years (706 | 8.6%) for women.
| Age Bracket | Male | Female |
| Under 5 Years | 528 (6.9%) | 333 (4.0%) |
| 5 to 9 Years | 399 (5.2%) | 594 (7.2%) |
| 10 to 14 Years | 530 (6.9%) | 621 (7.5%) |
| 15 to 19 Years | 442 (5.8%) | 581 (7.0%) |
| 20 to 24 Years | 514 (6.7%) | 343 (4.2%) |
| 25 to 29 Years | 398 (5.2%) | 362 (4.4%) |
| 30 to 34 Years | 494 (6.5%) | 612 (7.4%) |
| 35 to 39 Years | 409 (5.3%) | 458 (5.6%) |
| 40 to 44 Years | 565 (7.4%) | 459 (5.6%) |
| 45 to 49 Years | 710 (9.3%) | 706 (8.6%) |
| 50 to 54 Years | 532 (7.0%) | 537 (6.5%) |
| 55 to 59 Years | 366 (4.8%) | 493 (6.0%) |
| 60 to 64 Years | 563 (7.3%) | 596 (7.2%) |
| 65 to 69 Years | 420 (5.5%) | 422 (5.1%) |
| 70 to 74 Years | 338 (4.4%) | 372 (4.5%) |
| 75 to 79 Years | 244 (3.2%) | 468 (5.7%) |
| 80 to 84 Years | 158 (2.1%) | 149 (1.8%) |
| 85 Years and over | 50 (0.6%) | 145 (1.8%) |
| Total | 7,660 (100.0%) | 8,251 (100.0%) |
Families and Households in Alpine
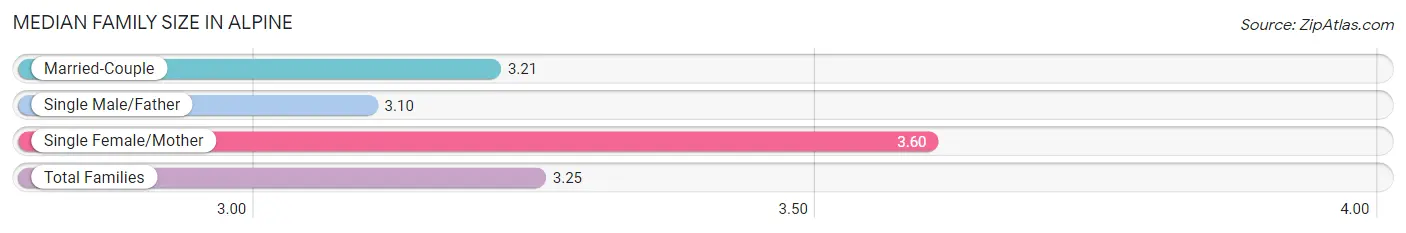
Median Family Size in Alpine
The median family size in Alpine is 3.25 persons per family, with single female/mother families (509 | 12.4%) accounting for the largest median family size of 3.6 persons per family. On the other hand, single male/father families (271 | 6.6%) represent the smallest median family size with 3.10 persons per family.
| Family Type | # Families | Family Size |
| Married-Couple | 3,324 (81.0%) | 3.21 |
| Single Male/Father | 271 (6.6%) | 3.10 |
| Single Female/Mother | 509 (12.4%) | 3.60 |
| Total Families | 4,104 (100.0%) | 3.25 |
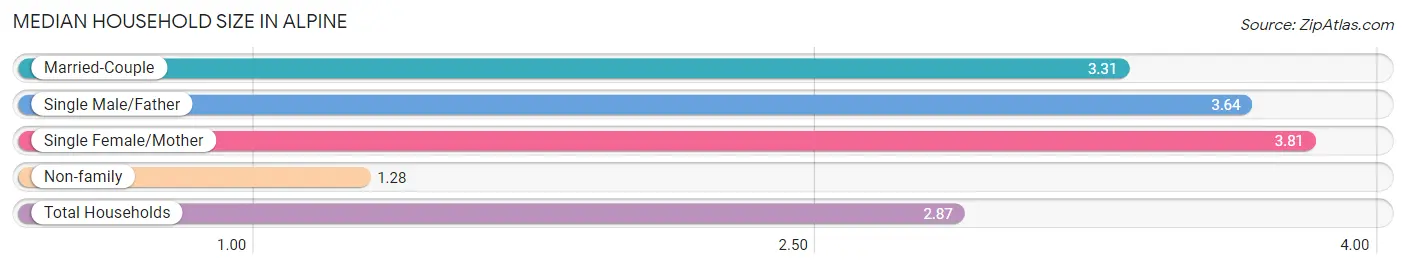
Median Household Size in Alpine
The median household size in Alpine is 2.87 persons per household, with single female/mother households (509 | 9.3%) accounting for the largest median household size of 3.81 persons per household. non-family households (1,360 | 24.9%) represent the smallest median household size with 1.28 persons per household.
| Household Type | # Households | Household Size |
| Married-Couple | 3,324 (60.8%) | 3.31 |
| Single Male/Father | 271 (5.0%) | 3.64 |
| Single Female/Mother | 509 (9.3%) | 3.81 |
| Non-family | 1,360 (24.9%) | 1.28 |
| Total Households | 5,464 (100.0%) | 2.87 |
Household Size by Marriage Status in Alpine
Out of a total of 5,464 households in Alpine, 4,104 (75.1%) are family households, while 1,360 (24.9%) are nonfamily households. The most numerous type of family households are 2-person households, comprising 1,654, and the most common type of nonfamily households are 1-person households, comprising 1,057.
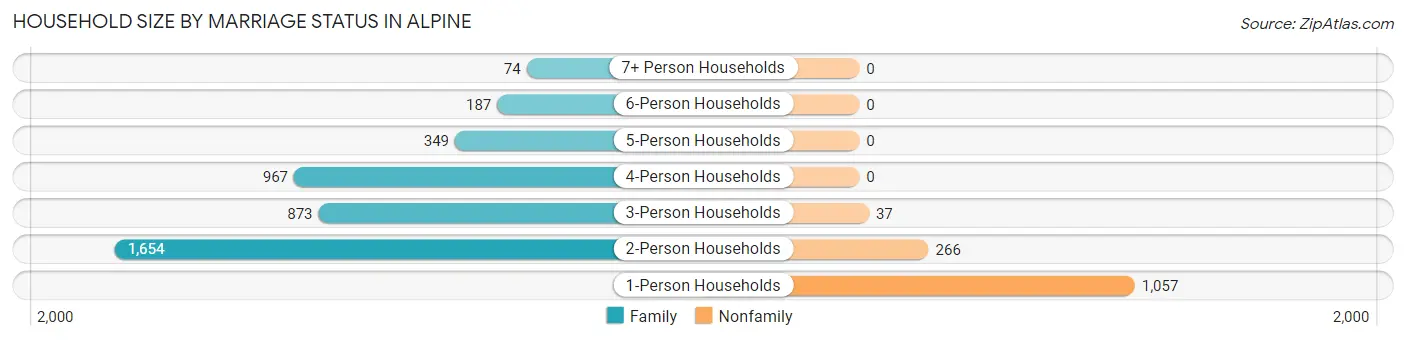
| Household Size | Family Households | Nonfamily Households |
| 1-Person Households | - | 1,057 (19.3%) |
| 2-Person Households | 1,654 (30.3%) | 266 (4.9%) |
| 3-Person Households | 873 (16.0%) | 37 (0.7%) |
| 4-Person Households | 967 (17.7%) | 0 (0.0%) |
| 5-Person Households | 349 (6.4%) | 0 (0.0%) |
| 6-Person Households | 187 (3.4%) | 0 (0.0%) |
| 7+ Person Households | 74 (1.3%) | 0 (0.0%) |
| Total | 4,104 (75.1%) | 1,360 (24.9%) |
Female Fertility in Alpine
Fertility by Age in Alpine
Average fertility rate in Alpine is 63.0 births per 1,000 women. Women in the age bracket of 20 to 34 years have the highest fertility rate with 153.0 births per 1,000 women. Women in the age bracket of 20 to 34 years acount for 85.5% of all women with births.
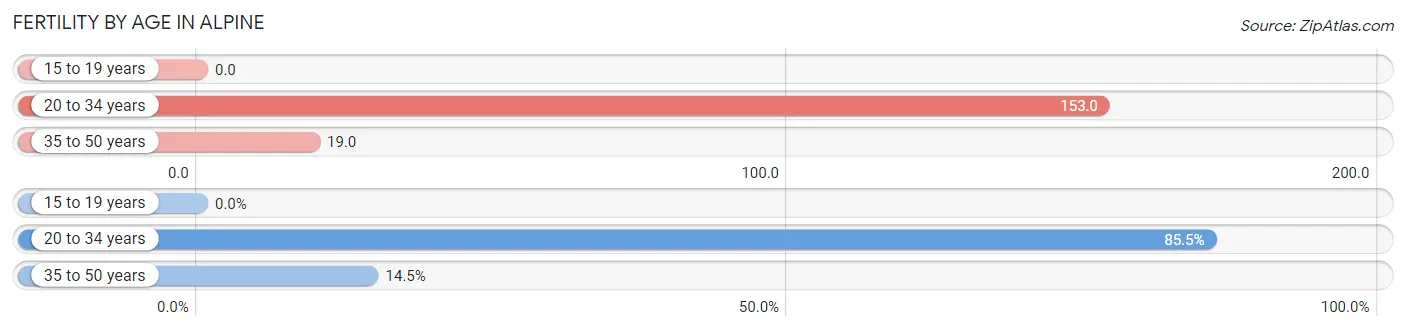
| Age Bracket | Women with Births | Births / 1,000 Women |
| 15 to 19 years | 0 (0.0%) | 0.0 |
| 20 to 34 years | 201 (85.5%) | 153.0 |
| 35 to 50 years | 34 (14.5%) | 19.0 |
| Total | 235 (100.0%) | 63.0 |
Fertility by Age by Marriage Status in Alpine
77.0% of women with births (235) in Alpine are married. The highest percentage of unmarried women with births falls into 35 to 50 years age bracket with 100.0% of them unmarried at the time of birth, while the lowest percentage of unmarried women with births belong to 20 to 34 years age bracket with 10.0% of them unmarried.
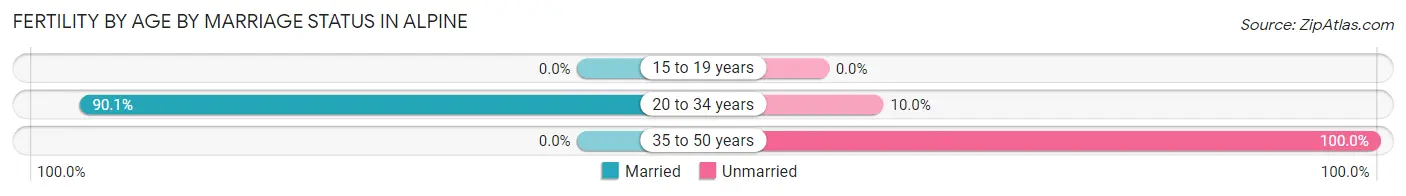
| Age Bracket | Married | Unmarried |
| 15 to 19 years | 0 (0.0%) | 0 (0.0%) |
| 20 to 34 years | 181 (90.0%) | 20 (10.0%) |
| 35 to 50 years | 0 (0.0%) | 34 (100.0%) |
| Total | 181 (77.0%) | 54 (23.0%) |
Fertility by Education in Alpine
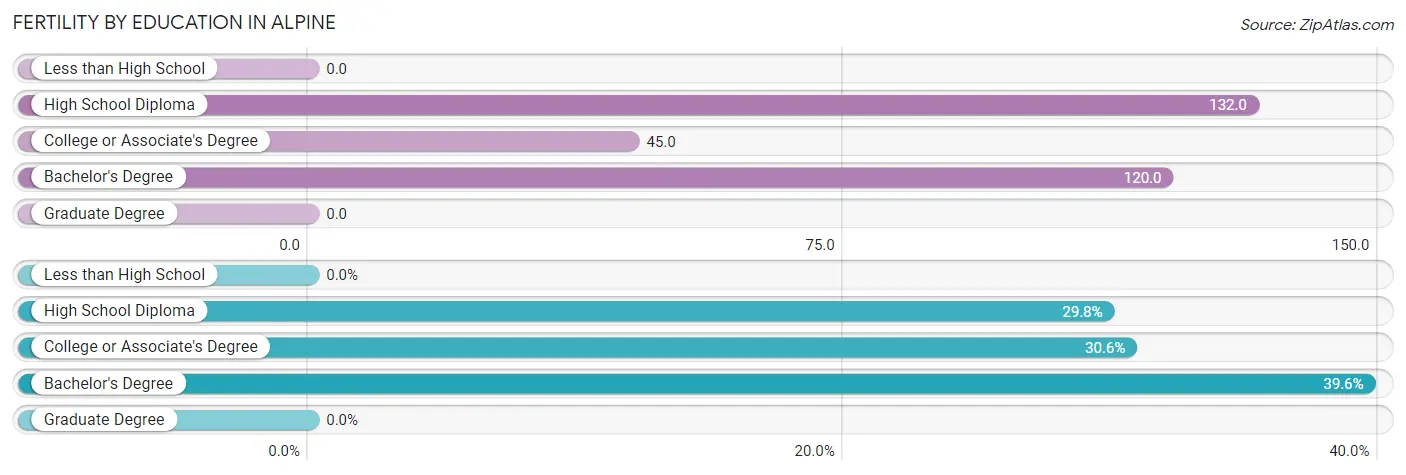
| Educational Attainment | Women with Births | Births / 1,000 Women |
| Less than High School | 0 (0.0%) | 0.0 |
| High School Diploma | 70 (29.8%) | 132.0 |
| College or Associate's Degree | 72 (30.6%) | 45.0 |
| Bachelor's Degree | 93 (39.6%) | 120.0 |
| Graduate Degree | 0 (0.0%) | 0.0 |
| Total | 235 (100.0%) | 63.0 |
Fertility by Education by Marriage Status in Alpine
23.0% of women with births in Alpine are unmarried. Women with the educational attainment of bachelor's degree are most likely to be married with 100.0% of them married at childbirth, while women with the educational attainment of college or associate's degree are least likely to be married with 47.2% of them unmarried at childbirth.
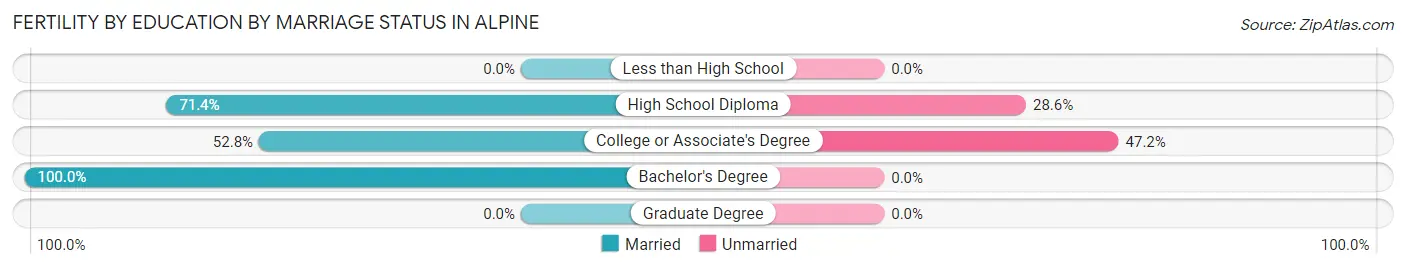
| Educational Attainment | Married | Unmarried |
| Less than High School | 0 (0.0%) | 0 (0.0%) |
| High School Diploma | 50 (71.4%) | 20 (28.6%) |
| College or Associate's Degree | 38 (52.8%) | 34 (47.2%) |
| Bachelor's Degree | 93 (100.0%) | 0 (0.0%) |
| Graduate Degree | 0 (0.0%) | 0 (0.0%) |
| Total | 181 (77.0%) | 54 (23.0%) |
Employment Characteristics in Alpine
Employment by Class of Employer in Alpine
Among the 7,144 employed individuals in Alpine, private company employees (4,359 | 61.0%), local government employees (724 | 10.1%), and self-employed (not incorporated) (711 | 10.0%) make up the most common classes of employment.
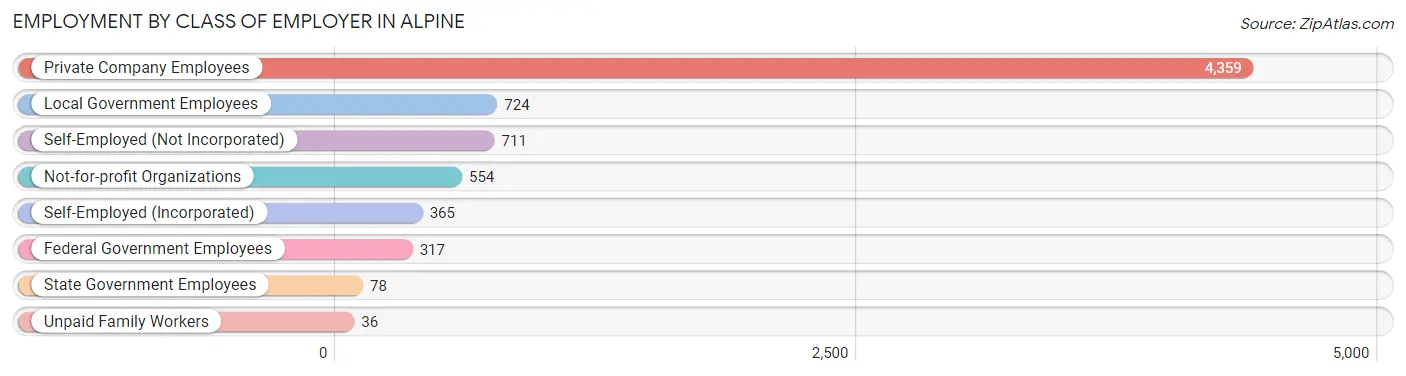
| Employer Class | # Employees | % Employees |
| Private Company Employees | 4,359 | 61.0% |
| Self-Employed (Incorporated) | 365 | 5.1% |
| Self-Employed (Not Incorporated) | 711 | 10.0% |
| Not-for-profit Organizations | 554 | 7.7% |
| Local Government Employees | 724 | 10.1% |
| State Government Employees | 78 | 1.1% |
| Federal Government Employees | 317 | 4.4% |
| Unpaid Family Workers | 36 | 0.5% |
| Total | 7,144 | 100.0% |
Employment Status by Age in Alpine
According to the labor force statistics for Alpine, out of the total population over 16 years of age (12,652), 60.8% or 7,692 individuals are in the labor force, with 5.9% or 454 of them unemployed. The age group with the highest labor force participation rate is 25 to 29 years, with 95.5% or 726 individuals in the labor force. Within the labor force, the 16 to 19 years age range has the highest percentage of unemployed individuals, with 27.6% or 81 of them being unemployed.
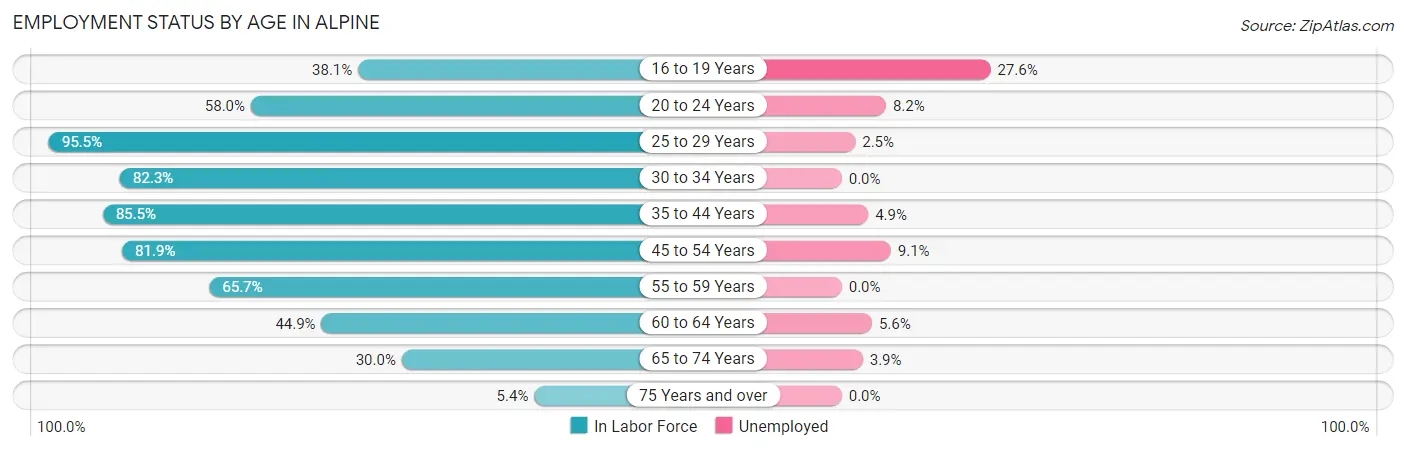
| Age Bracket | In Labor Force | Unemployed |
| 16 to 19 Years | 293 (38.1%) | 81 (27.6%) |
| 20 to 24 Years | 497 (58.0%) | 41 (8.2%) |
| 25 to 29 Years | 726 (95.5%) | 18 (2.5%) |
| 30 to 34 Years | 910 (82.3%) | 0 (0.0%) |
| 35 to 44 Years | 1,617 (85.5%) | 79 (4.9%) |
| 45 to 54 Years | 2,035 (81.9%) | 185 (9.1%) |
| 55 to 59 Years | 564 (65.7%) | 0 (0.0%) |
| 60 to 64 Years | 520 (44.9%) | 29 (5.6%) |
| 65 to 74 Years | 466 (30.0%) | 18 (3.9%) |
| 75 Years and over | 66 (5.4%) | 0 (0.0%) |
| Total | 7,692 (60.8%) | 454 (5.9%) |
Employment Status by Educational Attainment in Alpine
According to labor force statistics for Alpine, 77.1% of individuals (6,368) out of the total population between 25 and 64 years of age (8,260) are in the labor force, with 4.9% or 312 of them being unemployed. The group with the highest labor force participation rate are those with the educational attainment of bachelor's degree or higher, with 81.4% or 2,176 individuals in the labor force. Within the labor force, individuals with less than high school education have the highest percentage of unemployment, with 28.9% or 55 of them being unemployed.
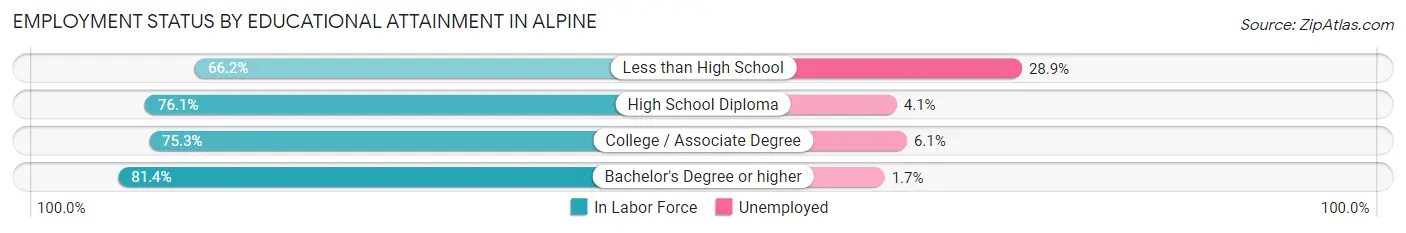
| Educational Attainment | In Labor Force | Unemployed |
| Less than High School | 190 (66.2%) | 83 (28.9%) |
| High School Diploma | 1,281 (76.1%) | 69 (4.1%) |
| College / Associate Degree | 2,724 (75.3%) | 221 (6.1%) |
| Bachelor's Degree or higher | 2,176 (81.4%) | 45 (1.7%) |
| Total | 6,368 (77.1%) | 405 (4.9%) |
Employment Occupations by Sex in Alpine
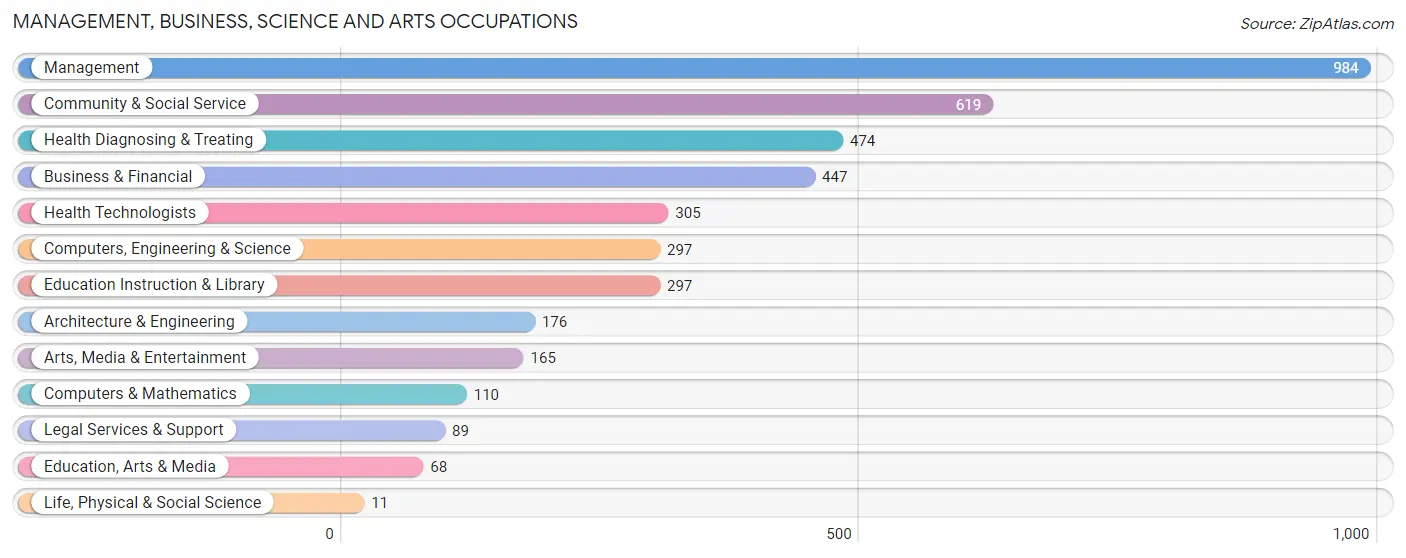
Management, Business, Science and Arts Occupations
The most common Management, Business, Science and Arts occupations in Alpine are Management (984 | 13.6%), Community & Social Service (619 | 8.6%), Health Diagnosing & Treating (474 | 6.6%), Business & Financial (447 | 6.2%), and Health Technologists (305 | 4.2%).
Management, Business, Science and Arts Occupations by Sex
Within the Management, Business, Science and Arts occupations in Alpine, the most male-oriented occupations are Life, Physical & Social Science (100.0%), Architecture & Engineering (84.1%), and Computers, Engineering & Science (78.8%), while the most female-oriented occupations are Health Diagnosing & Treating (89.2%), Health Technologists (83.3%), and Education Instruction & Library (78.8%).
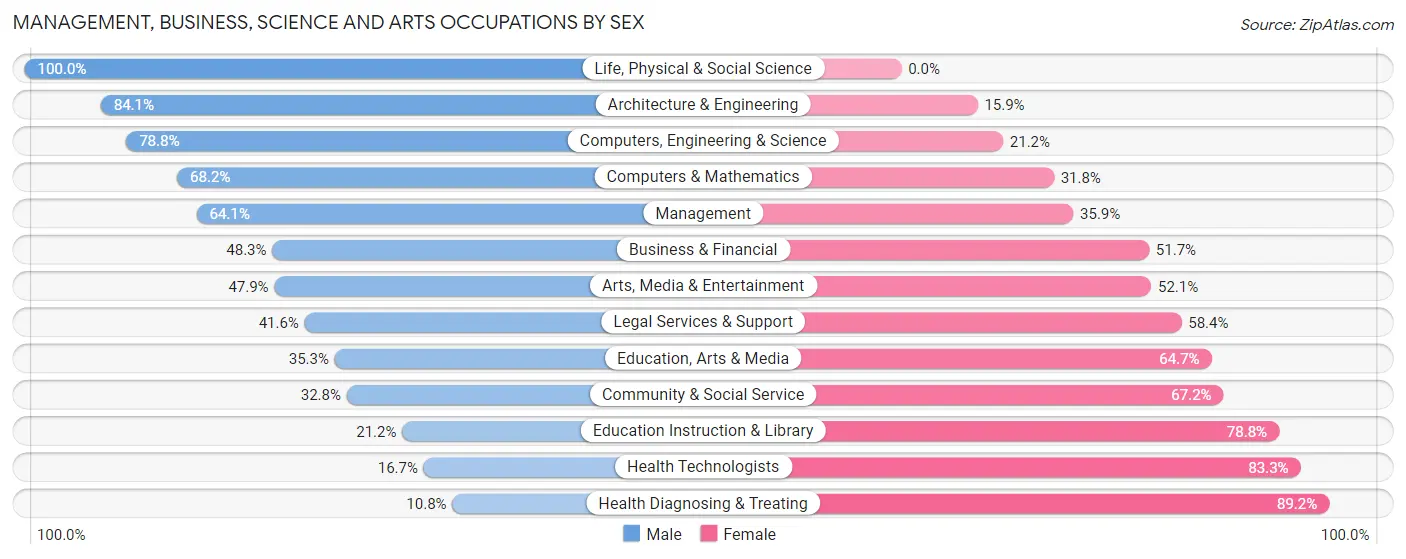
| Occupation | Male | Female |
| Management | 631 (64.1%) | 353 (35.9%) |
| Business & Financial | 216 (48.3%) | 231 (51.7%) |
| Computers, Engineering & Science | 234 (78.8%) | 63 (21.2%) |
| Computers & Mathematics | 75 (68.2%) | 35 (31.8%) |
| Architecture & Engineering | 148 (84.1%) | 28 (15.9%) |
| Life, Physical & Social Science | 11 (100.0%) | 0 (0.0%) |
| Community & Social Service | 203 (32.8%) | 416 (67.2%) |
| Education, Arts & Media | 24 (35.3%) | 44 (64.7%) |
| Legal Services & Support | 37 (41.6%) | 52 (58.4%) |
| Education Instruction & Library | 63 (21.2%) | 234 (78.8%) |
| Arts, Media & Entertainment | 79 (47.9%) | 86 (52.1%) |
| Health Diagnosing & Treating | 51 (10.8%) | 423 (89.2%) |
| Health Technologists | 51 (16.7%) | 254 (83.3%) |
| Total (Category) | 1,335 (47.3%) | 1,486 (52.7%) |
| Total (Overall) | 3,794 (52.5%) | 3,426 (47.4%) |
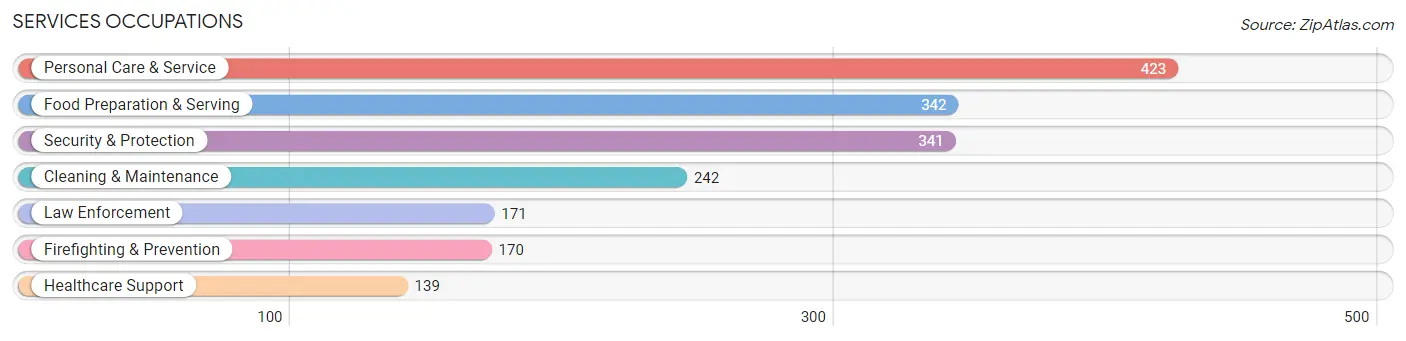
Services Occupations
The most common Services occupations in Alpine are Personal Care & Service (423 | 5.9%), Food Preparation & Serving (342 | 4.7%), Security & Protection (341 | 4.7%), Cleaning & Maintenance (242 | 3.4%), and Law Enforcement (171 | 2.4%).
Services Occupations by Sex
Within the Services occupations in Alpine, the most male-oriented occupations are Firefighting & Prevention (100.0%), Security & Protection (95.6%), and Law Enforcement (91.2%), while the most female-oriented occupations are Personal Care & Service (92.2%), Healthcare Support (78.4%), and Food Preparation & Serving (52.3%).
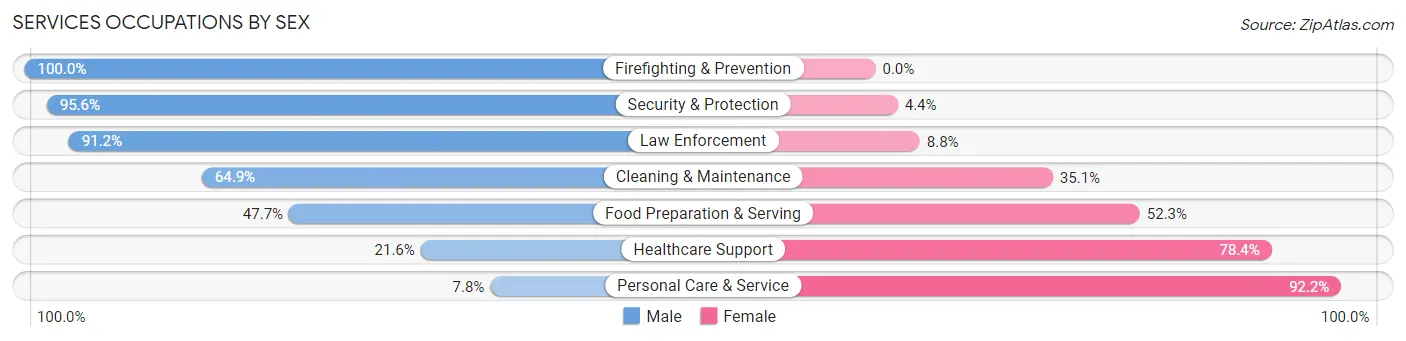
| Occupation | Male | Female |
| Healthcare Support | 30 (21.6%) | 109 (78.4%) |
| Security & Protection | 326 (95.6%) | 15 (4.4%) |
| Firefighting & Prevention | 170 (100.0%) | 0 (0.0%) |
| Law Enforcement | 156 (91.2%) | 15 (8.8%) |
| Food Preparation & Serving | 163 (47.7%) | 179 (52.3%) |
| Cleaning & Maintenance | 157 (64.9%) | 85 (35.1%) |
| Personal Care & Service | 33 (7.8%) | 390 (92.2%) |
| Total (Category) | 709 (47.7%) | 778 (52.3%) |
| Total (Overall) | 3,794 (52.5%) | 3,426 (47.4%) |
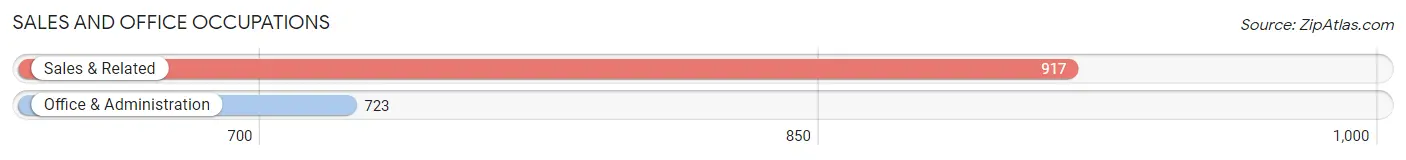
Sales and Office Occupations
The most common Sales and Office occupations in Alpine are Sales & Related (917 | 12.7%), and Office & Administration (723 | 10.0%).
Sales and Office Occupations by Sex
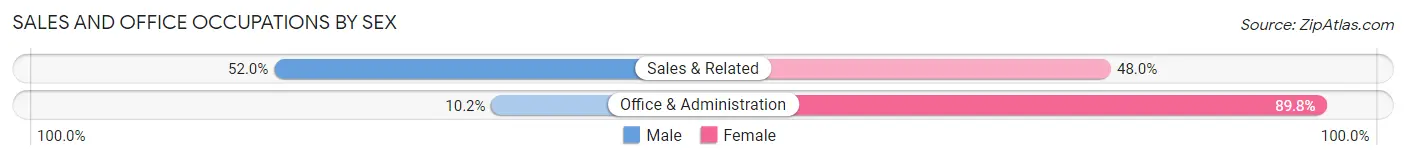
| Occupation | Male | Female |
| Sales & Related | 477 (52.0%) | 440 (48.0%) |
| Office & Administration | 74 (10.2%) | 649 (89.8%) |
| Total (Category) | 551 (33.6%) | 1,089 (66.4%) |
| Total (Overall) | 3,794 (52.5%) | 3,426 (47.4%) |
Natural Resources, Construction and Maintenance Occupations
The most common Natural Resources, Construction and Maintenance occupations in Alpine are Construction & Extraction (301 | 4.2%), and Installation, Maintenance & Repair (153 | 2.1%).
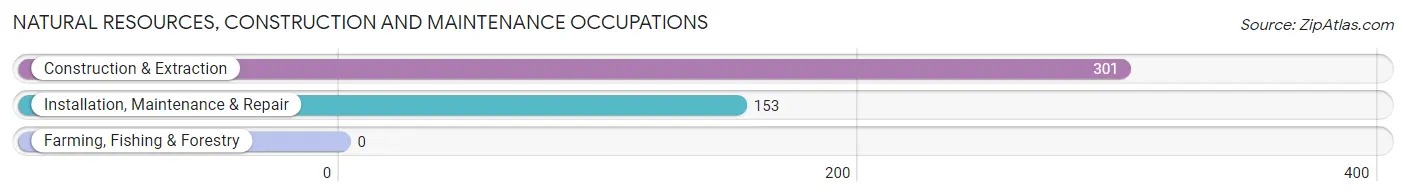
Natural Resources, Construction and Maintenance Occupations by Sex
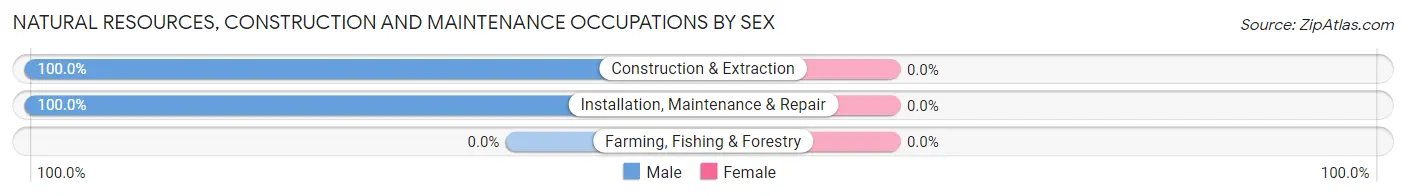
| Occupation | Male | Female |
| Farming, Fishing & Forestry | 0 (0.0%) | 0 (0.0%) |
| Construction & Extraction | 301 (100.0%) | 0 (0.0%) |
| Installation, Maintenance & Repair | 153 (100.0%) | 0 (0.0%) |
| Total (Category) | 454 (100.0%) | 0 (0.0%) |
| Total (Overall) | 3,794 (52.5%) | 3,426 (47.4%) |
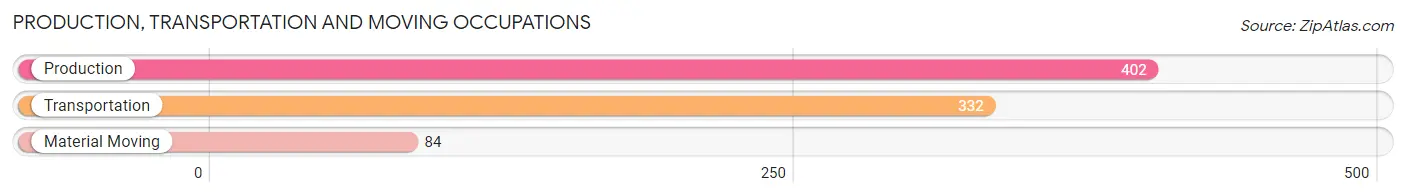
Production, Transportation and Moving Occupations
The most common Production, Transportation and Moving occupations in Alpine are Production (402 | 5.6%), Transportation (332 | 4.6%), and Material Moving (84 | 1.2%).
Production, Transportation and Moving Occupations by Sex
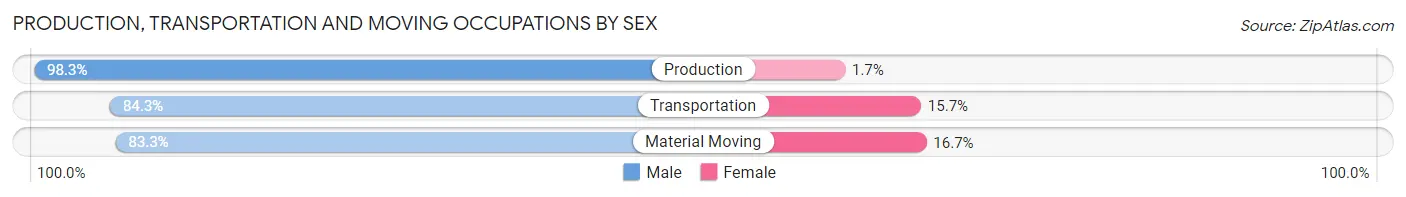
| Occupation | Male | Female |
| Production | 395 (98.3%) | 7 (1.7%) |
| Transportation | 280 (84.3%) | 52 (15.7%) |
| Material Moving | 70 (83.3%) | 14 (16.7%) |
| Total (Category) | 745 (91.1%) | 73 (8.9%) |
| Total (Overall) | 3,794 (52.5%) | 3,426 (47.4%) |
Employment Industries by Sex in Alpine
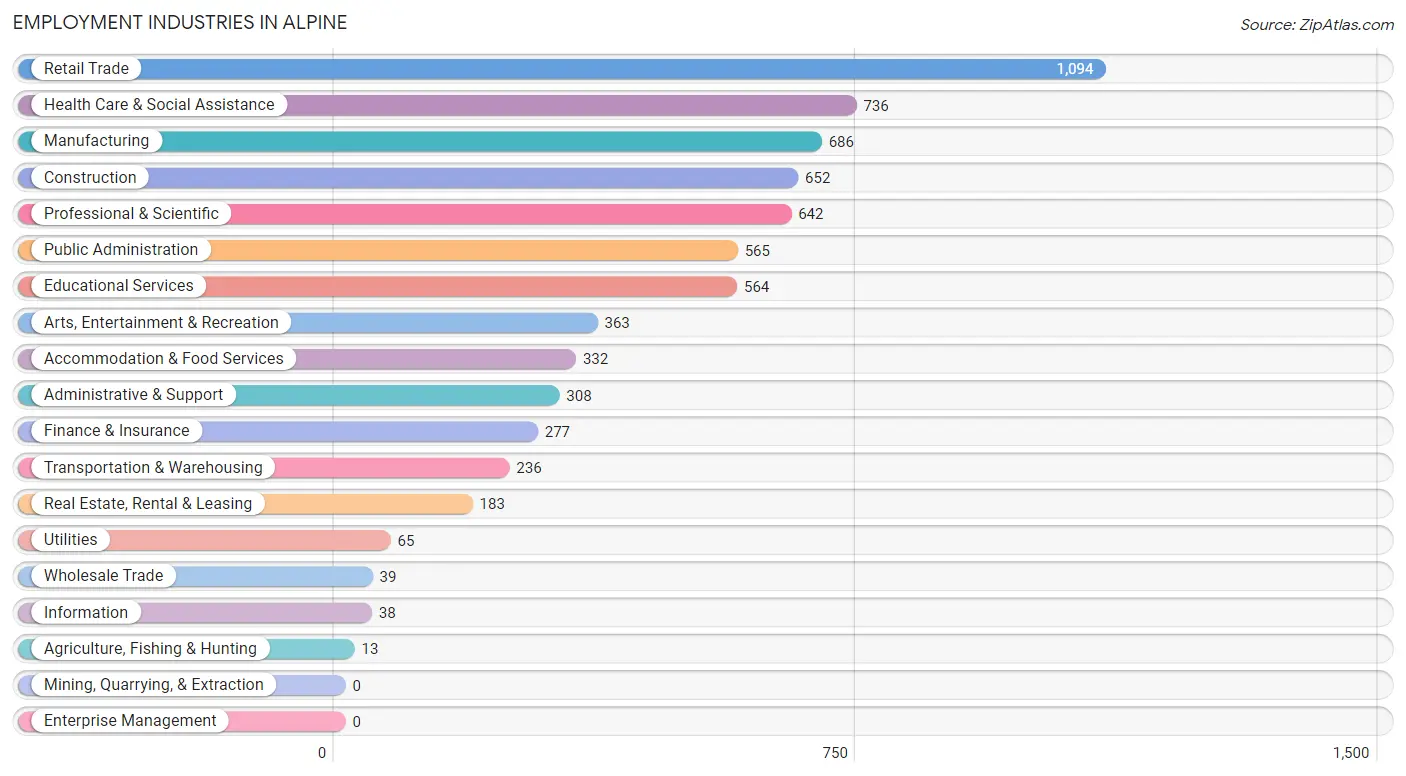
Employment Industries in Alpine
The major employment industries in Alpine include Retail Trade (1,094 | 15.1%), Health Care & Social Assistance (736 | 10.2%), Manufacturing (686 | 9.5%), Construction (652 | 9.0%), and Professional & Scientific (642 | 8.9%).
Employment Industries by Sex in Alpine
The Alpine industries that see more men than women are Agriculture, Fishing & Hunting (100.0%), Transportation & Warehousing (88.1%), and Construction (86.4%), whereas the industries that tend to have a higher number of women are Health Care & Social Assistance (90.1%), Information (73.7%), and Educational Services (66.7%).
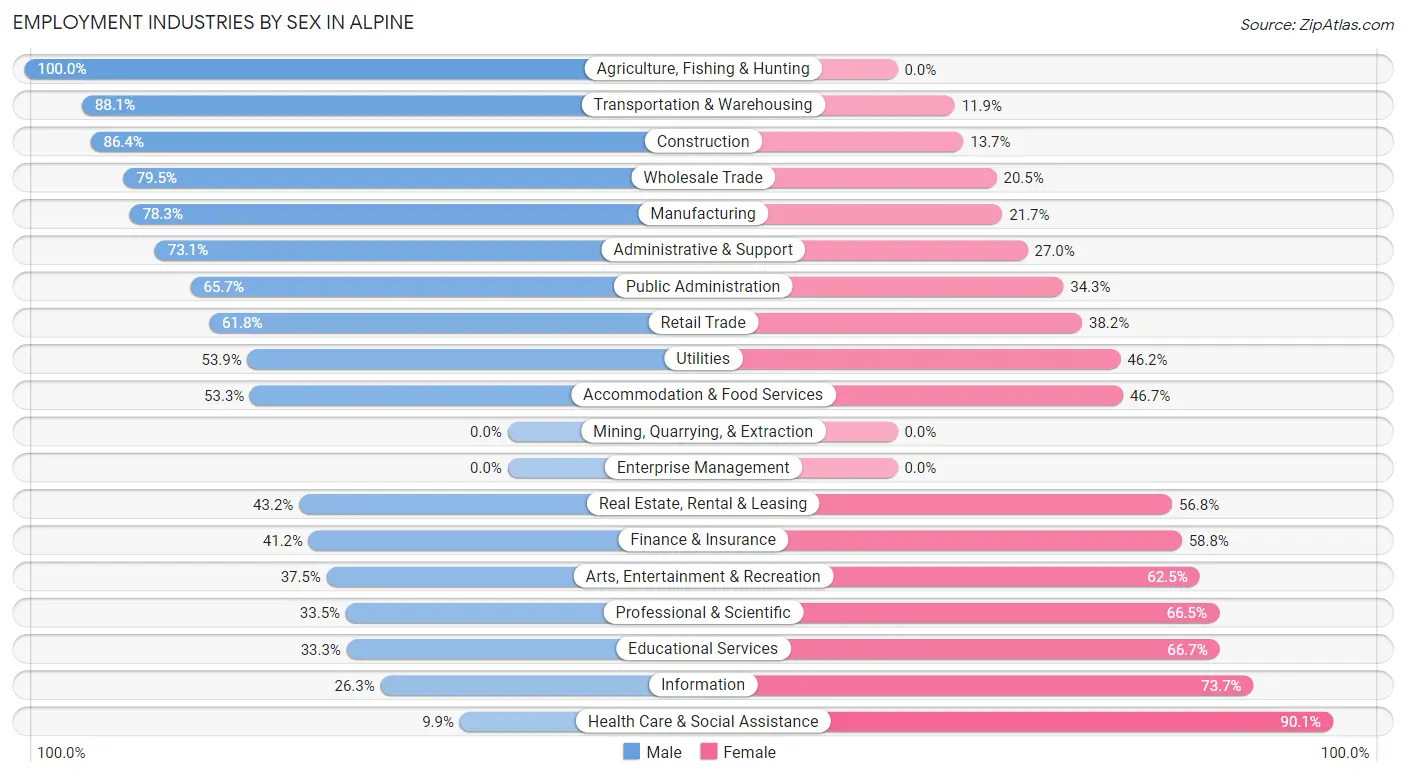
| Industry | Male | Female |
| Agriculture, Fishing & Hunting | 13 (100.0%) | 0 (0.0%) |
| Mining, Quarrying, & Extraction | 0 (0.0%) | 0 (0.0%) |
| Construction | 563 (86.4%) | 89 (13.7%) |
| Manufacturing | 537 (78.3%) | 149 (21.7%) |
| Wholesale Trade | 31 (79.5%) | 8 (20.5%) |
| Retail Trade | 676 (61.8%) | 418 (38.2%) |
| Transportation & Warehousing | 208 (88.1%) | 28 (11.9%) |
| Utilities | 35 (53.8%) | 30 (46.2%) |
| Information | 10 (26.3%) | 28 (73.7%) |
| Finance & Insurance | 114 (41.2%) | 163 (58.8%) |
| Real Estate, Rental & Leasing | 79 (43.2%) | 104 (56.8%) |
| Professional & Scientific | 215 (33.5%) | 427 (66.5%) |
| Enterprise Management | 0 (0.0%) | 0 (0.0%) |
| Administrative & Support | 225 (73.1%) | 83 (27.0%) |
| Educational Services | 188 (33.3%) | 376 (66.7%) |
| Health Care & Social Assistance | 73 (9.9%) | 663 (90.1%) |
| Arts, Entertainment & Recreation | 136 (37.5%) | 227 (62.5%) |
| Accommodation & Food Services | 177 (53.3%) | 155 (46.7%) |
| Public Administration | 371 (65.7%) | 194 (34.3%) |
| Total | 3,794 (52.5%) | 3,426 (47.4%) |
Education in Alpine
School Enrollment in Alpine
The most common levels of schooling among the 3,527 students in Alpine are middle school (876 | 24.8%), high school (860 | 24.4%), and elementary school (803 | 22.8%).
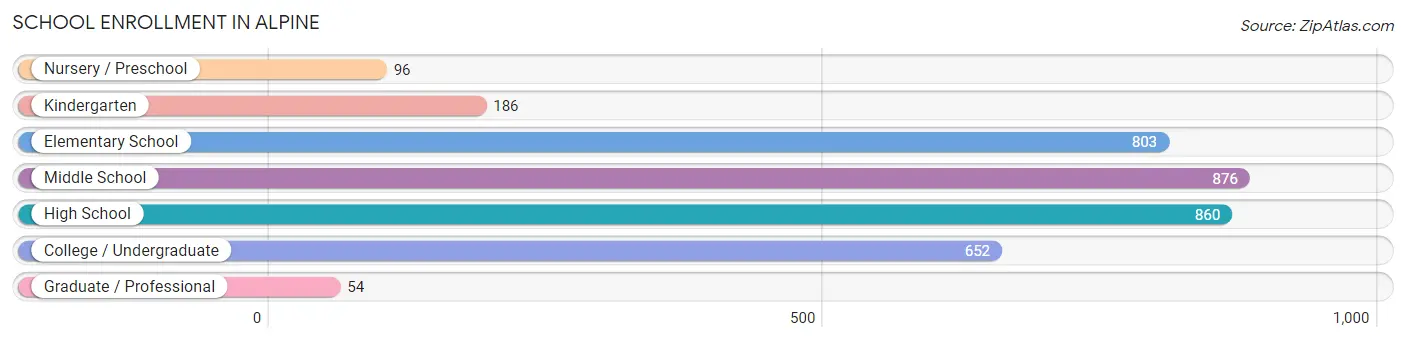
| School Level | # Students | % Students |
| Nursery / Preschool | 96 | 2.7% |
| Kindergarten | 186 | 5.3% |
| Elementary School | 803 | 22.8% |
| Middle School | 876 | 24.8% |
| High School | 860 | 24.4% |
| College / Undergraduate | 652 | 18.5% |
| Graduate / Professional | 54 | 1.5% |
| Total | 3,527 | 100.0% |
School Enrollment by Age by Funding Source in Alpine
Out of a total of 3,527 students who are enrolled in schools in Alpine, 681 (19.3%) attend a private institution, while the remaining 2,846 (80.7%) are enrolled in public schools. The age group of 15 to 17 year olds has the highest likelihood of being enrolled in private schools, with 218 (35.7% in the age bracket) enrolled. Conversely, the age group of 18 to 19 year olds has the lowest likelihood of being enrolled in a private school, with 313 (100.0% in the age bracket) attending a public institution.
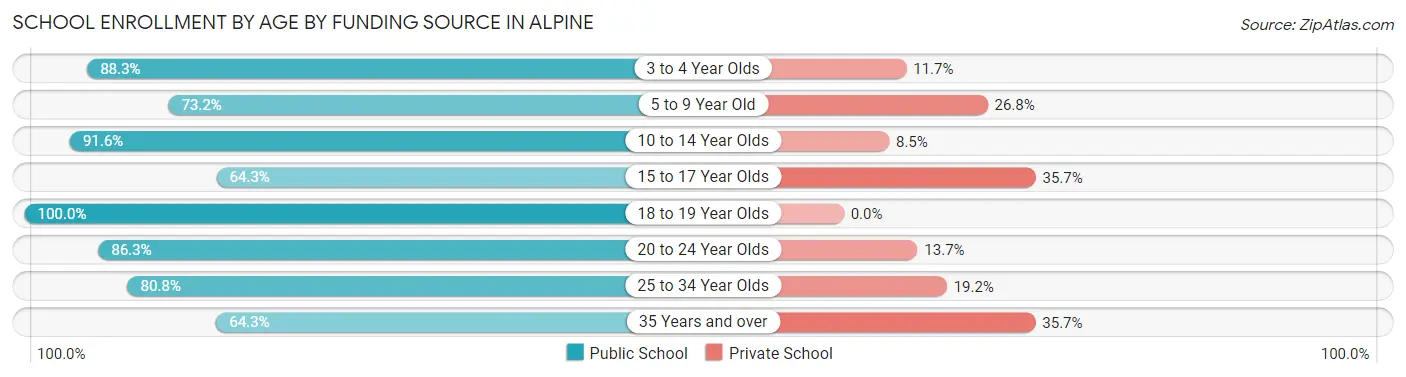
| Age Bracket | Public School | Private School |
| 3 to 4 Year Olds | 53 (88.3%) | 7 (11.7%) |
| 5 to 9 Year Old | 713 (73.2%) | 261 (26.8%) |
| 10 to 14 Year Olds | 1,019 (91.5%) | 94 (8.5%) |
| 15 to 17 Year Olds | 392 (64.3%) | 218 (35.7%) |
| 18 to 19 Year Olds | 313 (100.0%) | 0 (0.0%) |
| 20 to 24 Year Olds | 176 (86.3%) | 28 (13.7%) |
| 25 to 34 Year Olds | 80 (80.8%) | 19 (19.2%) |
| 35 Years and over | 99 (64.3%) | 55 (35.7%) |
| Total | 2,846 (80.7%) | 681 (19.3%) |
Educational Attainment by Field of Study in Alpine
Business (623 | 16.5%), arts & humanities (511 | 13.5%), liberal arts & history (373 | 9.9%), social sciences (309 | 8.2%), and computers & mathematics (298 | 7.9%) are the most common fields of study among 3,783 individuals in Alpine who have obtained a bachelor's degree or higher.
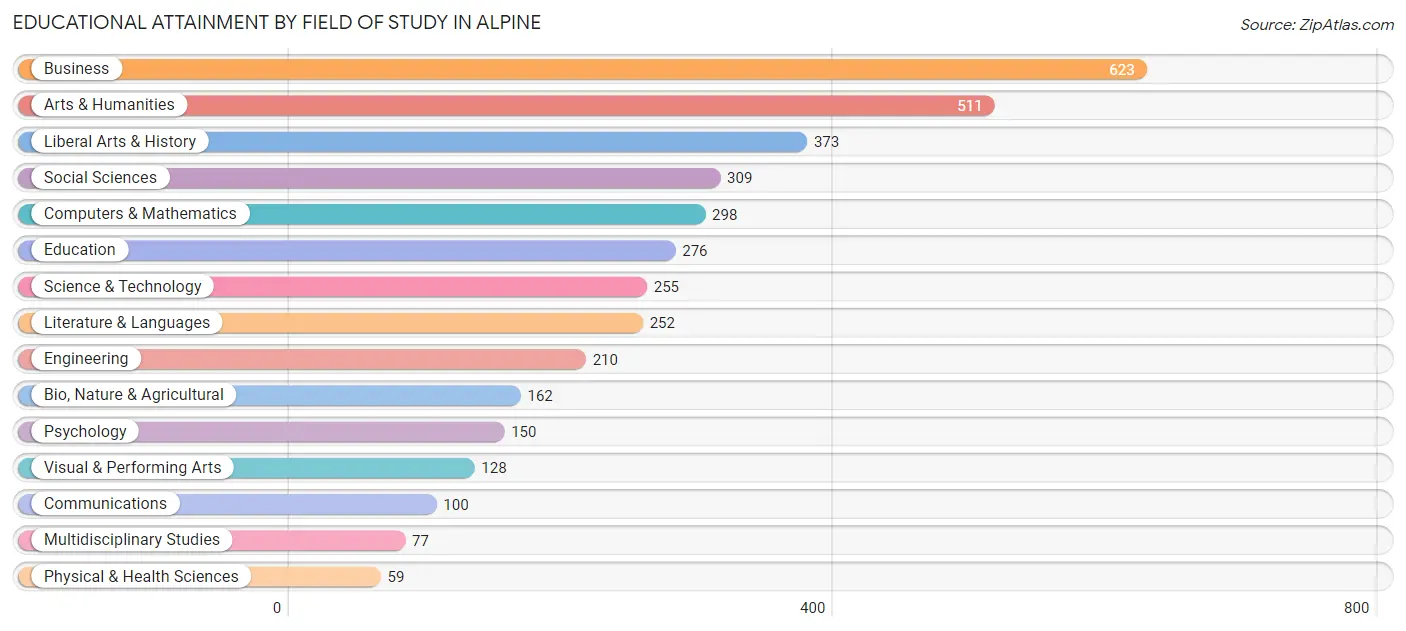
| Field of Study | # Graduates | % Graduates |
| Computers & Mathematics | 298 | 7.9% |
| Bio, Nature & Agricultural | 162 | 4.3% |
| Physical & Health Sciences | 59 | 1.6% |
| Psychology | 150 | 4.0% |
| Social Sciences | 309 | 8.2% |
| Engineering | 210 | 5.6% |
| Multidisciplinary Studies | 77 | 2.0% |
| Science & Technology | 255 | 6.7% |
| Business | 623 | 16.5% |
| Education | 276 | 7.3% |
| Literature & Languages | 252 | 6.7% |
| Liberal Arts & History | 373 | 9.9% |
| Visual & Performing Arts | 128 | 3.4% |
| Communications | 100 | 2.6% |
| Arts & Humanities | 511 | 13.5% |
| Total | 3,783 | 100.0% |
Transportation & Commute in Alpine
Vehicle Availability by Sex in Alpine
The most prevalent vehicle ownership categories in Alpine are males with 2 vehicles (1,502, accounting for 40.0%) and females with 2 vehicles (1,445, making up 45.0%).
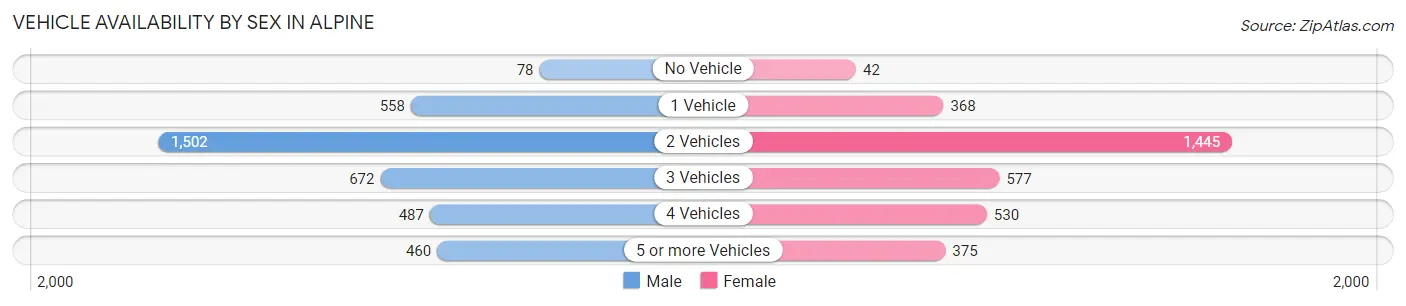
| Vehicles Available | Male | Female |
| No Vehicle | 78 (2.1%) | 42 (1.3%) |
| 1 Vehicle | 558 (14.8%) | 368 (11.0%) |
| 2 Vehicles | 1,502 (40.0%) | 1,445 (43.3%) |
| 3 Vehicles | 672 (17.9%) | 577 (17.3%) |
| 4 Vehicles | 487 (13.0%) | 530 (15.9%) |
| 5 or more Vehicles | 460 (12.2%) | 375 (11.2%) |
| Total | 3,757 (100.0%) | 3,337 (100.0%) |
Commute Time in Alpine
The most frequently occuring commute durations in Alpine are 30 to 34 minutes (1,087 commuters, 16.5%), 20 to 24 minutes (858 commuters, 13.1%), and 10 to 14 minutes (780 commuters, 11.9%).
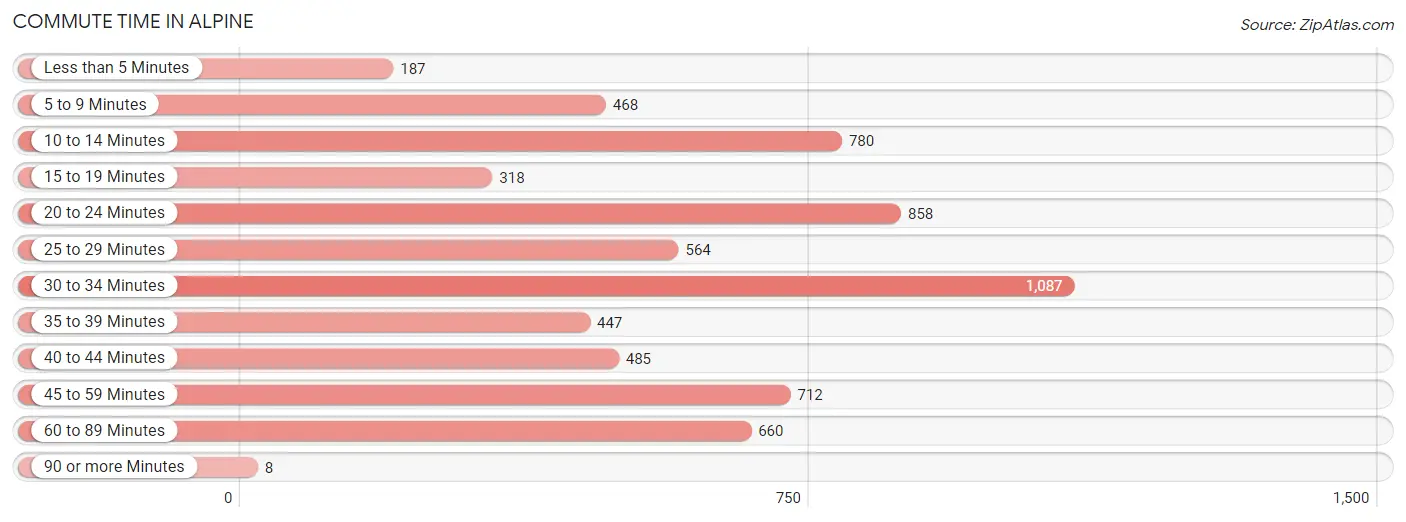
| Commute Time | # Commuters | % Commuters |
| Less than 5 Minutes | 187 | 2.8% |
| 5 to 9 Minutes | 468 | 7.1% |
| 10 to 14 Minutes | 780 | 11.9% |
| 15 to 19 Minutes | 318 | 4.8% |
| 20 to 24 Minutes | 858 | 13.1% |
| 25 to 29 Minutes | 564 | 8.6% |
| 30 to 34 Minutes | 1,087 | 16.5% |
| 35 to 39 Minutes | 447 | 6.8% |
| 40 to 44 Minutes | 485 | 7.4% |
| 45 to 59 Minutes | 712 | 10.8% |
| 60 to 89 Minutes | 660 | 10.0% |
| 90 or more Minutes | 8 | 0.1% |
Commute Time by Sex in Alpine
The most common commute times in Alpine are 30 to 34 minutes (556 commuters, 15.4%) for males and 30 to 34 minutes (531 commuters, 18.0%) for females.
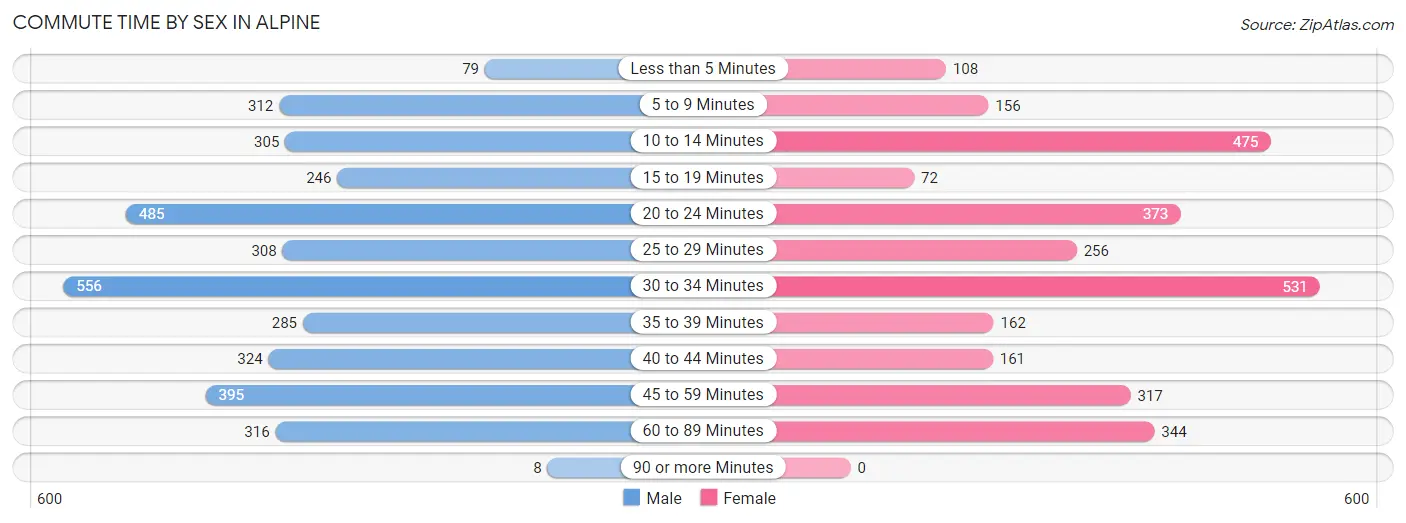
| Commute Time | Male | Female |
| Less than 5 Minutes | 79 (2.2%) | 108 (3.6%) |
| 5 to 9 Minutes | 312 (8.6%) | 156 (5.3%) |
| 10 to 14 Minutes | 305 (8.4%) | 475 (16.1%) |
| 15 to 19 Minutes | 246 (6.8%) | 72 (2.4%) |
| 20 to 24 Minutes | 485 (13.4%) | 373 (12.6%) |
| 25 to 29 Minutes | 308 (8.5%) | 256 (8.7%) |
| 30 to 34 Minutes | 556 (15.4%) | 531 (18.0%) |
| 35 to 39 Minutes | 285 (7.9%) | 162 (5.5%) |
| 40 to 44 Minutes | 324 (8.9%) | 161 (5.4%) |
| 45 to 59 Minutes | 395 (10.9%) | 317 (10.7%) |
| 60 to 89 Minutes | 316 (8.7%) | 344 (11.6%) |
| 90 or more Minutes | 8 (0.2%) | 0 (0.0%) |
Time of Departure to Work by Sex in Alpine
The most frequent times of departure to work in Alpine are 6:00 AM to 6:29 AM (518, 14.3%) for males and 7:00 AM to 7:29 AM (479, 16.2%) for females.
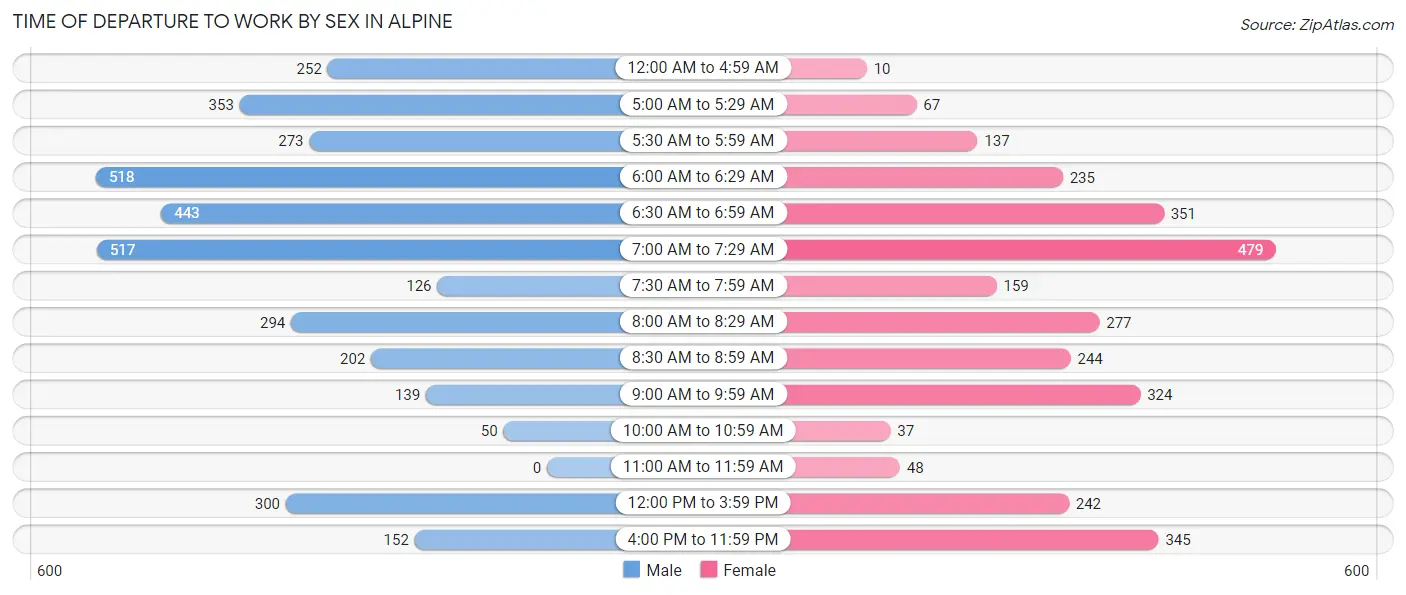
| Time of Departure | Male | Female |
| 12:00 AM to 4:59 AM | 252 (7.0%) | 10 (0.3%) |
| 5:00 AM to 5:29 AM | 353 (9.8%) | 67 (2.3%) |
| 5:30 AM to 5:59 AM | 273 (7.5%) | 137 (4.6%) |
| 6:00 AM to 6:29 AM | 518 (14.3%) | 235 (8.0%) |
| 6:30 AM to 6:59 AM | 443 (12.2%) | 351 (11.9%) |
| 7:00 AM to 7:29 AM | 517 (14.3%) | 479 (16.2%) |
| 7:30 AM to 7:59 AM | 126 (3.5%) | 159 (5.4%) |
| 8:00 AM to 8:29 AM | 294 (8.1%) | 277 (9.4%) |
| 8:30 AM to 8:59 AM | 202 (5.6%) | 244 (8.3%) |
| 9:00 AM to 9:59 AM | 139 (3.8%) | 324 (11.0%) |
| 10:00 AM to 10:59 AM | 50 (1.4%) | 37 (1.3%) |
| 11:00 AM to 11:59 AM | 0 (0.0%) | 48 (1.6%) |
| 12:00 PM to 3:59 PM | 300 (8.3%) | 242 (8.2%) |
| 4:00 PM to 11:59 PM | 152 (4.2%) | 345 (11.7%) |
| Total | 3,619 (100.0%) | 2,955 (100.0%) |
Housing Occupancy in Alpine
Occupancy by Ownership in Alpine
Of the total 5,464 dwellings in Alpine, owner-occupied units account for 3,897 (71.3%), while renter-occupied units make up 1,567 (28.7%).
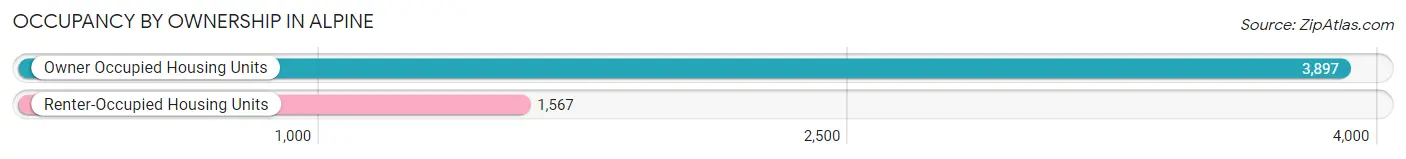
| Occupancy | # Housing Units | % Housing Units |
| Owner Occupied Housing Units | 3,897 | 71.3% |
| Renter-Occupied Housing Units | 1,567 | 28.7% |
| Total Occupied Housing Units | 5,464 | 100.0% |
Occupancy by Household Size in Alpine
| Household Size | # Housing Units | % Housing Units |
| 1-Person Household | 1,057 | 19.3% |
| 2-Person Household | 1,920 | 35.1% |
| 3-Person Household | 910 | 16.7% |
| 4+ Person Household | 1,577 | 28.9% |
| Total Housing Units | 5,464 | 100.0% |
Occupancy by Ownership by Household Size in Alpine
| Household Size | Owner-occupied | Renter-occupied |
| 1-Person Household | 594 (56.2%) | 463 (43.8%) |
| 2-Person Household | 1,577 (82.1%) | 343 (17.9%) |
| 3-Person Household | 603 (66.3%) | 307 (33.7%) |
| 4+ Person Household | 1,123 (71.2%) | 454 (28.8%) |
| Total Housing Units | 3,897 (71.3%) | 1,567 (28.7%) |
Occupancy by Educational Attainment in Alpine
| Household Size | Owner-occupied | Renter-occupied |
| Less than High School | 34 (19.2%) | 143 (80.8%) |
| High School Diploma | 507 (57.7%) | 372 (42.3%) |
| College/Associate Degree | 1,945 (73.6%) | 699 (26.4%) |
| Bachelor's Degree or higher | 1,411 (80.0%) | 353 (20.0%) |
Occupancy by Age of Householder in Alpine
| Age Bracket | # Households | % Households |
| Under 35 Years | 797 | 14.6% |
| 35 to 44 Years | 833 | 15.2% |
| 45 to 54 Years | 1,270 | 23.2% |
| 55 to 64 Years | 1,149 | 21.0% |
| 65 to 74 Years | 801 | 14.7% |
| 75 to 84 Years | 536 | 9.8% |
| 85 Years and Over | 78 | 1.4% |
| Total | 5,464 | 100.0% |
Housing Finances in Alpine
Median Income by Occupancy in Alpine
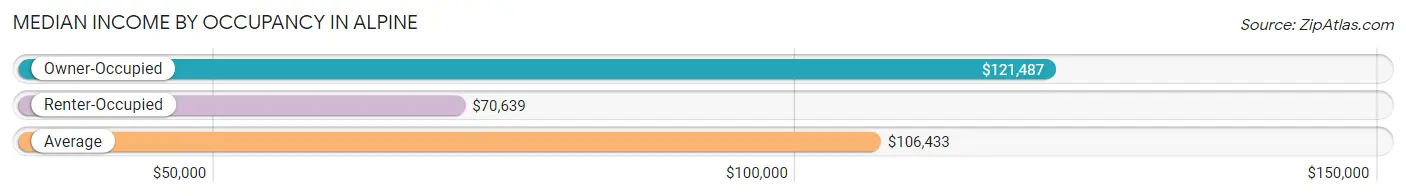
| Occupancy Type | # Households | Median Income |
| Owner-Occupied | 3,897 (71.3%) | $121,487 |
| Renter-Occupied | 1,567 (28.7%) | $70,639 |
| Average | 5,464 (100.0%) | $106,433 |
Occupancy by Householder Income Bracket in Alpine
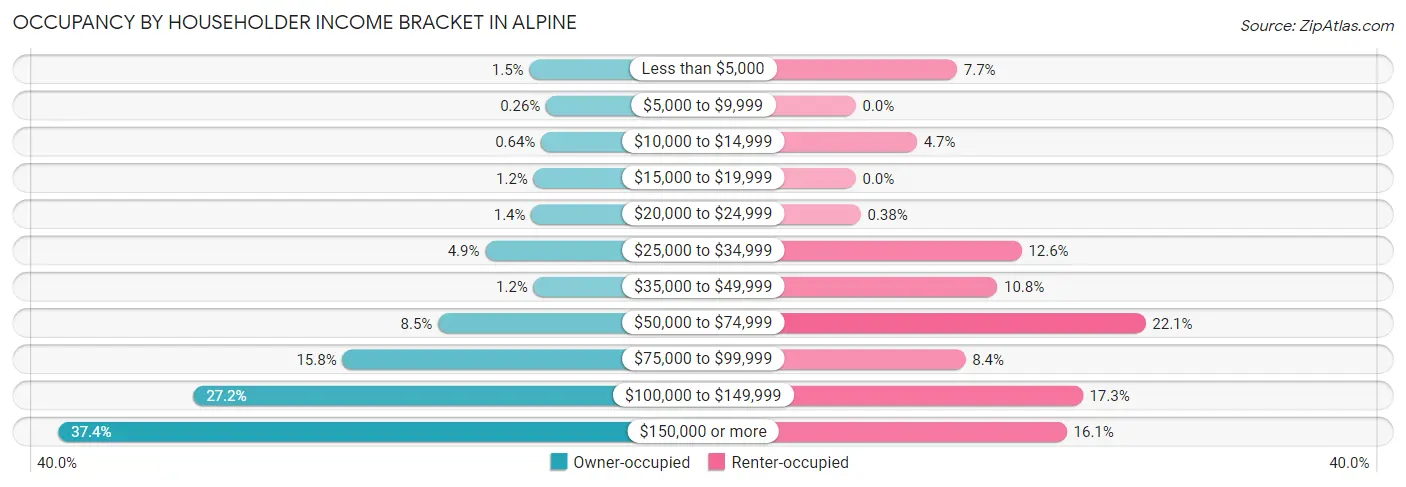
| Income Bracket | Owner-occupied | Renter-occupied |
| Less than $5,000 | 60 (1.5%) | 121 (7.7%) |
| $5,000 to $9,999 | 10 (0.3%) | 0 (0.0%) |
| $10,000 to $14,999 | 25 (0.6%) | 73 (4.7%) |
| $15,000 to $19,999 | 47 (1.2%) | 0 (0.0%) |
| $20,000 to $24,999 | 54 (1.4%) | 6 (0.4%) |
| $25,000 to $34,999 | 191 (4.9%) | 198 (12.6%) |
| $35,000 to $49,999 | 47 (1.2%) | 169 (10.8%) |
| $50,000 to $74,999 | 331 (8.5%) | 346 (22.1%) |
| $75,000 to $99,999 | 615 (15.8%) | 131 (8.4%) |
| $100,000 to $149,999 | 1,058 (27.2%) | 271 (17.3%) |
| $150,000 or more | 1,459 (37.4%) | 252 (16.1%) |
| Total | 3,897 (100.0%) | 1,567 (100.0%) |
Monthly Housing Cost Tiers in Alpine
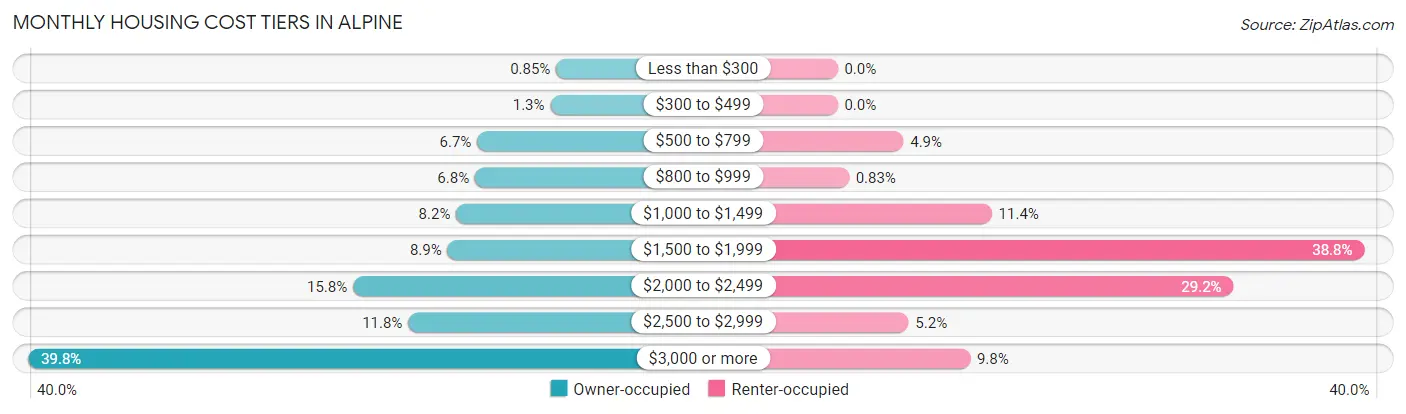
| Monthly Cost | Owner-occupied | Renter-occupied |
| Less than $300 | 33 (0.9%) | 0 (0.0%) |
| $300 to $499 | 50 (1.3%) | 0 (0.0%) |
| $500 to $799 | 260 (6.7%) | 76 (4.9%) |
| $800 to $999 | 266 (6.8%) | 13 (0.8%) |
| $1,000 to $1,499 | 320 (8.2%) | 178 (11.4%) |
| $1,500 to $1,999 | 345 (8.8%) | 608 (38.8%) |
| $2,000 to $2,499 | 616 (15.8%) | 457 (29.2%) |
| $2,500 to $2,999 | 458 (11.7%) | 82 (5.2%) |
| $3,000 or more | 1,549 (39.8%) | 153 (9.8%) |
| Total | 3,897 (100.0%) | 1,567 (100.0%) |
Physical Housing Characteristics in Alpine
Housing Structures in Alpine
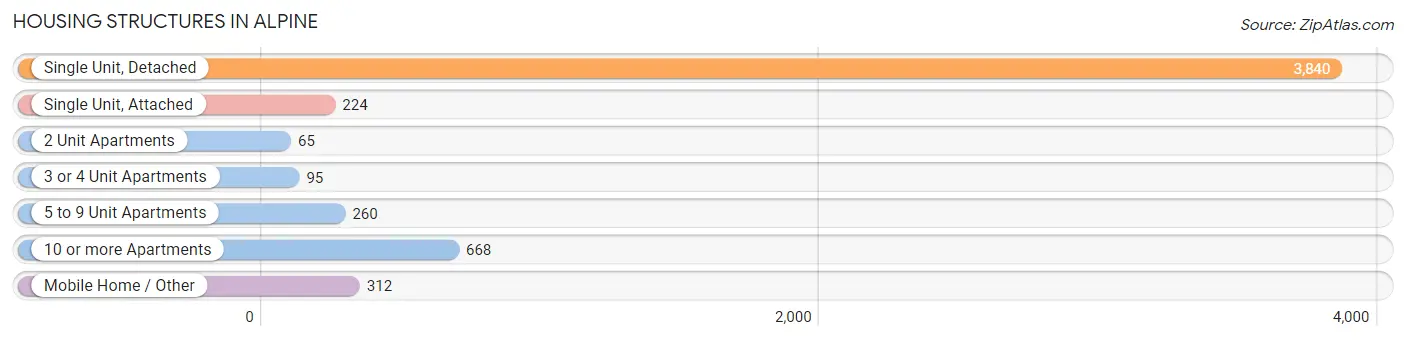
| Structure Type | # Housing Units | % Housing Units |
| Single Unit, Detached | 3,840 | 70.3% |
| Single Unit, Attached | 224 | 4.1% |
| 2 Unit Apartments | 65 | 1.2% |
| 3 or 4 Unit Apartments | 95 | 1.7% |
| 5 to 9 Unit Apartments | 260 | 4.8% |
| 10 or more Apartments | 668 | 12.2% |
| Mobile Home / Other | 312 | 5.7% |
| Total | 5,464 | 100.0% |
Housing Structures by Occupancy in Alpine
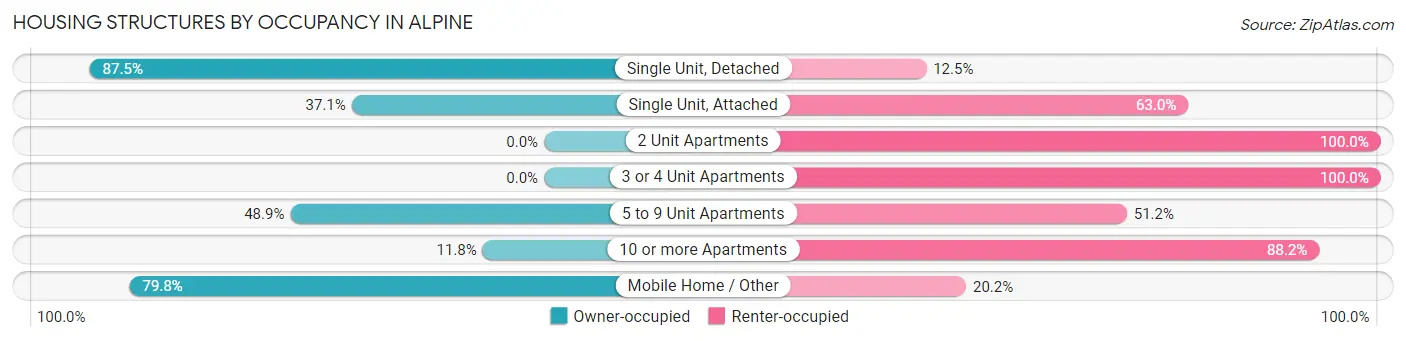
| Structure Type | Owner-occupied | Renter-occupied |
| Single Unit, Detached | 3,359 (87.5%) | 481 (12.5%) |
| Single Unit, Attached | 83 (37.0%) | 141 (62.9%) |
| 2 Unit Apartments | 0 (0.0%) | 65 (100.0%) |
| 3 or 4 Unit Apartments | 0 (0.0%) | 95 (100.0%) |
| 5 to 9 Unit Apartments | 127 (48.8%) | 133 (51.1%) |
| 10 or more Apartments | 79 (11.8%) | 589 (88.2%) |
| Mobile Home / Other | 249 (79.8%) | 63 (20.2%) |
| Total | 3,897 (71.3%) | 1,567 (28.7%) |
Housing Structures by Number of Rooms in Alpine
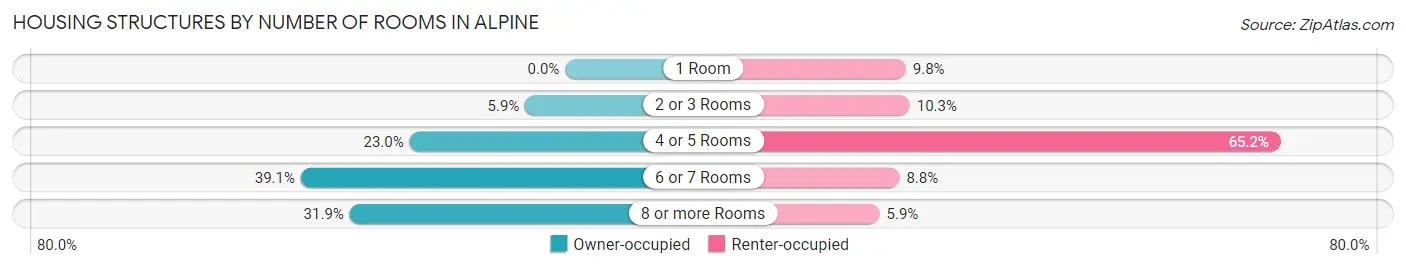
| Number of Rooms | Owner-occupied | Renter-occupied |
| 1 Room | 0 (0.0%) | 153 (9.8%) |
| 2 or 3 Rooms | 231 (5.9%) | 162 (10.3%) |
| 4 or 5 Rooms | 898 (23.0%) | 1,022 (65.2%) |
| 6 or 7 Rooms | 1,525 (39.1%) | 138 (8.8%) |
| 8 or more Rooms | 1,243 (31.9%) | 92 (5.9%) |
| Total | 3,897 (100.0%) | 1,567 (100.0%) |
Housing Structure by Heating Type in Alpine
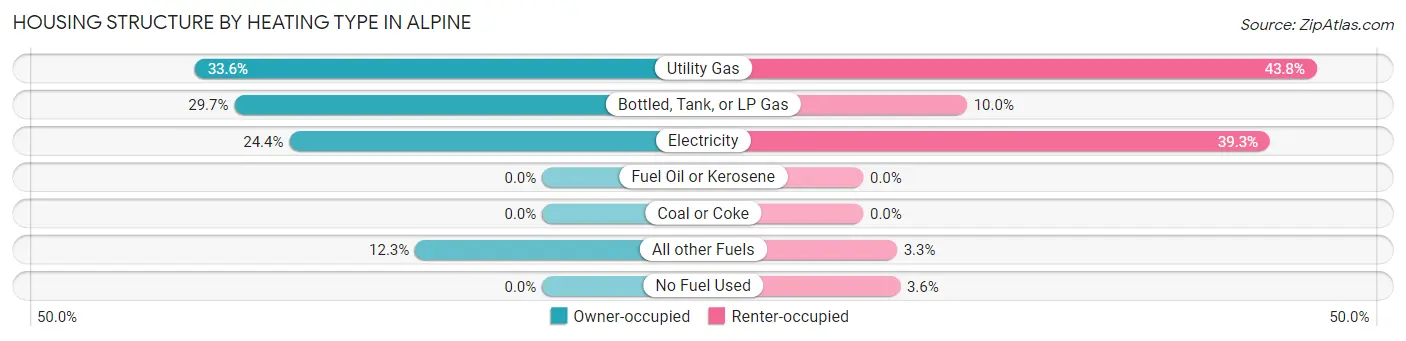
| Heating Type | Owner-occupied | Renter-occupied |
| Utility Gas | 1,308 (33.6%) | 687 (43.8%) |
| Bottled, Tank, or LP Gas | 1,159 (29.7%) | 157 (10.0%) |
| Electricity | 952 (24.4%) | 616 (39.3%) |
| Fuel Oil or Kerosene | 0 (0.0%) | 0 (0.0%) |
| Coal or Coke | 0 (0.0%) | 0 (0.0%) |
| All other Fuels | 478 (12.3%) | 51 (3.3%) |
| No Fuel Used | 0 (0.0%) | 56 (3.6%) |
| Total | 3,897 (100.0%) | 1,567 (100.0%) |
Household Vehicle Usage in Alpine
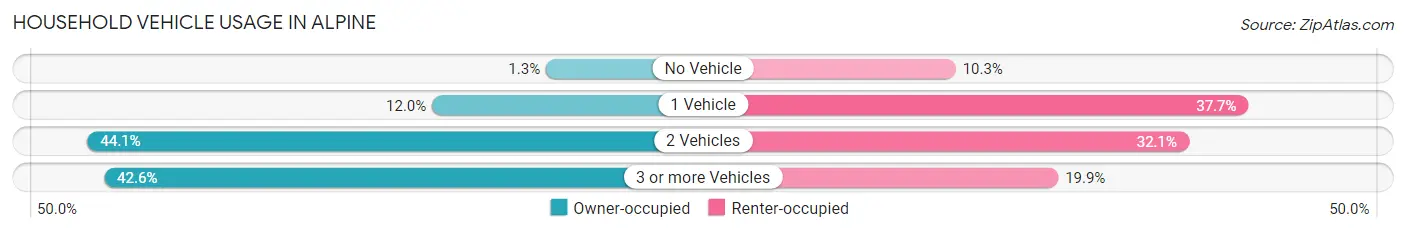
| Vehicles per Household | Owner-occupied | Renter-occupied |
| No Vehicle | 52 (1.3%) | 162 (10.3%) |
| 1 Vehicle | 466 (12.0%) | 590 (37.7%) |
| 2 Vehicles | 1,720 (44.1%) | 503 (32.1%) |
| 3 or more Vehicles | 1,659 (42.6%) | 312 (19.9%) |
| Total | 3,897 (100.0%) | 1,567 (100.0%) |
Real Estate & Mortgages in Alpine
Real Estate and Mortgage Overview in Alpine
| Characteristic | Without Mortgage | With Mortgage |
| Housing Units | 936 | 2,961 |
| Median Property Value | $740,100 | $762,700 |
| Median Household Income | $73,500 | $1,288 |
| Monthly Housing Costs | $984 | $1,549 |
| Real Estate Taxes | $3,919 | $9 |
Property Value by Mortgage Status in Alpine
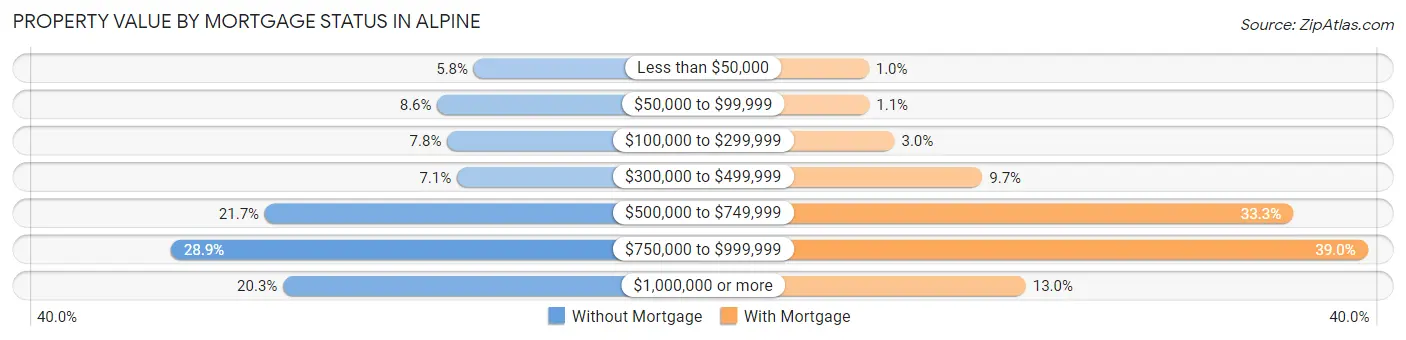
| Property Value | Without Mortgage | With Mortgage |
| Less than $50,000 | 54 (5.8%) | 30 (1.0%) |
| $50,000 to $99,999 | 80 (8.6%) | 31 (1.1%) |
| $100,000 to $299,999 | 73 (7.8%) | 88 (3.0%) |
| $300,000 to $499,999 | 66 (7.0%) | 286 (9.7%) |
| $500,000 to $749,999 | 203 (21.7%) | 987 (33.3%) |
| $750,000 to $999,999 | 270 (28.8%) | 1,155 (39.0%) |
| $1,000,000 or more | 190 (20.3%) | 384 (13.0%) |
| Total | 936 (100.0%) | 2,961 (100.0%) |
Household Income by Mortgage Status in Alpine
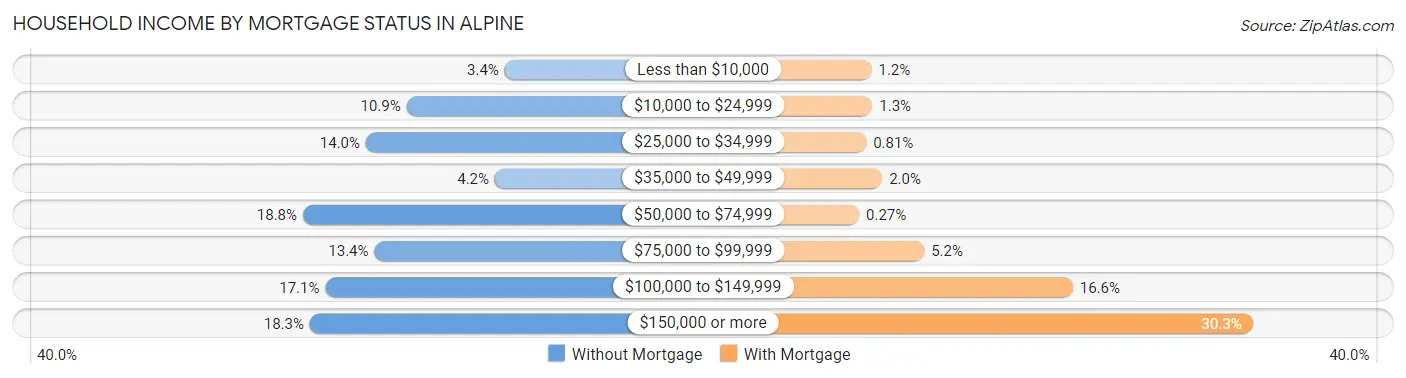
| Household Income | Without Mortgage | With Mortgage |
| Less than $10,000 | 32 (3.4%) | 36 (1.2%) |
| $10,000 to $24,999 | 102 (10.9%) | 38 (1.3%) |
| $25,000 to $34,999 | 131 (14.0%) | 24 (0.8%) |
| $35,000 to $49,999 | 39 (4.2%) | 60 (2.0%) |
| $50,000 to $74,999 | 176 (18.8%) | 8 (0.3%) |
| $75,000 to $99,999 | 125 (13.4%) | 155 (5.2%) |
| $100,000 to $149,999 | 160 (17.1%) | 490 (16.6%) |
| $150,000 or more | 171 (18.3%) | 898 (30.3%) |
| Total | 936 (100.0%) | 2,961 (100.0%) |
Property Value to Household Income Ratio in Alpine
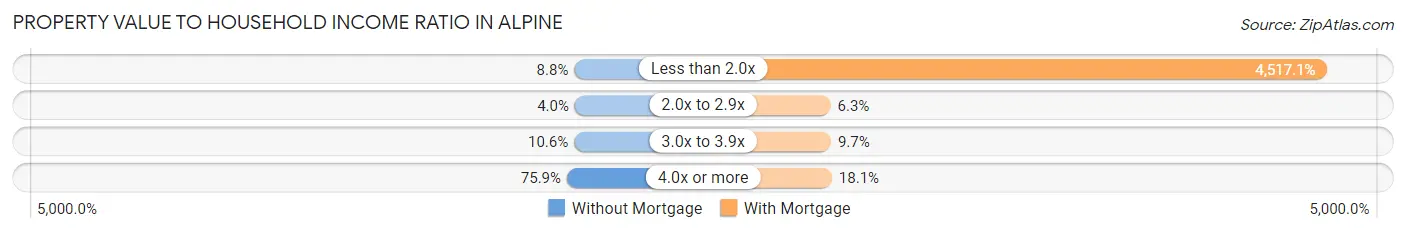
| Value-to-Income Ratio | Without Mortgage | With Mortgage |
| Less than 2.0x | 82 (8.8%) | 133,750 (4,517.1%) |
| 2.0x to 2.9x | 37 (4.0%) | 185 (6.2%) |
| 3.0x to 3.9x | 99 (10.6%) | 288 (9.7%) |
| 4.0x or more | 710 (75.8%) | 535 (18.1%) |
| Total | 936 (100.0%) | 2,961 (100.0%) |
Real Estate Taxes by Mortgage Status in Alpine
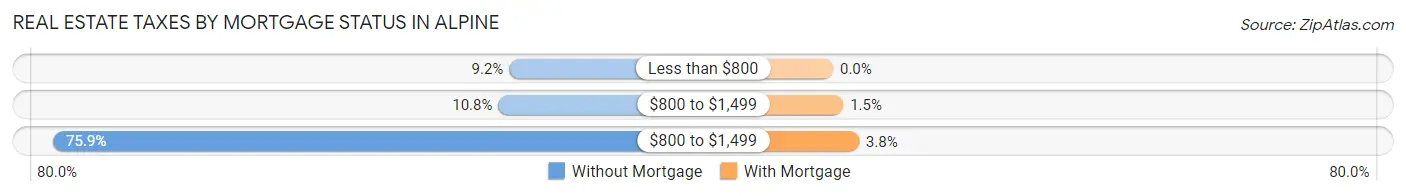
| Property Taxes | Without Mortgage | With Mortgage |
| Less than $800 | 86 (9.2%) | 0 (0.0%) |
| $800 to $1,499 | 101 (10.8%) | 44 (1.5%) |
| $800 to $1,499 | 710 (75.8%) | 112 (3.8%) |
| Total | 936 (100.0%) | 2,961 (100.0%) |
Health & Disability in Alpine
Health Insurance Coverage by Age in Alpine
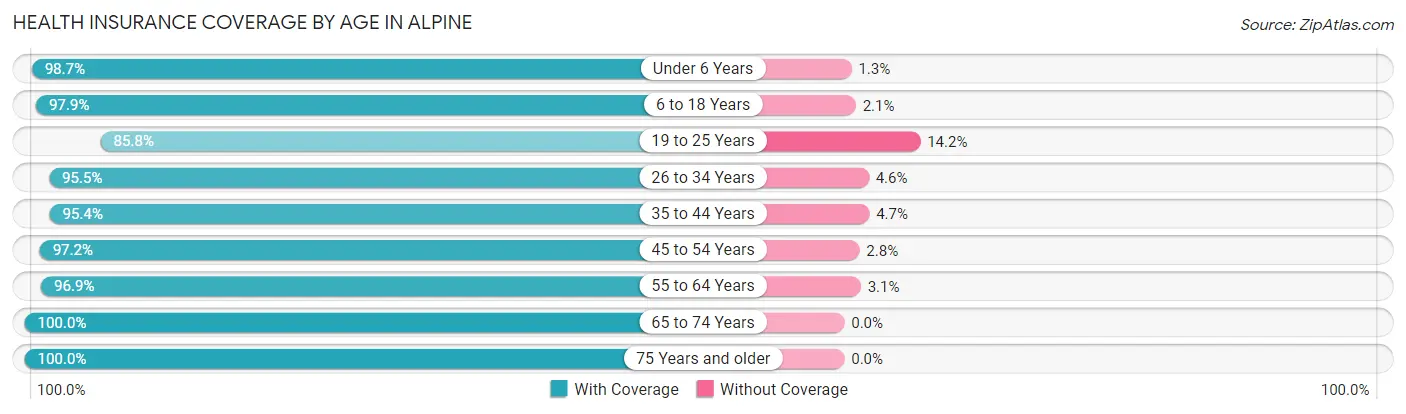
| Age Bracket | With Coverage | Without Coverage |
| Under 6 Years | 1,033 (98.7%) | 14 (1.3%) |
| 6 to 18 Years | 2,714 (97.9%) | 59 (2.1%) |
| 19 to 25 Years | 964 (85.8%) | 159 (14.2%) |
| 26 to 34 Years | 1,721 (95.5%) | 82 (4.5%) |
| 35 to 44 Years | 1,782 (95.4%) | 87 (4.6%) |
| 45 to 54 Years | 2,415 (97.2%) | 70 (2.8%) |
| 55 to 64 Years | 1,956 (96.9%) | 62 (3.1%) |
| 65 to 74 Years | 1,552 (100.0%) | 0 (0.0%) |
| 75 Years and older | 1,214 (100.0%) | 0 (0.0%) |
| Total | 15,351 (96.6%) | 533 (3.4%) |
Health Insurance Coverage by Citizenship Status in Alpine
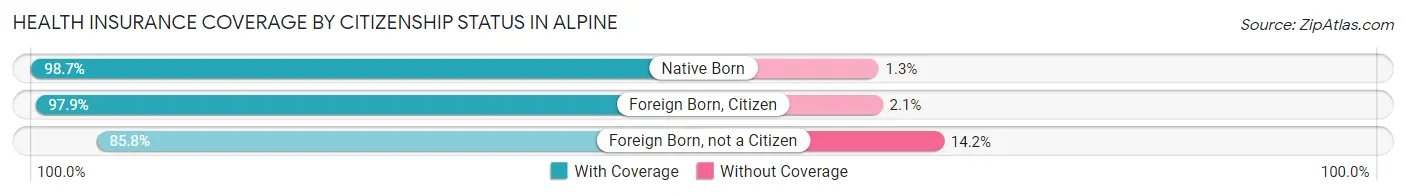
| Citizenship Status | With Coverage | Without Coverage |
| Native Born | 1,033 (98.7%) | 14 (1.3%) |
| Foreign Born, Citizen | 2,714 (97.9%) | 59 (2.1%) |
| Foreign Born, not a Citizen | 964 (85.8%) | 159 (14.2%) |
Health Insurance Coverage by Household Income in Alpine
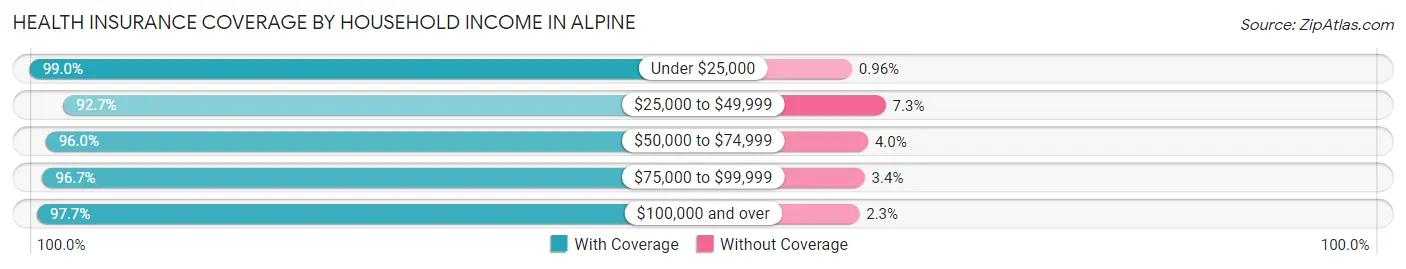
| Household Income | With Coverage | Without Coverage |
| Under $25,000 | 621 (99.0%) | 6 (1.0%) |
| $25,000 to $49,999 | 1,491 (92.7%) | 117 (7.3%) |
| $50,000 to $74,999 | 1,643 (96.0%) | 68 (4.0%) |
| $75,000 to $99,999 | 1,935 (96.7%) | 67 (3.4%) |
| $100,000 and over | 9,472 (97.7%) | 227 (2.3%) |
Public vs Private Health Insurance Coverage by Age in Alpine
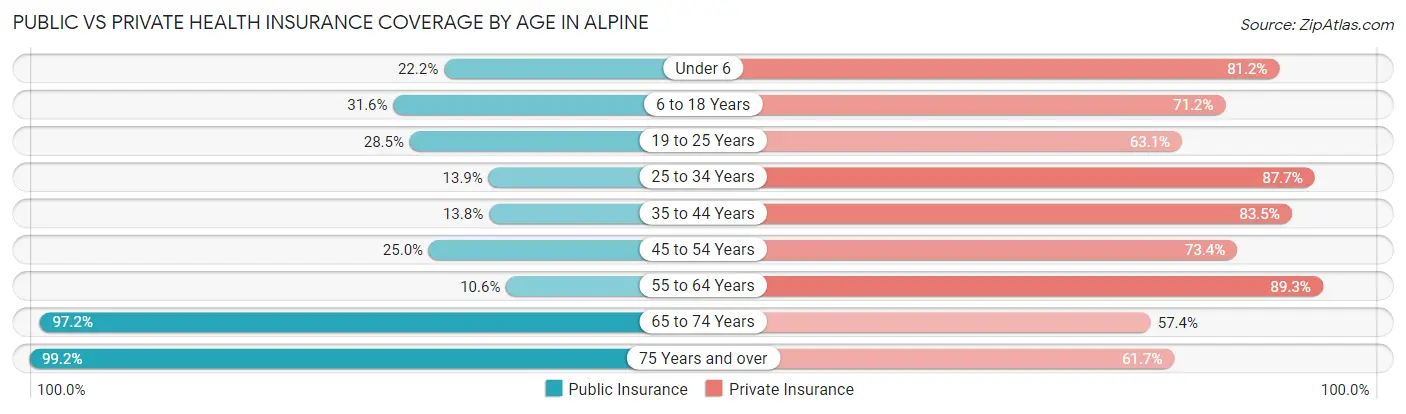
| Age Bracket | Public Insurance | Private Insurance |
| Under 6 | 232 (22.2%) | 850 (81.2%) |
| 6 to 18 Years | 875 (31.6%) | 1,974 (71.2%) |
| 19 to 25 Years | 320 (28.5%) | 709 (63.1%) |
| 25 to 34 Years | 250 (13.9%) | 1,582 (87.7%) |
| 35 to 44 Years | 258 (13.8%) | 1,560 (83.5%) |
| 45 to 54 Years | 620 (24.9%) | 1,823 (73.4%) |
| 55 to 64 Years | 214 (10.6%) | 1,801 (89.2%) |
| 65 to 74 Years | 1,509 (97.2%) | 890 (57.4%) |
| 75 Years and over | 1,204 (99.2%) | 749 (61.7%) |
| Total | 5,482 (34.5%) | 11,938 (75.2%) |
Disability Status by Sex by Age in Alpine
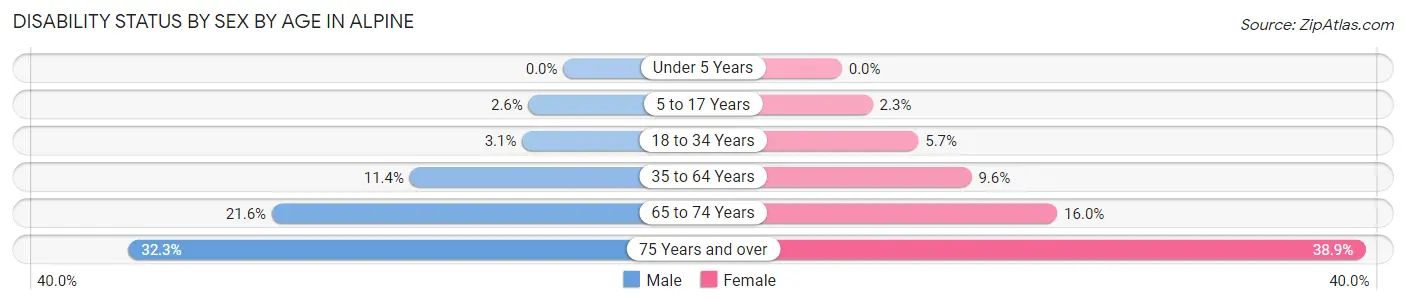
| Age Bracket | Male | Female |
| Under 5 Years | 0 (0.0%) | 0 (0.0%) |
| 5 to 17 Years | 30 (2.6%) | 37 (2.3%) |
| 18 to 34 Years | 49 (3.0%) | 85 (5.7%) |
| 35 to 64 Years | 356 (11.4%) | 313 (9.6%) |
| 65 to 74 Years | 164 (21.6%) | 127 (16.0%) |
| 75 Years and over | 146 (32.3%) | 296 (38.9%) |
Disability Class by Sex by Age in Alpine
Disability Class: Hearing Difficulty
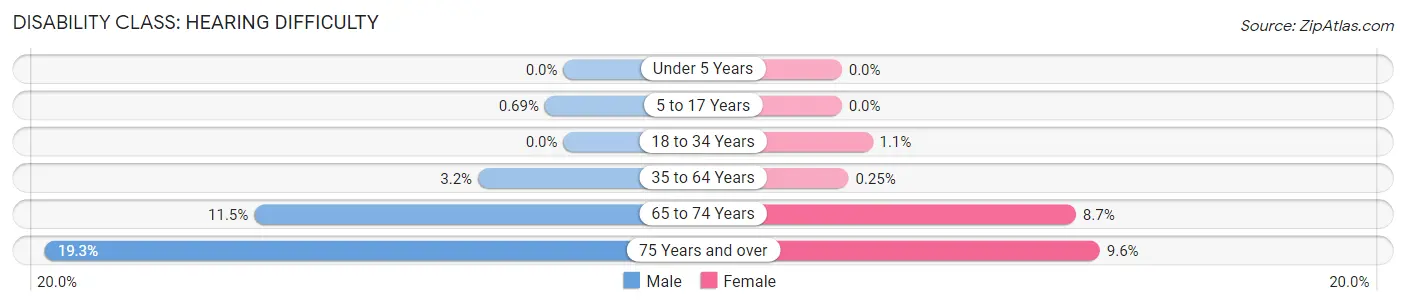
| Age Bracket | Male | Female |
| Under 5 Years | 0 (0.0%) | 0 (0.0%) |
| 5 to 17 Years | 8 (0.7%) | 0 (0.0%) |
| 18 to 34 Years | 0 (0.0%) | 17 (1.1%) |
| 35 to 64 Years | 99 (3.2%) | 8 (0.3%) |
| 65 to 74 Years | 87 (11.5%) | 69 (8.7%) |
| 75 Years and over | 87 (19.3%) | 73 (9.6%) |
Disability Class: Vision Difficulty
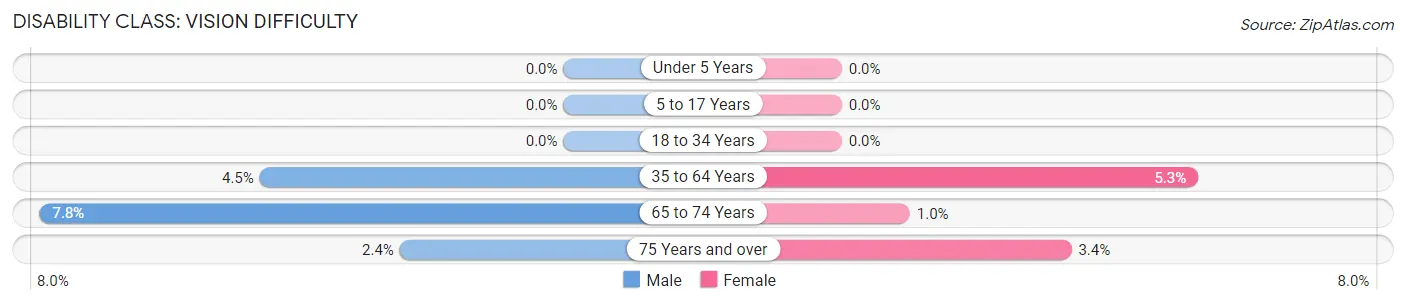
| Age Bracket | Male | Female |
| Under 5 Years | 0 (0.0%) | 0 (0.0%) |
| 5 to 17 Years | 0 (0.0%) | 0 (0.0%) |
| 18 to 34 Years | 0 (0.0%) | 0 (0.0%) |
| 35 to 64 Years | 141 (4.5%) | 172 (5.3%) |
| 65 to 74 Years | 59 (7.8%) | 8 (1.0%) |
| 75 Years and over | 11 (2.4%) | 26 (3.4%) |
Disability Class: Cognitive Difficulty
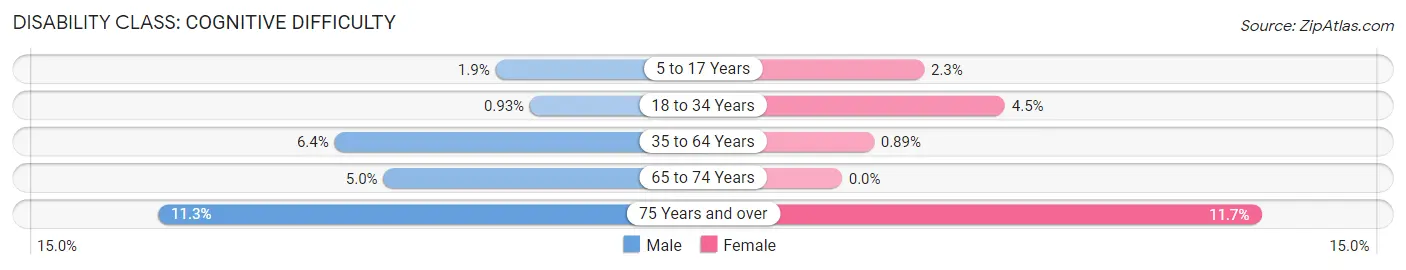
| Age Bracket | Male | Female |
| 5 to 17 Years | 22 (1.9%) | 37 (2.3%) |
| 18 to 34 Years | 15 (0.9%) | 68 (4.5%) |
| 35 to 64 Years | 199 (6.4%) | 29 (0.9%) |
| 65 to 74 Years | 38 (5.0%) | 0 (0.0%) |
| 75 Years and over | 51 (11.3%) | 89 (11.7%) |
Disability Class: Ambulatory Difficulty
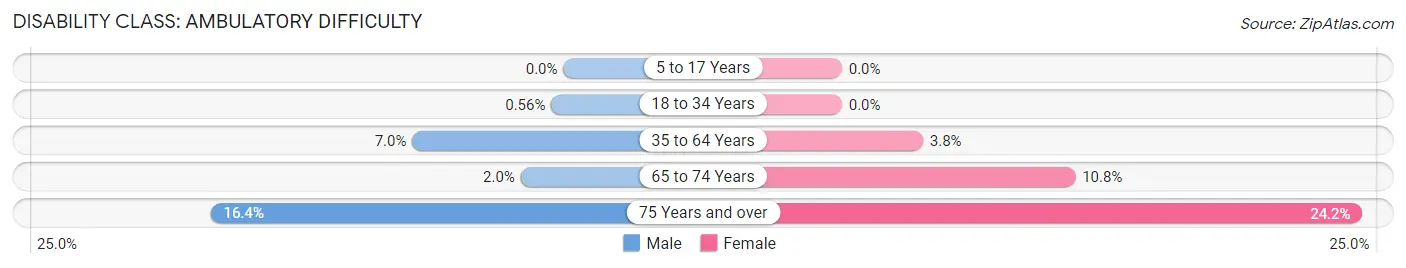
| Age Bracket | Male | Female |
| 5 to 17 Years | 0 (0.0%) | 0 (0.0%) |
| 18 to 34 Years | 9 (0.6%) | 0 (0.0%) |
| 35 to 64 Years | 219 (7.0%) | 122 (3.8%) |
| 65 to 74 Years | 15 (2.0%) | 86 (10.8%) |
| 75 Years and over | 74 (16.4%) | 184 (24.1%) |
Disability Class: Self-Care Difficulty
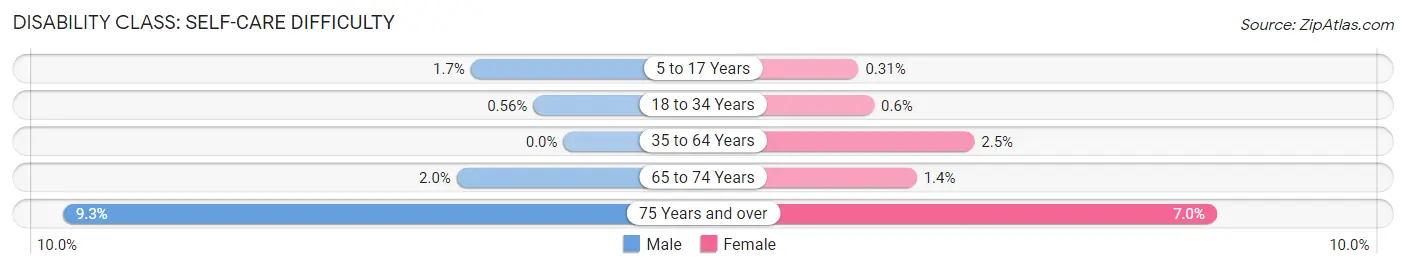
| Age Bracket | Male | Female |
| 5 to 17 Years | 20 (1.7%) | 5 (0.3%) |
| 18 to 34 Years | 9 (0.6%) | 9 (0.6%) |
| 35 to 64 Years | 0 (0.0%) | 80 (2.5%) |
| 65 to 74 Years | 15 (2.0%) | 11 (1.4%) |
| 75 Years and over | 42 (9.3%) | 53 (7.0%) |
Technology Access in Alpine
Computing Device Access in Alpine
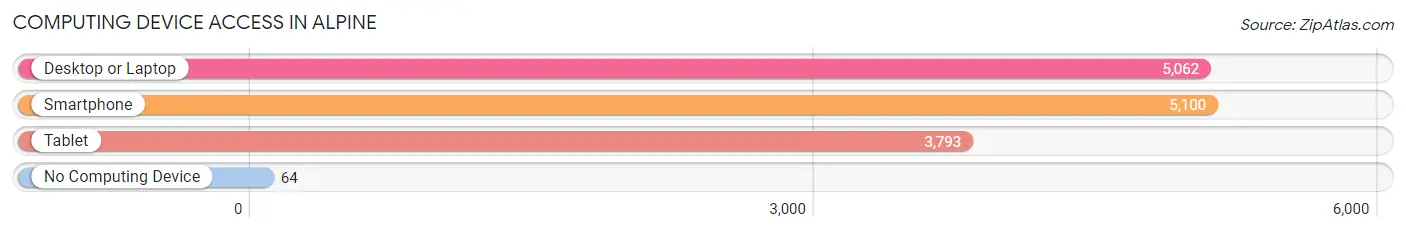
| Device Type | # Households | % Households |
| Desktop or Laptop | 5,062 | 92.6% |
| Smartphone | 5,100 | 93.3% |
| Tablet | 3,793 | 69.4% |
| No Computing Device | 64 | 1.2% |
| Total | 5,464 | 100.0% |
Internet Access in Alpine
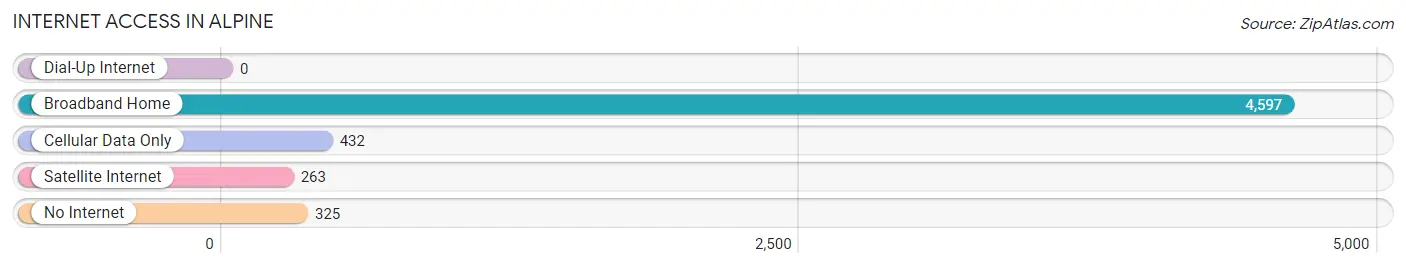
| Internet Type | # Households | % Households |
| Dial-Up Internet | 0 | 0.0% |
| Broadband Home | 4,597 | 84.1% |
| Cellular Data Only | 432 | 7.9% |
| Satellite Internet | 263 | 4.8% |
| No Internet | 325 | 5.9% |
| Total | 5,464 | 100.0% |
Alpine Summary
Alpine is a census-designated place (CDP) located in San Diego County, California, United States. It is located in the foothills of the Cuyamaca Mountains, approximately 25 miles east of downtown San Diego. The population was 14,236 at the 2010 census, up from 13,143 at the 2000 census. The area is known for its rural atmosphere and its proximity to the Cleveland National Forest.
Geography
Alpine is located at 32°50′45″N 116°45′45″W (32.845556, -116.762500). According to the United States Census Bureau, the CDP has a total area of 26.8 square miles (69.4 km2), all land.
The community is served by Interstate 8 and State Route 79
History
The area was first settled in the late 19th century by ranchers and farmers. The area was known as "Noble Valley" until the early 20th century, when it was renamed "Alpine" after the nearby mountain range.
The area was originally part of the Rancho Cuyamaca Mexican land grant, and was later part of San Diego County. The area was sparsely populated until the 1950s, when the construction of Interstate 8 and State Route 79 brought more people to the area.
Economy
Alpine is primarily a residential community, with a few small businesses located in the area. The primary industries in the area are tourism, agriculture, and light manufacturing.
The area is home to several wineries, including the Alpine Creek Winery, which produces a variety of wines from grapes grown in the area.
Demographics
As of the census of 2000, there were 13,143 people, 4,717 households, and 3,541 families residing in the CDP. The population density was 489.3 people per square mile (189.2/km2). There were 4,919 housing units at an average density of 183.7 per square mile (71.0/km2). The racial makeup of the CDP was 87.2% White, 0.8% African American, 0.7% Native American, 1.2% Asian, 0.2% Pacific Islander, 7.3% from other races, and 2.6% from two or more races. Hispanic or Latino of any race were 17.2% of the population.
There were 4,717 households, out of which 37.2% had children under the age of 18 living with them, 61.2% were married couples living together, 9.3% had a female householder with no husband present, and 25.2% were non-families. 19.2% of all households were made up of individuals, and 5.2% had someone living alone who was 65 years of age or older. The average household size was 2.77 and the average family size was 3.19.
In the CDP, the population was spread out, with 27.2% under the age of 18, 7.2% from 18 to 24, 30.2% from 25 to 44, 25.2% from 45 to 64, and 10.2% who were 65 years of age or older. The median age was 37 years. For every 100 females, there were 97.7 males. For every 100 females age 18 and over, there were 94.2 males.
The median income for a household in the CDP was $60,972, and the median income for a family was $66,837. Males had a median income of $45,945 versus $32,917 for females. The per capita income for the CDP was $25,845. About 4.2% of families and 5.7% of the population were below the poverty line, including 6.2% of those under age 18 and 4.2% of those age 65 or over.
Common Questions
What is Per Capita Income in Alpine?
Per Capita income in Alpine is $49,005.
What is the Median Family Income in Alpine?
Median Family Income in Alpine is $120,216.
What is the Median Household income in Alpine?
Median Household Income in Alpine is $106,433.
What is Income or Wage Gap in Alpine?
Income or Wage Gap in Alpine is 9.3%.
Women in Alpine earn 90.7 cents for every dollar earned by a man.
What is Family Income Deficit in Alpine?
Family Income Deficit in Alpine is $8,124.
Families that are below poverty line in Alpine earn $8,124 less on average than the poverty threshold level.
What is Inequality or Gini Index in Alpine?
Inequality or Gini Index in Alpine is 0.43.
What is the Total Population of Alpine?
Total Population of Alpine is 15,911.
What is the Total Male Population of Alpine?
Total Male Population of Alpine is 7,660.
What is the Total Female Population of Alpine?
Total Female Population of Alpine is 8,251.
What is the Ratio of Males per 100 Females in Alpine?
There are 92.84 Males per 100 Females in Alpine.
What is the Ratio of Females per 100 Males in Alpine?
There are 107.72 Females per 100 Males in Alpine.
What is the Median Population Age in Alpine?
Median Population Age in Alpine is 41.8 Years.
What is the Average Family Size in Alpine
Average Family Size in Alpine is 3.2 People.
What is the Average Household Size in Alpine
Average Household Size in Alpine is 2.9 People.
How Large is the Labor Force in Alpine?
There are 7,692 People in the Labor Forcein in Alpine.
What is the Percentage of People in the Labor Force in Alpine?
60.8% of People are in the Labor Force in Alpine.
What is the Unemployment Rate in Alpine?
Unemployment Rate in Alpine is 5.9%.