Cities with the Lowest Poverty Level Among Seniors Over the Age of 65 in Alabama
RELATED REPORTS & OPTIONS
Lowest Poverty | Seniors 65+
Alabama
Compare Cities
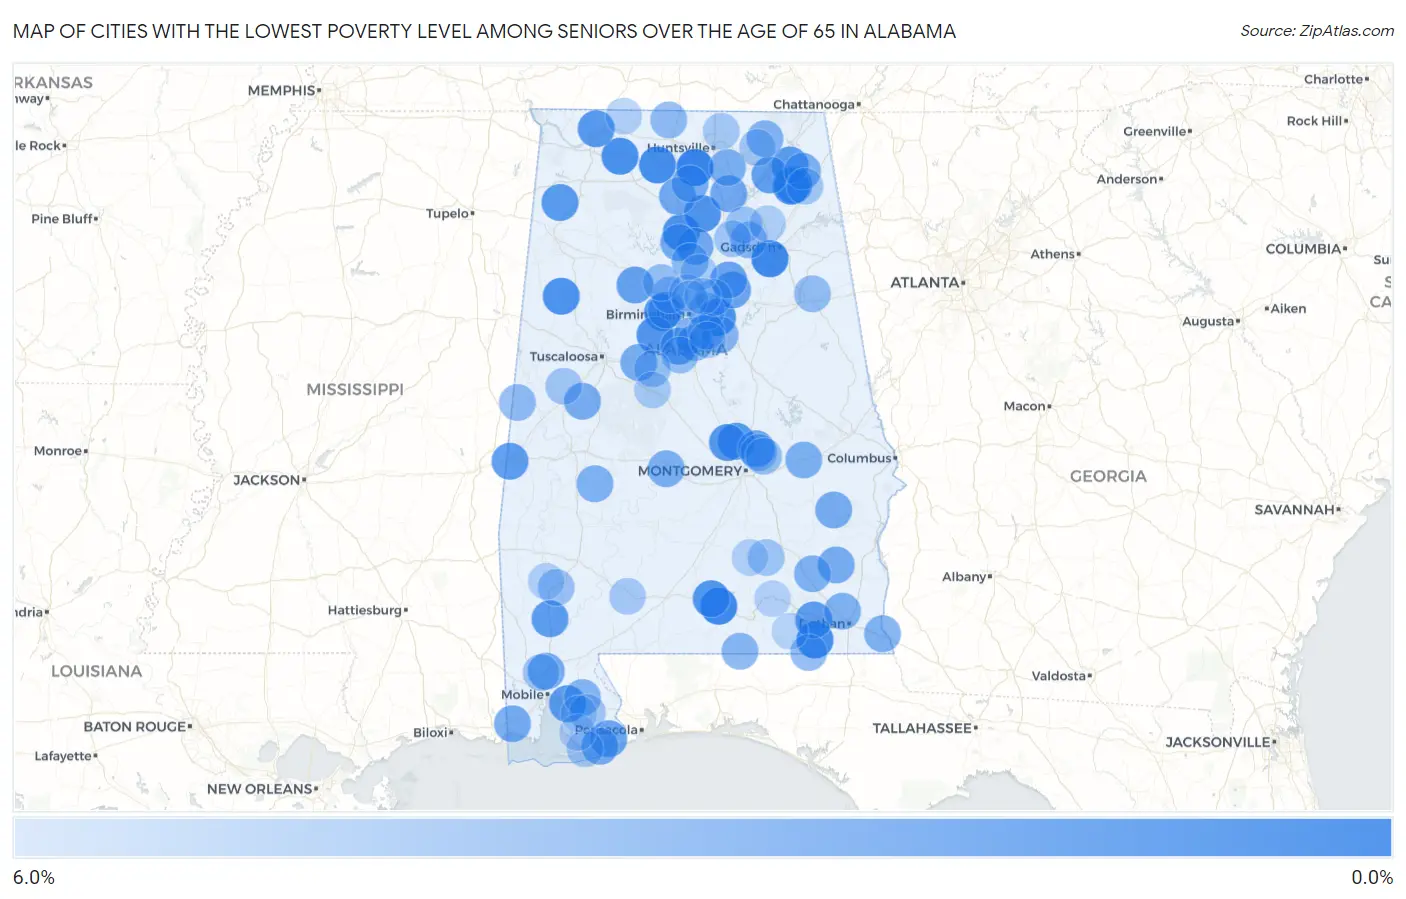
Map of Cities with the Lowest Poverty Level Among Seniors Over the Age of 65 in Alabama
6.0%
0.0%
Cities with the Lowest Poverty Level Among Seniors Over the Age of 65 in Alabama
| City | Senior Poverty | vs State | vs National | |
| 1. | Triana | 0.87% | 11.0%(-10.1)#1 | 10.0%(-9.08)#207 |
| 2. | Rainbow City | 1.2% | 11.0%(-9.81)#2 | 10.0%(-8.79)#382 |
| 3. | River Falls | 1.2% | 11.0%(-9.81)#3 | 10.0%(-8.79)#385 |
| 4. | Trinity | 1.4% | 11.0%(-9.60)#4 | 10.0%(-8.58)#559 |
| 5. | Hartford | 1.4% | 11.0%(-9.54)#5 | 10.0%(-8.52)#596 |
| 6. | Town Creek | 1.6% | 11.0%(-9.42)#6 | 10.0%(-8.40)#688 |
| 7. | Dunnavant | 1.6% | 11.0%(-9.39)#7 | 10.0%(-8.36)#712 |
| 8. | Shiloh | 1.7% | 11.0%(-9.28)#8 | 10.0%(-8.26)#810 |
| 9. | Good Hope | 1.7% | 11.0%(-9.26)#9 | 10.0%(-8.24)#830 |
| 10. | Belk | 1.7% | 11.0%(-9.25)#10 | 10.0%(-8.23)#839 |
| 11. | Sylvan Springs | 1.8% | 11.0%(-9.22)#11 | 10.0%(-8.20)#865 |
| 12. | Fyffe | 1.8% | 11.0%(-9.16)#12 | 10.0%(-8.14)#910 |
| 13. | Fairview | 1.8% | 11.0%(-9.15)#13 | 10.0%(-8.13)#916 |
| 14. | North Johns | 1.9% | 11.0%(-9.05)#14 | 10.0%(-8.03)#1,018 |
| 15. | Red Level | 2.0% | 11.0%(-9.01)#15 | 10.0%(-7.99)#1,055 |
| 16. | Deatsville | 2.1% | 11.0%(-8.90)#16 | 10.0%(-7.88)#1,156 |
| 17. | St Florian | 2.1% | 11.0%(-8.90)#17 | 10.0%(-7.88)#1,161 |
| 18. | Pine Level | 2.1% | 11.0%(-8.84)#18 | 10.0%(-7.81)#1,219 |
| 19. | Hodges | 2.2% | 11.0%(-8.80)#19 | 10.0%(-7.78)#1,245 |
| 20. | Mcintosh | 2.2% | 11.0%(-8.73)#20 | 10.0%(-7.70)#1,332 |
| 21. | Daphne | 2.3% | 11.0%(-8.72)#21 | 10.0%(-7.70)#1,339 |
| 22. | Dutton | 2.4% | 11.0%(-8.59)#22 | 10.0%(-7.57)#1,466 |
| 23. | Clayhatchee | 2.4% | 11.0%(-8.59)#23 | 10.0%(-7.57)#1,467 |
| 24. | Cuba | 2.4% | 11.0%(-8.59)#24 | 10.0%(-7.57)#1,470 |
| 25. | Langston | 2.5% | 11.0%(-8.44)#25 | 10.0%(-7.42)#1,633 |
| 26. | Parrish | 2.7% | 11.0%(-8.29)#26 | 10.0%(-7.27)#1,808 |
| 27. | Helena | 2.7% | 11.0%(-8.26)#27 | 10.0%(-7.24)#1,848 |
| 28. | Odenville | 2.8% | 11.0%(-8.15)#28 | 10.0%(-7.13)#1,953 |
| 29. | Springville | 2.8% | 11.0%(-8.15)#29 | 10.0%(-7.13)#1,954 |
| 30. | Perdido Beach | 2.9% | 11.0%(-8.12)#30 | 10.0%(-7.09)#1,998 |
| 31. | Wetumpka | 2.9% | 11.0%(-8.11)#31 | 10.0%(-7.09)#2,015 |
| 32. | Garden City | 3.0% | 11.0%(-7.99)#32 | 10.0%(-6.97)#2,161 |
| 33. | Falkville | 3.1% | 11.0%(-7.85)#33 | 10.0%(-6.83)#2,328 |
| 34. | Union Grove | 3.1% | 11.0%(-7.85)#34 | 10.0%(-6.83)#2,350 |
| 35. | Satsuma | 3.2% | 11.0%(-7.80)#35 | 10.0%(-6.77)#2,407 |
| 36. | Orange Beach | 3.2% | 11.0%(-7.73)#36 | 10.0%(-6.71)#2,497 |
| 37. | Grand Bay | 3.2% | 11.0%(-7.73)#37 | 10.0%(-6.70)#2,503 |
| 38. | Dodge City | 3.3% | 11.0%(-7.69)#38 | 10.0%(-6.67)#2,542 |
| 39. | Vance | 3.3% | 11.0%(-7.64)#39 | 10.0%(-6.62)#2,610 |
| 40. | Somerville | 3.3% | 11.0%(-7.64)#40 | 10.0%(-6.62)#2,619 |
| 41. | Midway | 3.3% | 11.0%(-7.64)#41 | 10.0%(-6.62)#2,626 |
| 42. | Akron | 3.3% | 11.0%(-7.64)#42 | 10.0%(-6.62)#2,634 |
| 43. | Blue Springs | 3.3% | 11.0%(-7.64)#43 | 10.0%(-6.62)#2,644 |
| 44. | Sylvania | 3.5% | 11.0%(-7.49)#44 | 10.0%(-6.47)#2,826 |
| 45. | Owens Cross Roads | 3.5% | 11.0%(-7.45)#45 | 10.0%(-6.43)#2,875 |
| 46. | Selmont West Selmont | 3.5% | 11.0%(-7.43)#46 | 10.0%(-6.41)#2,909 |
| 47. | Franklin | 3.6% | 11.0%(-7.37)#47 | 10.0%(-6.35)#3,015 |
| 48. | Ariton | 3.7% | 11.0%(-7.31)#48 | 10.0%(-6.29)#3,076 |
| 49. | Gordon | 3.7% | 11.0%(-7.31)#49 | 10.0%(-6.29)#3,080 |
| 50. | Napier Field | 3.7% | 11.0%(-7.27)#50 | 10.0%(-6.25)#3,140 |
| 51. | Thomaston | 3.7% | 11.0%(-7.27)#51 | 10.0%(-6.25)#3,145 |
| 52. | Maytown | 3.7% | 11.0%(-7.27)#52 | 10.0%(-6.25)#3,151 |
| 53. | Mccalla | 3.7% | 11.0%(-7.23)#53 | 10.0%(-6.21)#3,198 |
| 54. | Skyline | 3.8% | 11.0%(-7.19)#54 | 10.0%(-6.17)#3,240 |
| 55. | Loxley | 3.9% | 11.0%(-7.08)#55 | 10.0%(-6.06)#3,381 |
| 56. | Westover | 3.9% | 11.0%(-7.08)#56 | 10.0%(-6.06)#3,382 |
| 57. | Walnut Grove | 3.9% | 11.0%(-7.04)#57 | 10.0%(-6.02)#3,452 |
| 58. | Hoover | 3.9% | 11.0%(-7.02)#58 | 10.0%(-6.00)#3,472 |
| 59. | Lockhart | 4.0% | 11.0%(-6.97)#59 | 10.0%(-5.95)#3,552 |
| 60. | Hayden | 4.1% | 11.0%(-6.89)#60 | 10.0%(-5.87)#3,649 |
| 61. | Pelham | 4.1% | 11.0%(-6.86)#61 | 10.0%(-5.84)#3,699 |
| 62. | Black | 4.2% | 11.0%(-6.81)#62 | 10.0%(-5.79)#3,780 |
| 63. | Geiger | 4.3% | 11.0%(-6.70)#63 | 10.0%(-5.68)#3,924 |
| 64. | Elkmont | 4.3% | 11.0%(-6.69)#64 | 10.0%(-5.67)#3,942 |
| 65. | Irondale | 4.3% | 11.0%(-6.64)#65 | 10.0%(-5.62)#4,004 |
| 66. | Choccolocco | 4.4% | 11.0%(-6.56)#66 | 10.0%(-5.54)#4,141 |
| 67. | Blue Ridge | 4.4% | 11.0%(-6.54)#67 | 10.0%(-5.52)#4,186 |
| 68. | Graysville | 4.5% | 11.0%(-6.45)#68 | 10.0%(-5.43)#4,315 |
| 69. | Brantleyville | 4.5% | 11.0%(-6.43)#69 | 10.0%(-5.41)#4,344 |
| 70. | Redland | 4.6% | 11.0%(-6.39)#70 | 10.0%(-5.37)#4,420 |
| 71. | Sumiton | 4.6% | 11.0%(-6.36)#71 | 10.0%(-5.34)#4,456 |
| 72. | Highland Lakes | 4.6% | 11.0%(-6.34)#72 | 10.0%(-5.32)#4,478 |
| 73. | Leroy | 4.7% | 11.0%(-6.29)#73 | 10.0%(-5.27)#4,551 |
| 74. | Saraland | 4.7% | 11.0%(-6.25)#74 | 10.0%(-5.23)#4,593 |
| 75. | West Blocton | 4.8% | 11.0%(-6.21)#75 | 10.0%(-5.19)#4,629 |
| 76. | Douglas | 4.8% | 11.0%(-6.21)#76 | 10.0%(-5.19)#4,635 |
| 77. | Goshen | 4.8% | 11.0%(-6.13)#77 | 10.0%(-5.11)#4,773 |
| 78. | Trussville | 4.9% | 11.0%(-6.05)#78 | 10.0%(-5.03)#4,891 |
| 79. | Gardendale | 4.9% | 11.0%(-6.03)#79 | 10.0%(-5.01)#4,916 |
| 80. | Union | 5.0% | 11.0%(-6.02)#80 | 10.0%(-5.00)#4,937 |
| 81. | Susan Moore | 5.0% | 11.0%(-5.99)#81 | 10.0%(-4.97)#4,962 |
| 82. | Pleasant Groves | 5.0% | 11.0%(-5.97)#82 | 10.0%(-4.95)#4,990 |
| 83. | Robertsdale | 5.1% | 11.0%(-5.91)#83 | 10.0%(-4.89)#5,086 |
| 84. | Gulf Shores | 5.1% | 11.0%(-5.90)#84 | 10.0%(-4.88)#5,105 |
| 85. | Pine Ridge | 5.1% | 11.0%(-5.84)#85 | 10.0%(-4.82)#5,176 |
| 86. | Moores Mill | 5.2% | 11.0%(-5.79)#86 | 10.0%(-4.76)#5,269 |
| 87. | Excel | 5.2% | 11.0%(-5.78)#87 | 10.0%(-4.76)#5,281 |
| 88. | Centreville | 5.2% | 11.0%(-5.75)#88 | 10.0%(-4.73)#5,316 |
| 89. | County Line | 5.3% | 11.0%(-5.71)#89 | 10.0%(-4.69)#5,395 |
| 90. | Fultondale | 5.4% | 11.0%(-5.54)#90 | 10.0%(-4.52)#5,658 |
| 91. | Sardis City | 5.5% | 11.0%(-5.49)#91 | 10.0%(-4.47)#5,733 |
| 92. | Chelsea | 5.5% | 11.0%(-5.47)#92 | 10.0%(-4.45)#5,786 |
| 93. | Lexington | 5.6% | 11.0%(-5.42)#93 | 10.0%(-4.40)#5,857 |
| 94. | Luverne | 5.6% | 11.0%(-5.40)#94 | 10.0%(-4.38)#5,908 |
| 95. | St Stephens | 5.6% | 11.0%(-5.38)#95 | 10.0%(-4.36)#5,940 |
| 96. | Center Point | 5.6% | 11.0%(-5.36)#96 | 10.0%(-4.34)#5,972 |
| 97. | Elba | 5.7% | 11.0%(-5.32)#97 | 10.0%(-4.30)#6,034 |
| 98. | Magnolia Springs | 5.7% | 11.0%(-5.29)#98 | 10.0%(-4.27)#6,077 |
| 99. | Coffee Springs | 5.7% | 11.0%(-5.26)#99 | 10.0%(-4.24)#6,136 |
| 100. | Silverhill | 5.8% | 11.0%(-5.14)#100 | 10.0%(-4.12)#6,326 |
Common Questions
What are the Top 10 Cities with the Lowest Poverty Level Among Seniors Over the Age of 65 in Alabama?
Top 10 Cities with the Lowest Poverty Level Among Seniors Over the Age of 65 in Alabama are:
#1
0.87%
#2
1.2%
#3
1.2%
#4
1.4%
#5
1.4%
#6
1.6%
#7
1.6%
#8
1.7%
#9
1.7%
#10
1.7%
What city has the Lowest Poverty Level Among Seniors Over the Age of 65 in Alabama?
Triana has the Lowest Poverty Level Among Seniors Over the Age of 65 in Alabama with 0.87%.
What is the Poverty Level Among Seniors Over the Age of 65 in the State of Alabama?
Poverty Level Among Seniors Over the Age of 65 in Alabama is 11.0%.
What is the Poverty Level Among Seniors Over the Age of 65 in the United States?
Poverty Level Among Seniors Over the Age of 65 in the United States is 10.0%.