Lake Don Pedro, CA Map & Demographics
Lake Don Pedro Map
Lake Don Pedro Overview
$50,136
PER CAPITA INCOME
$105,417
AVG FAMILY INCOME
$87,955
AVG HOUSEHOLD INCOME
14.5%
WAGE / INCOME GAP [ % ]
85.5¢/ $1
WAGE / INCOME GAP [ $ ]
0.37
INEQUALITY / GINI INDEX
1,215
TOTAL POPULATION
563
MALE POPULATION
652
FEMALE POPULATION
86.35
MALES / 100 FEMALES
115.81
FEMALES / 100 MALES
59.4
MEDIAN AGE
2.2
AVG FAMILY SIZE
2.0
AVG HOUSEHOLD SIZE
541
LABOR FORCE [ PEOPLE ]
48.4%
PERCENT IN LABOR FORCE
3.5%
UNEMPLOYMENT RATE
Income in Lake Don Pedro
Income Overview in Lake Don Pedro
Per Capita Income in Lake Don Pedro is $50,136, while median incomes of families and households are $105,417 and $87,955 respectively.
| Characteristic | Number | Measure |
| Per Capita Income | 1,215 | $50,136 |
| Median Family Income | 496 | $105,417 |
| Mean Family Income | 496 | $118,139 |
| Median Household Income | 600 | $87,955 |
| Mean Household Income | 600 | $104,907 |
| Income Deficit | 496 | $0 |
| Wage / Income Gap (%) | 1,215 | 14.52% |
| Wage / Income Gap ($) | 1,215 | 85.48¢ per $1 |
| Gini / Inequality Index | 1,215 | 0.37 |
Earnings by Sex in Lake Don Pedro
Average Earnings in Lake Don Pedro are $50,000, $51,316 for men and $43,864 for women, a difference of 14.5%.
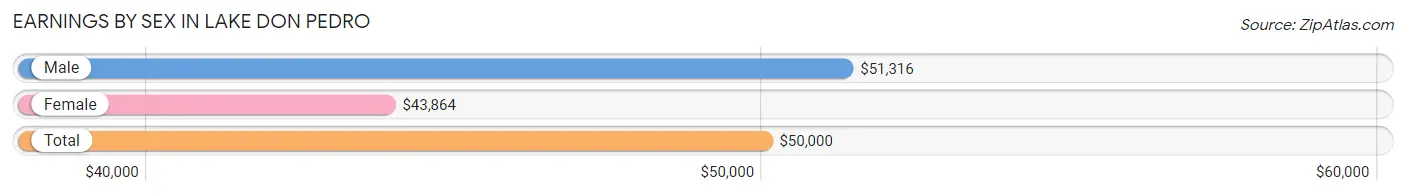
| Sex | Number | Average Earnings |
| Male | 338 (57.9%) | $51,316 |
| Female | 246 (42.1%) | $43,864 |
| Total | 584 (100.0%) | $50,000 |
Earnings by Sex by Income Bracket in Lake Don Pedro
The most common earnings brackets in Lake Don Pedro are $100,000+ for men (100 | 29.6%) and $100,000+ for women (40 | 16.3%).
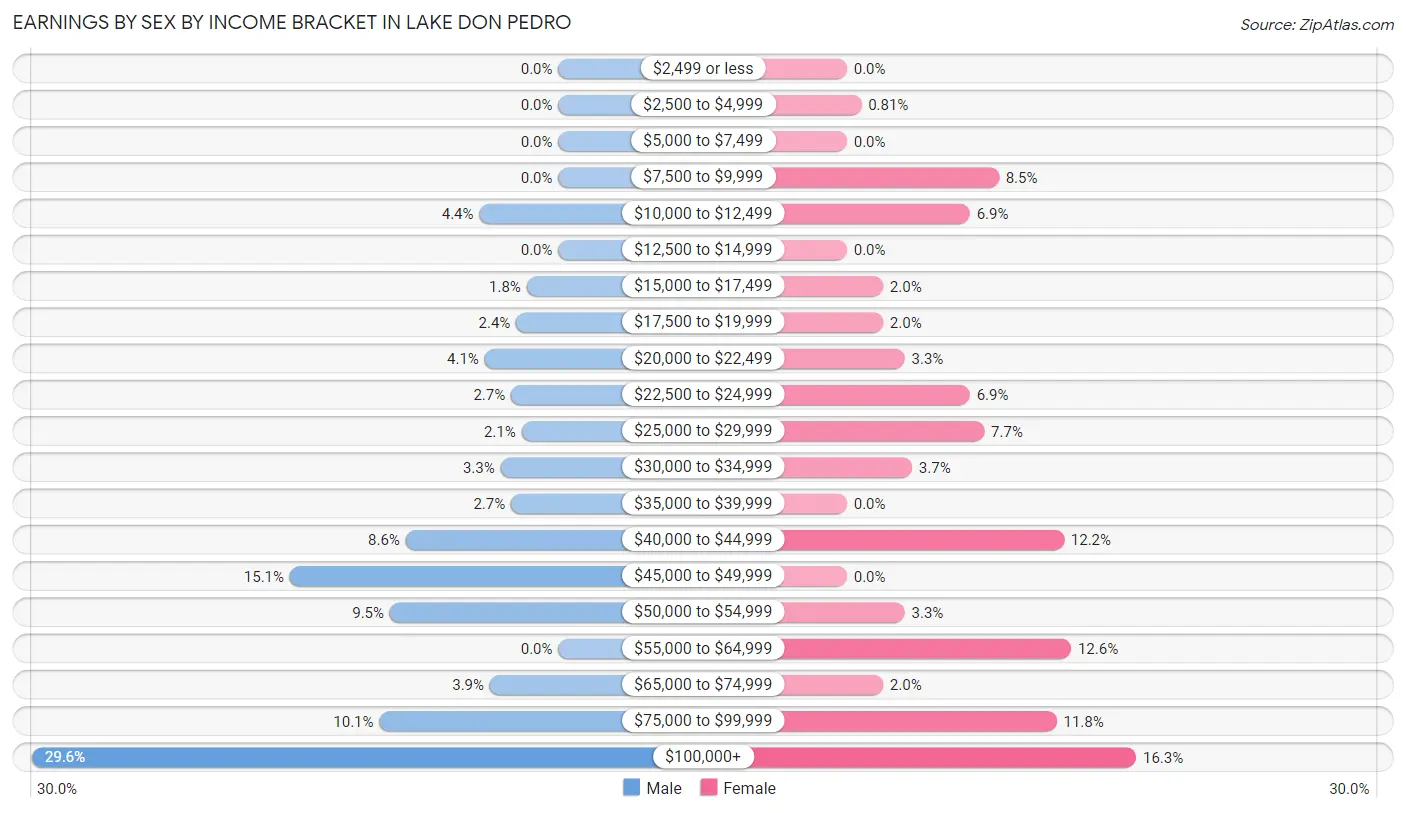
| Income | Male | Female |
| $2,499 or less | 0 (0.0%) | 0 (0.0%) |
| $2,500 to $4,999 | 0 (0.0%) | 2 (0.8%) |
| $5,000 to $7,499 | 0 (0.0%) | 0 (0.0%) |
| $7,500 to $9,999 | 0 (0.0%) | 21 (8.5%) |
| $10,000 to $12,499 | 15 (4.4%) | 17 (6.9%) |
| $12,500 to $14,999 | 0 (0.0%) | 0 (0.0%) |
| $15,000 to $17,499 | 6 (1.8%) | 5 (2.0%) |
| $17,500 to $19,999 | 8 (2.4%) | 5 (2.0%) |
| $20,000 to $22,499 | 14 (4.1%) | 8 (3.3%) |
| $22,500 to $24,999 | 9 (2.7%) | 17 (6.9%) |
| $25,000 to $29,999 | 7 (2.1%) | 19 (7.7%) |
| $30,000 to $34,999 | 11 (3.3%) | 9 (3.7%) |
| $35,000 to $39,999 | 9 (2.7%) | 0 (0.0%) |
| $40,000 to $44,999 | 29 (8.6%) | 30 (12.2%) |
| $45,000 to $49,999 | 51 (15.1%) | 0 (0.0%) |
| $50,000 to $54,999 | 32 (9.5%) | 8 (3.3%) |
| $55,000 to $64,999 | 0 (0.0%) | 31 (12.6%) |
| $65,000 to $74,999 | 13 (3.8%) | 5 (2.0%) |
| $75,000 to $99,999 | 34 (10.1%) | 29 (11.8%) |
| $100,000+ | 100 (29.6%) | 40 (16.3%) |
| Total | 338 (100.0%) | 246 (100.0%) |
Earnings by Sex by Educational Attainment in Lake Don Pedro
Average earnings in Lake Don Pedro are $51,316 for men and $44,091 for women, a difference of 14.1%. Men with an educational attainment of bachelor's degree enjoy the highest average annual earnings of $150,800, while those with high school diploma education earn the least with $39,861. Women with an educational attainment of college or associate's degree earn the most with the average annual earnings of $43,807, while those with high school diploma education have the smallest earnings of $32,917.
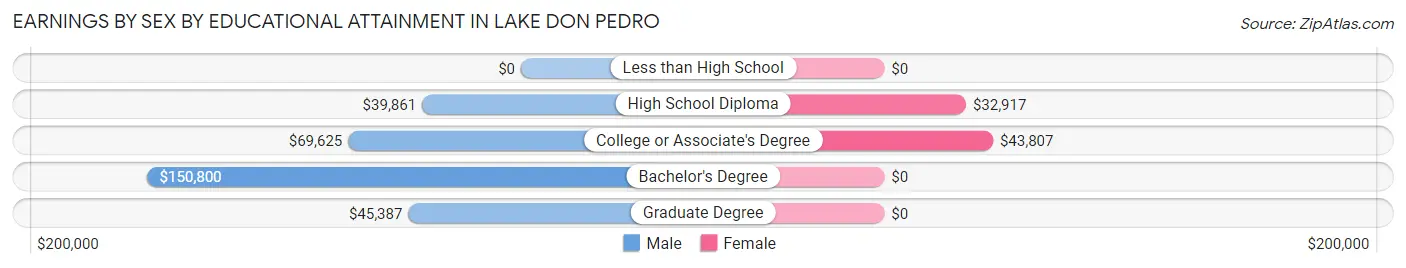
| Educational Attainment | Male Income | Female Income |
| Less than High School | - | - |
| High School Diploma | $39,861 | $32,917 |
| College or Associate's Degree | $69,625 | $43,807 |
| Bachelor's Degree | $150,800 | $0 |
| Graduate Degree | $45,387 | $0 |
| Total | $51,316 | $44,091 |
Family Income in Lake Don Pedro
Family Income Brackets in Lake Don Pedro
According to the Lake Don Pedro family income data, there are 121 families falling into the $100,000 to $149,999 income range, which is the most common income bracket and makes up 24.4% of all families.
| Income Bracket | # Families | % Families |
| Less than $10,000 | 9 | 1.8% |
| $10,000 to $14,999 | 0 | 0.0% |
| $15,000 to $24,999 | 16 | 3.2% |
| $25,000 to $34,999 | 8 | 1.6% |
| $35,000 to $49,999 | 34 | 6.9% |
| $50,000 to $74,999 | 97 | 19.6% |
| $75,000 to $99,999 | 58 | 11.7% |
| $100,000 to $149,999 | 121 | 24.4% |
| $150,000 to $199,999 | 110 | 22.2% |
| $200,000+ | 43 | 8.7% |
Family Income by Famaliy Size in Lake Don Pedro
4-person families (26 | 5.2%) account for the highest median family income in Lake Don Pedro with $185,333 per family, while 2-person families (384 | 77.4%) have the highest median income of $52,102 per family member.
| Income Bracket | # Families | Median Income |
| 2-Person Families | 384 (77.4%) | $104,205 |
| 3-Person Families | 78 (15.7%) | $89,773 |
| 4-Person Families | 26 (5.2%) | $185,333 |
| 5-Person Families | 0 (0.0%) | $0 |
| 6-Person Families | 8 (1.6%) | $0 |
| 7+ Person Families | 0 (0.0%) | $0 |
| Total | 496 (100.0%) | $105,417 |
Family Income by Number of Earners in Lake Don Pedro
| Number of Earners | # Families | Median Income |
| No Earners | 109 (22.0%) | $52,434 |
| 1 Earner | 228 (46.0%) | $109,063 |
| 2 Earners | 136 (27.4%) | $135,357 |
| 3+ Earners | 23 (4.6%) | $0 |
| Total | 496 (100.0%) | $105,417 |
Household Income in Lake Don Pedro
Household Income Brackets in Lake Don Pedro
With 117 households falling in the category, the $150,000 to $199,999 income range is the most frequent in Lake Don Pedro, accounting for 19.5% of all households.
| Income Bracket | # Households | % Households |
| Less than $10,000 | 9 | 1.5% |
| $10,000 to $14,999 | 0 | 0.0% |
| $15,000 to $24,999 | 35 | 5.8% |
| $25,000 to $34,999 | 30 | 5.0% |
| $35,000 to $49,999 | 85 | 14.2% |
| $50,000 to $74,999 | 109 | 18.2% |
| $75,000 to $99,999 | 58 | 9.7% |
| $100,000 to $149,999 | 114 | 19.0% |
| $150,000 to $199,999 | 117 | 19.5% |
| $200,000+ | 43 | 7.2% |
Household Income by Householder Age in Lake Don Pedro
The median household income in Lake Don Pedro is $87,955, with the highest median household income of $106,838 found in the 45 to 64 years age bracket for the primary householder. A total of 343 households (57.2%) fall into this category. Meanwhile, the 15 to 24 years age bracket for the primary householder has the lowest median household income of $0, with 24 households (4.0%) in this group.
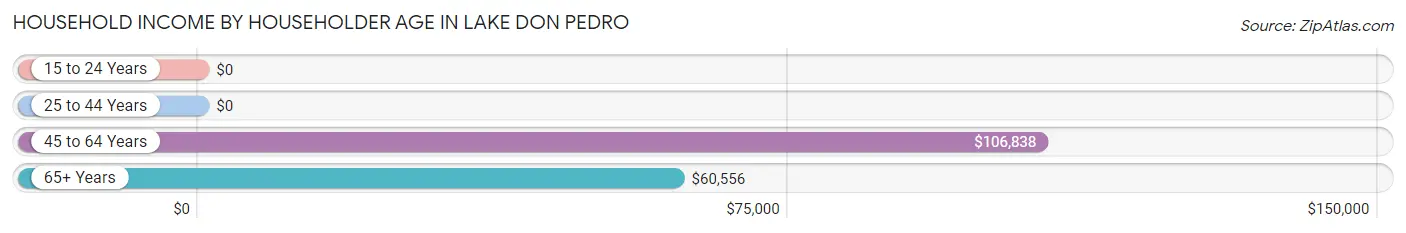
| Income Bracket | # Households | Median Income |
| 15 to 24 Years | 24 (4.0%) | $0 |
| 25 to 44 Years | 33 (5.5%) | $0 |
| 45 to 64 Years | 343 (57.2%) | $106,838 |
| 65+ Years | 200 (33.3%) | $60,556 |
| Total | 600 (100.0%) | $87,955 |
Poverty in Lake Don Pedro
Income Below Poverty by Sex and Age in Lake Don Pedro
With 1.9% poverty level for males and 1.4% for females among the residents of Lake Don Pedro, 75 year old and over males and 45 to 54 year old females are the most vulnerable to poverty, with 11 males (18.0%) and 9 females (16.4%) in their respective age groups living below the poverty level.
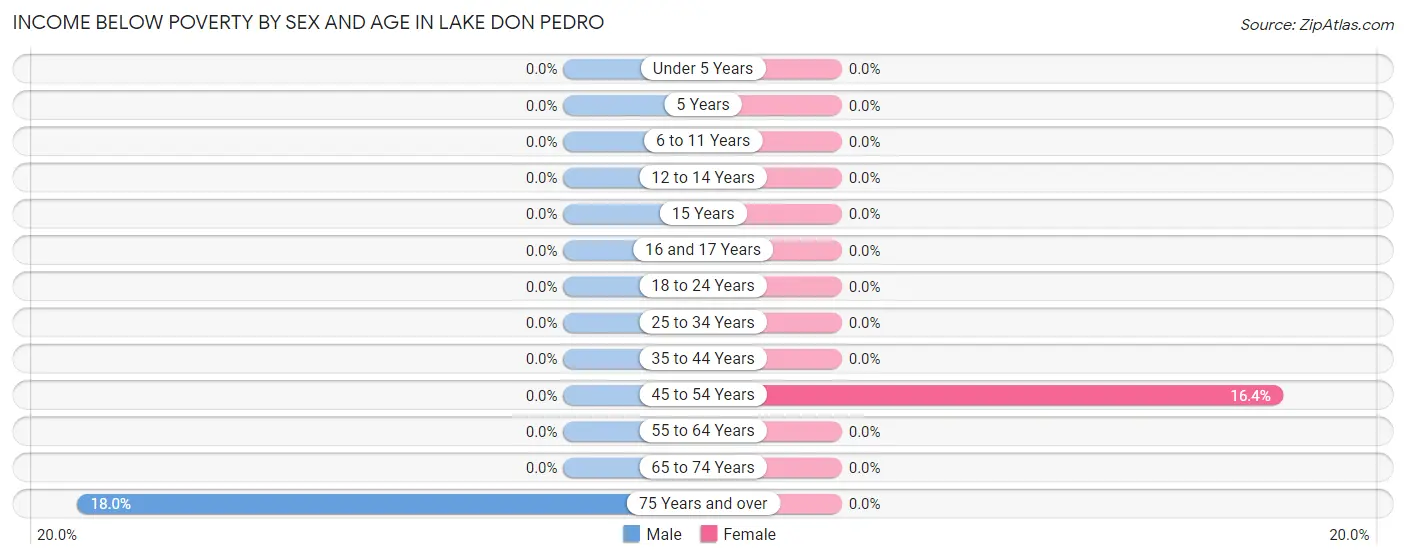
| Age Bracket | Male | Female |
| Under 5 Years | 0 (0.0%) | 0 (0.0%) |
| 5 Years | 0 (0.0%) | 0 (0.0%) |
| 6 to 11 Years | 0 (0.0%) | 0 (0.0%) |
| 12 to 14 Years | 0 (0.0%) | 0 (0.0%) |
| 15 Years | 0 (0.0%) | 0 (0.0%) |
| 16 and 17 Years | 0 (0.0%) | 0 (0.0%) |
| 18 to 24 Years | 0 (0.0%) | 0 (0.0%) |
| 25 to 34 Years | 0 (0.0%) | 0 (0.0%) |
| 35 to 44 Years | 0 (0.0%) | 0 (0.0%) |
| 45 to 54 Years | 0 (0.0%) | 9 (16.4%) |
| 55 to 64 Years | 0 (0.0%) | 0 (0.0%) |
| 65 to 74 Years | 0 (0.0%) | 0 (0.0%) |
| 75 Years and over | 11 (18.0%) | 0 (0.0%) |
| Total | 11 (1.9%) | 9 (1.4%) |
Income Above Poverty by Sex and Age in Lake Don Pedro
According to the poverty statistics in Lake Don Pedro, males aged under 5 years and females aged 6 to 11 years are the age groups that are most secure financially, with 100.0% of males and 100.0% of females in these age groups living above the poverty line.
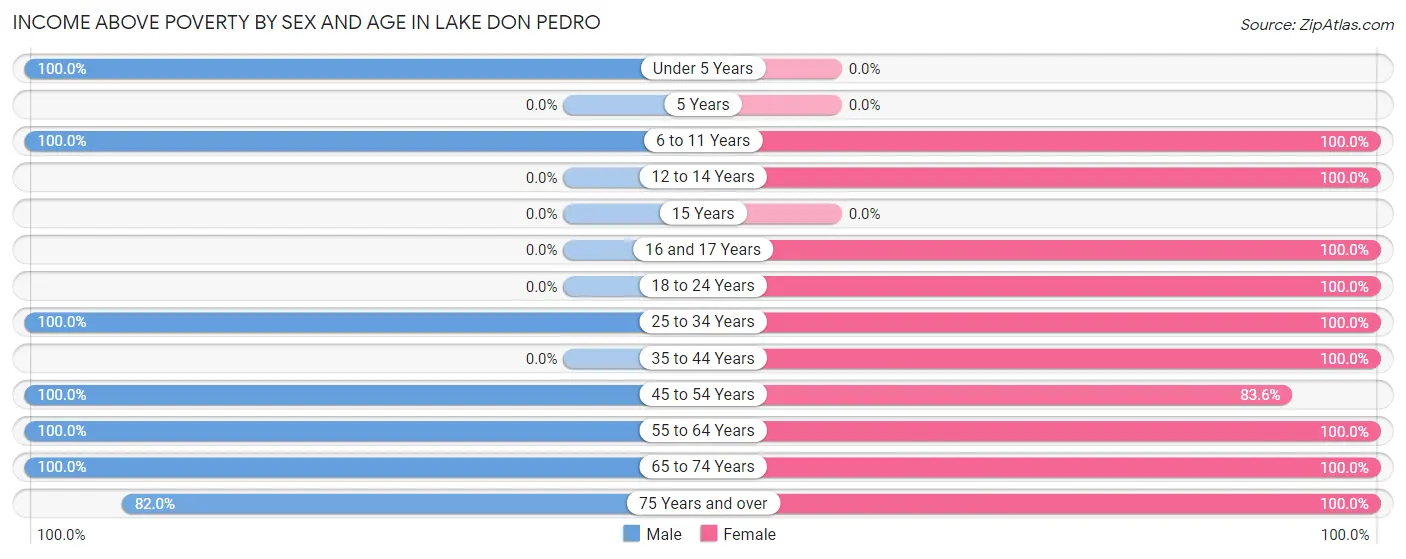
| Age Bracket | Male | Female |
| Under 5 Years | 15 (100.0%) | 0 (0.0%) |
| 5 Years | 0 (0.0%) | 0 (0.0%) |
| 6 to 11 Years | 22 (100.0%) | 36 (100.0%) |
| 12 to 14 Years | 0 (0.0%) | 25 (100.0%) |
| 15 Years | 0 (0.0%) | 0 (0.0%) |
| 16 and 17 Years | 0 (0.0%) | 21 (100.0%) |
| 18 to 24 Years | 0 (0.0%) | 31 (100.0%) |
| 25 to 34 Years | 18 (100.0%) | 22 (100.0%) |
| 35 to 44 Years | 0 (0.0%) | 28 (100.0%) |
| 45 to 54 Years | 73 (100.0%) | 46 (83.6%) |
| 55 to 64 Years | 258 (100.0%) | 209 (100.0%) |
| 65 to 74 Years | 116 (100.0%) | 141 (100.0%) |
| 75 Years and over | 50 (82.0%) | 84 (100.0%) |
| Total | 552 (98.1%) | 643 (98.6%) |
Income Below Poverty Among Married-Couple Families in Lake Don Pedro
The poverty statistics for married-couple families in Lake Don Pedro show that 2.0% or 9 of the total 456 families live below the poverty line. Families with no children have the highest poverty rate of 2.3%, comprising of 9 families. On the other hand, families with 1 or 2 children have the lowest poverty rate of 0.0%, which includes 0 families.
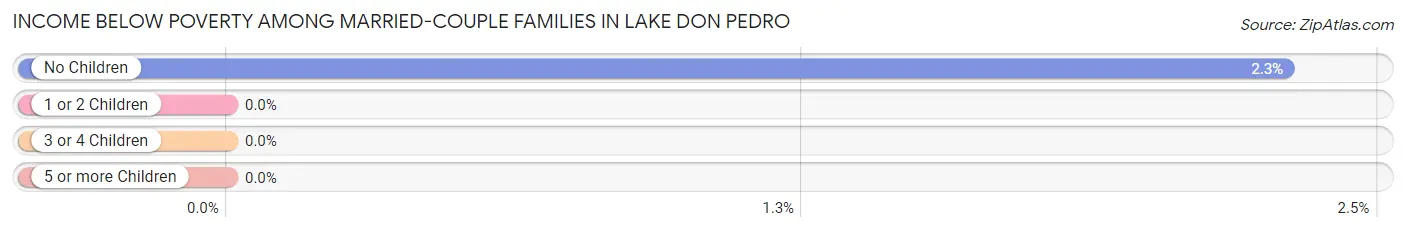
| Children | Above Poverty | Below Poverty |
| No Children | 383 (97.7%) | 9 (2.3%) |
| 1 or 2 Children | 64 (100.0%) | 0 (0.0%) |
| 3 or 4 Children | 0 (0.0%) | 0 (0.0%) |
| 5 or more Children | 0 (0.0%) | 0 (0.0%) |
| Total | 447 (98.0%) | 9 (2.0%) |
Income Below Poverty Among Single-Parent Households in Lake Don Pedro
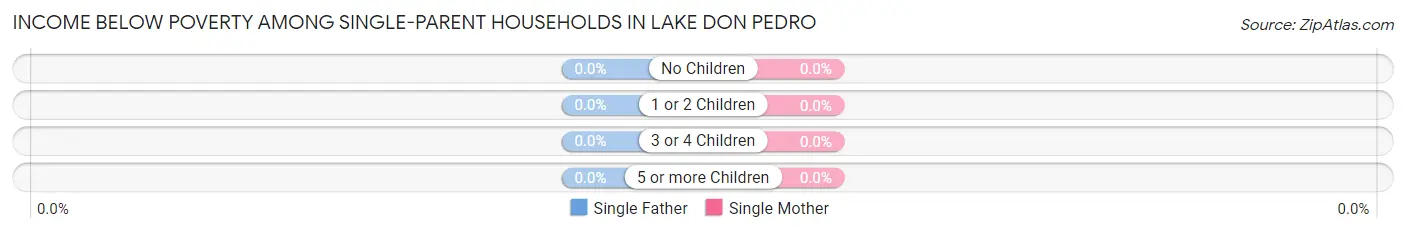
| Children | Single Father | Single Mother |
| No Children | 0 (0.0%) | 0 (0.0%) |
| 1 or 2 Children | 0 (0.0%) | 0 (0.0%) |
| 3 or 4 Children | 0 (0.0%) | 0 (0.0%) |
| 5 or more Children | 0 (0.0%) | 0 (0.0%) |
| Total | 0 (0.0%) | 0 (0.0%) |
Income Below Poverty Among Married-Couple vs Single-Parent Households in Lake Don Pedro
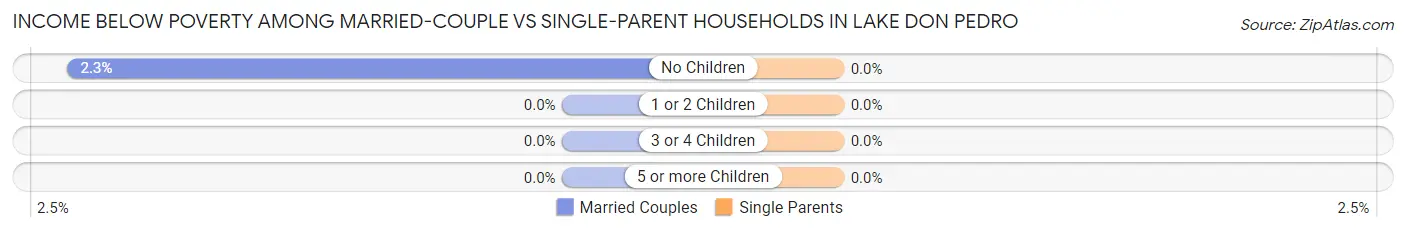
| Children | Married-Couple Families | Single-Parent Households |
| No Children | 9 (2.3%) | 0 (0.0%) |
| 1 or 2 Children | 0 (0.0%) | 0 (0.0%) |
| 3 or 4 Children | 0 (0.0%) | 0 (0.0%) |
| 5 or more Children | 0 (0.0%) | 0 (0.0%) |
| Total | 9 (2.0%) | 0 (0.0%) |
Race in Lake Don Pedro
The most populous races in Lake Don Pedro are White / Caucasian (970 | 79.8%), Hispanic or Latino (255 | 21.0%), and Two or more Races (133 | 11.0%).
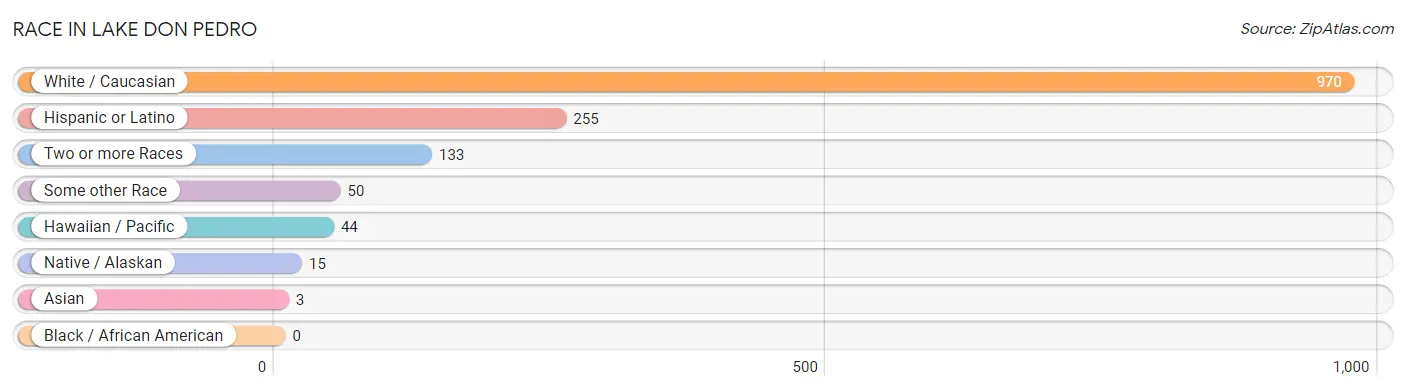
| Race | # Population | % Population |
| Asian | 3 | 0.3% |
| Black / African American | 0 | 0.0% |
| Hawaiian / Pacific | 44 | 3.6% |
| Hispanic or Latino | 255 | 21.0% |
| Native / Alaskan | 15 | 1.2% |
| White / Caucasian | 970 | 79.8% |
| Two or more Races | 133 | 11.0% |
| Some other Race | 50 | 4.1% |
| Total | 1,215 | 100.0% |
Ancestry in Lake Don Pedro
The most populous ancestries reported in Lake Don Pedro are Irish (306 | 25.2%), Mexican (202 | 16.6%), English (179 | 14.7%), German (162 | 13.3%), and Portuguese (70 | 5.8%), together accounting for 75.6% of all Lake Don Pedro residents.
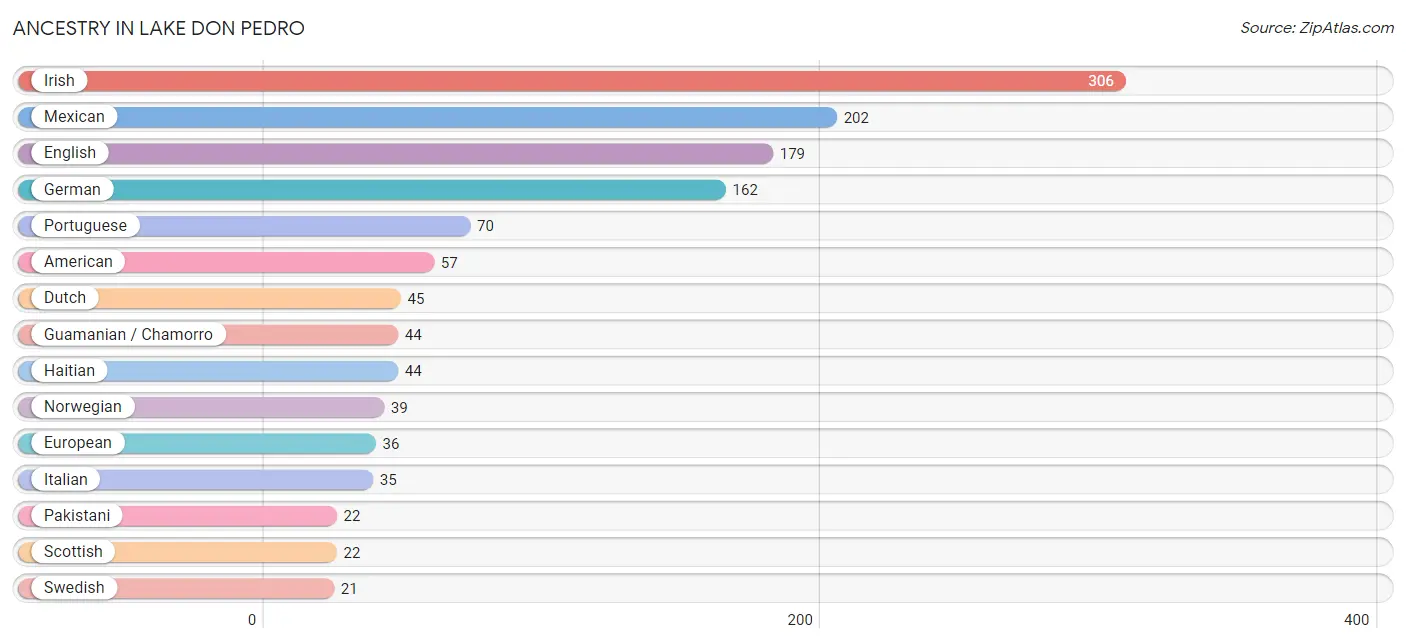
| Ancestry | # Population | % Population |
| American | 57 | 4.7% |
| Apache | 15 | 1.2% |
| Arab | 15 | 1.2% |
| Central American | 17 | 1.4% |
| Cherokee | 19 | 1.6% |
| Cuban | 6 | 0.5% |
| Dutch | 45 | 3.7% |
| Dutch West Indian | 12 | 1.0% |
| English | 179 | 14.7% |
| European | 36 | 3.0% |
| French Canadian | 4 | 0.3% |
| German | 162 | 13.3% |
| Guamanian / Chamorro | 44 | 3.6% |
| Haitian | 44 | 3.6% |
| Indian (Asian) | 7 | 0.6% |
| Irish | 306 | 25.2% |
| Italian | 35 | 2.9% |
| Korean | 3 | 0.3% |
| Mexican | 202 | 16.6% |
| Navajo | 15 | 1.2% |
| Nicaraguan | 17 | 1.4% |
| Northern European | 7 | 0.6% |
| Norwegian | 39 | 3.2% |
| Pakistani | 22 | 1.8% |
| Pennsylvania German | 8 | 0.7% |
| Polish | 7 | 0.6% |
| Portuguese | 70 | 5.8% |
| Puerto Rican | 3 | 0.3% |
| Scotch-Irish | 11 | 0.9% |
| Scottish | 22 | 1.8% |
| Sioux | 7 | 0.6% |
| Swedish | 21 | 1.7% |
| Welsh | 7 | 0.6% | View All 33 Rows |
Immigrants in Lake Don Pedro
The most numerous immigrant groups reported in Lake Don Pedro came from Latin America (39 | 3.2%), Central America (33 | 2.7%), Mexico (33 | 2.7%), Europe (24 | 2.0%), and Northern Europe (24 | 2.0%), together accounting for 12.6% of all Lake Don Pedro residents.
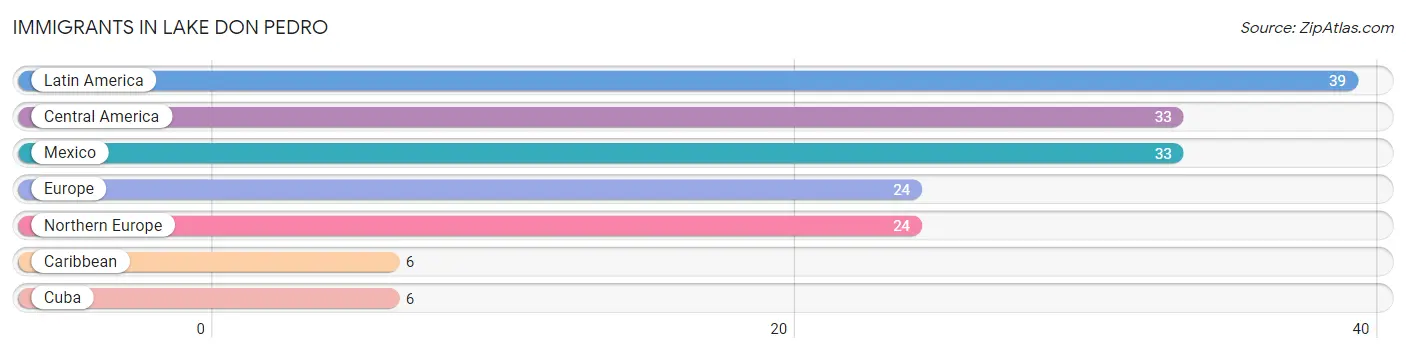
| Immigration Origin | # Population | % Population |
| Caribbean | 6 | 0.5% |
| Central America | 33 | 2.7% |
| Cuba | 6 | 0.5% |
| Europe | 24 | 2.0% |
| Latin America | 39 | 3.2% |
| Mexico | 33 | 2.7% |
| Northern Europe | 24 | 2.0% | View All 7 Rows |
Sex and Age in Lake Don Pedro
Sex and Age in Lake Don Pedro
The most populous age groups in Lake Don Pedro are 55 to 59 Years (186 | 33.0%) for men and 55 to 59 Years (146 | 22.4%) for women.
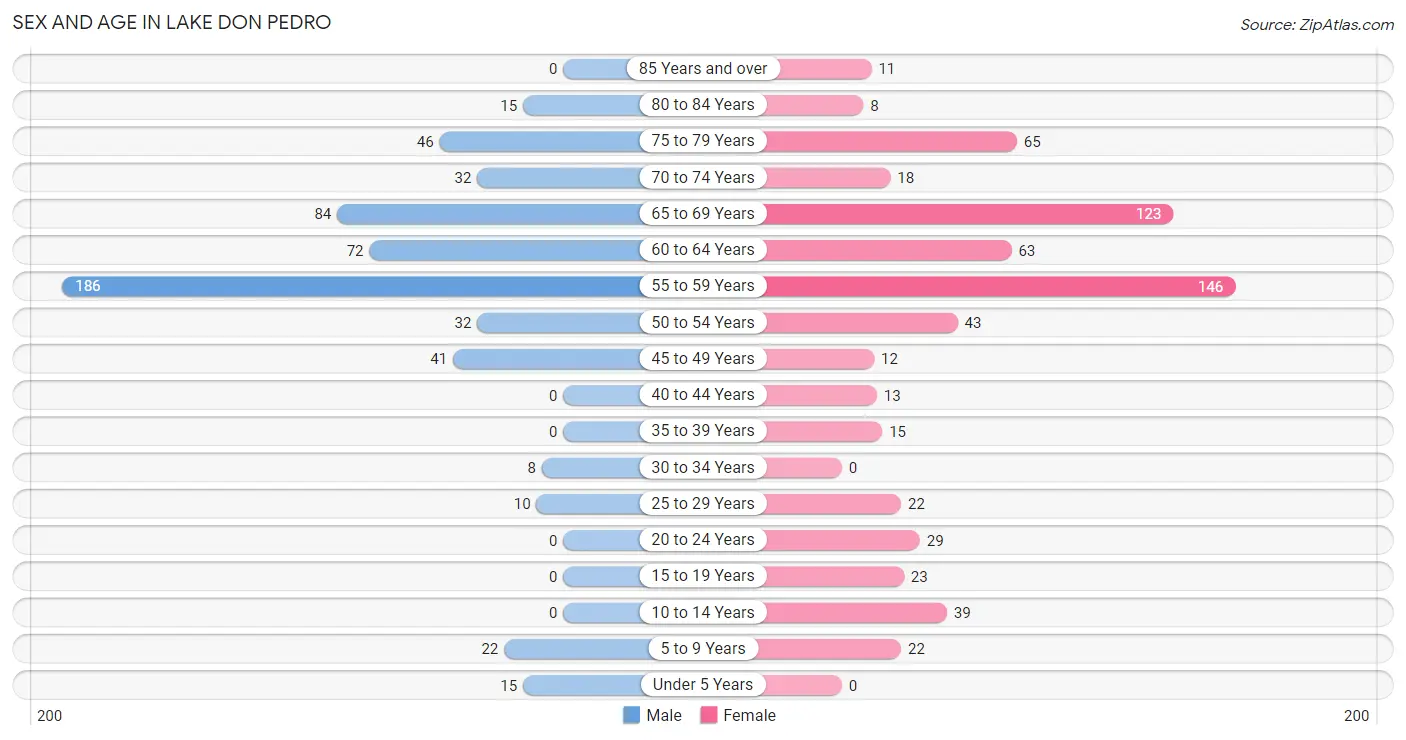
| Age Bracket | Male | Female |
| Under 5 Years | 15 (2.7%) | 0 (0.0%) |
| 5 to 9 Years | 22 (3.9%) | 22 (3.4%) |
| 10 to 14 Years | 0 (0.0%) | 39 (6.0%) |
| 15 to 19 Years | 0 (0.0%) | 23 (3.5%) |
| 20 to 24 Years | 0 (0.0%) | 29 (4.4%) |
| 25 to 29 Years | 10 (1.8%) | 22 (3.4%) |
| 30 to 34 Years | 8 (1.4%) | 0 (0.0%) |
| 35 to 39 Years | 0 (0.0%) | 15 (2.3%) |
| 40 to 44 Years | 0 (0.0%) | 13 (2.0%) |
| 45 to 49 Years | 41 (7.3%) | 12 (1.8%) |
| 50 to 54 Years | 32 (5.7%) | 43 (6.6%) |
| 55 to 59 Years | 186 (33.0%) | 146 (22.4%) |
| 60 to 64 Years | 72 (12.8%) | 63 (9.7%) |
| 65 to 69 Years | 84 (14.9%) | 123 (18.9%) |
| 70 to 74 Years | 32 (5.7%) | 18 (2.8%) |
| 75 to 79 Years | 46 (8.2%) | 65 (10.0%) |
| 80 to 84 Years | 15 (2.7%) | 8 (1.2%) |
| 85 Years and over | 0 (0.0%) | 11 (1.7%) |
| Total | 563 (100.0%) | 652 (100.0%) |
Families and Households in Lake Don Pedro
Median Family Size in Lake Don Pedro
The median family size in Lake Don Pedro is 2.22 persons per family, with single male/father families (7 | 1.4%) accounting for the largest median family size of 4.29 persons per family. On the other hand, single female/mother families (33 | 6.7%) represent the smallest median family size with 1.64 persons per family.
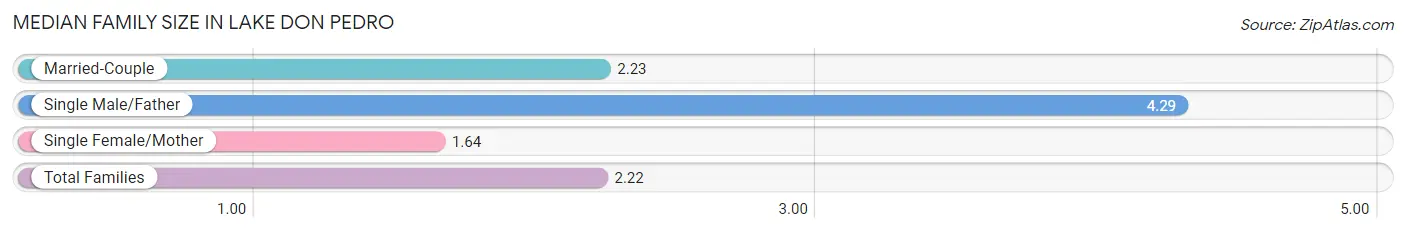
| Family Type | # Families | Family Size |
| Married-Couple | 456 (91.9%) | 2.23 |
| Single Male/Father | 7 (1.4%) | 4.29 |
| Single Female/Mother | 33 (6.7%) | 1.64 |
| Total Families | 496 (100.0%) | 2.22 |
Median Household Size in Lake Don Pedro
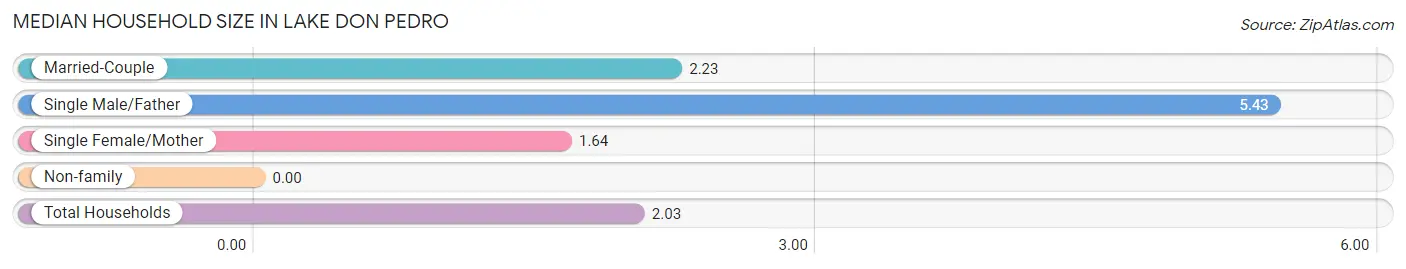
| Household Type | # Households | Household Size |
| Married-Couple | 456 (76.0%) | 2.23 |
| Single Male/Father | 7 (1.2%) | 5.43 |
| Single Female/Mother | 33 (5.5%) | 1.64 |
| Non-family | 104 (17.3%) | - |
| Total Households | 600 (100.0%) | 2.03 |
Household Size by Marriage Status in Lake Don Pedro
Out of a total of 600 households in Lake Don Pedro, 496 (82.7%) are family households, while 104 (17.3%) are nonfamily households. The most numerous type of family households are 2-person households, comprising 384, and the most common type of nonfamily households are 1-person households, comprising 104.
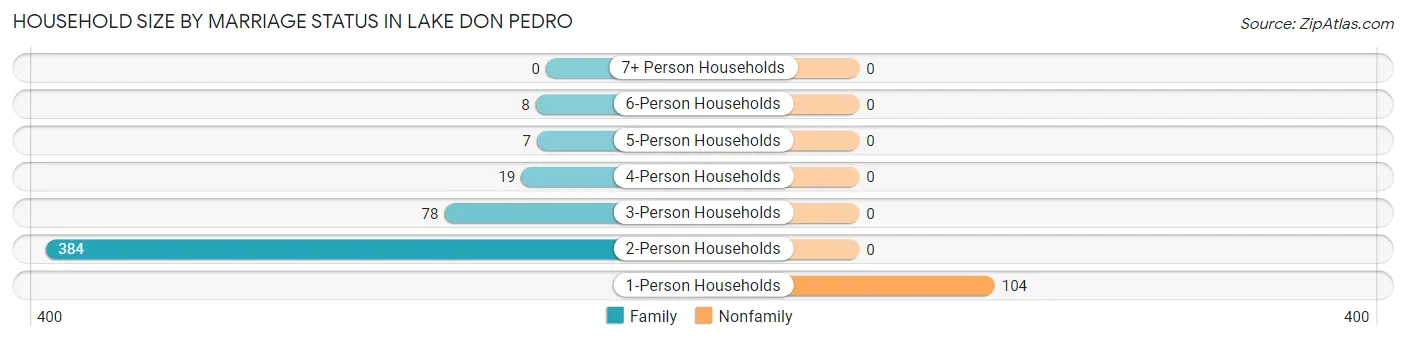
| Household Size | Family Households | Nonfamily Households |
| 1-Person Households | - | 104 (17.3%) |
| 2-Person Households | 384 (64.0%) | 0 (0.0%) |
| 3-Person Households | 78 (13.0%) | 0 (0.0%) |
| 4-Person Households | 19 (3.2%) | 0 (0.0%) |
| 5-Person Households | 7 (1.2%) | 0 (0.0%) |
| 6-Person Households | 8 (1.3%) | 0 (0.0%) |
| 7+ Person Households | 0 (0.0%) | 0 (0.0%) |
| Total | 496 (82.7%) | 104 (17.3%) |
Female Fertility in Lake Don Pedro
Fertility by Age in Lake Don Pedro
| Age Bracket | Women with Births | Births / 1,000 Women |
| 15 to 19 years | 0 (0.0%) | 0.0 |
| 20 to 34 years | 0 (0.0%) | 0.0 |
| 35 to 50 years | 0 (0.0%) | 0.0 |
| Total | 0 (0.0%) | 0.0 |
Fertility by Age by Marriage Status in Lake Don Pedro
| Age Bracket | Married | Unmarried |
| 15 to 19 years | 0 (0.0%) | 0 (0.0%) |
| 20 to 34 years | 0 (0.0%) | 0 (0.0%) |
| 35 to 50 years | 0 (0.0%) | 0 (0.0%) |
| Total | 0 (0.0%) | 0 (0.0%) |
Fertility by Education in Lake Don Pedro
| Educational Attainment | Women with Births | Births / 1,000 Women |
| Less than High School | 0 (0.0%) | 0.0 |
| High School Diploma | 0 (0.0%) | 0.0 |
| College or Associate's Degree | 0 (0.0%) | 0.0 |
| Bachelor's Degree | 0 (0.0%) | 0.0 |
| Graduate Degree | 0 (0.0%) | 0.0 |
| Total | 0 (0.0%) | 0.0 |
Fertility by Education by Marriage Status in Lake Don Pedro
| Educational Attainment | Married | Unmarried |
| Less than High School | 0 (0.0%) | 0 (0.0%) |
| High School Diploma | 0 (0.0%) | 0 (0.0%) |
| College or Associate's Degree | 0 (0.0%) | 0 (0.0%) |
| Bachelor's Degree | 0 (0.0%) | 0 (0.0%) |
| Graduate Degree | 0 (0.0%) | 0 (0.0%) |
| Total | 0 (0.0%) | 0 (0.0%) |
Employment Characteristics in Lake Don Pedro
Employment by Class of Employer in Lake Don Pedro
Among the 509 employed individuals in Lake Don Pedro, private company employees (228 | 44.8%), not-for-profit organizations (119 | 23.4%), and local government employees (69 | 13.6%) make up the most common classes of employment.
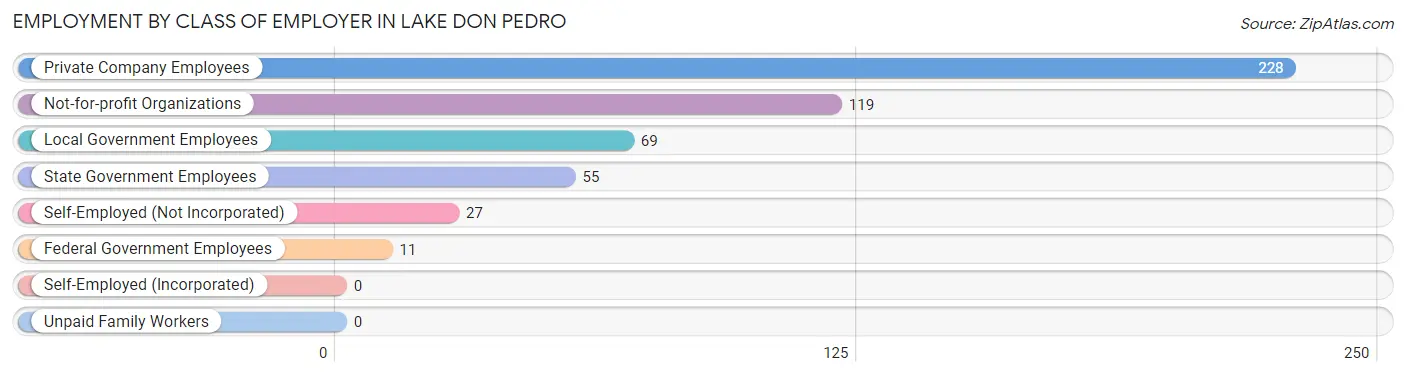
| Employer Class | # Employees | % Employees |
| Private Company Employees | 228 | 44.8% |
| Self-Employed (Incorporated) | 0 | 0.0% |
| Self-Employed (Not Incorporated) | 27 | 5.3% |
| Not-for-profit Organizations | 119 | 23.4% |
| Local Government Employees | 69 | 13.6% |
| State Government Employees | 55 | 10.8% |
| Federal Government Employees | 11 | 2.2% |
| Unpaid Family Workers | 0 | 0.0% |
| Total | 509 | 100.0% |
Employment Status by Age in Lake Don Pedro
According to the labor force statistics for Lake Don Pedro, out of the total population over 16 years of age (1,117), 48.4% or 541 individuals are in the labor force, with 3.5% or 19 of them unemployed. The age group with the highest labor force participation rate is 20 to 24 years, with 100.0% or 29 individuals in the labor force. Within the labor force, the 16 to 19 years age range has the highest percentage of unemployed individuals, with 100.0% or 2 of them being unemployed.
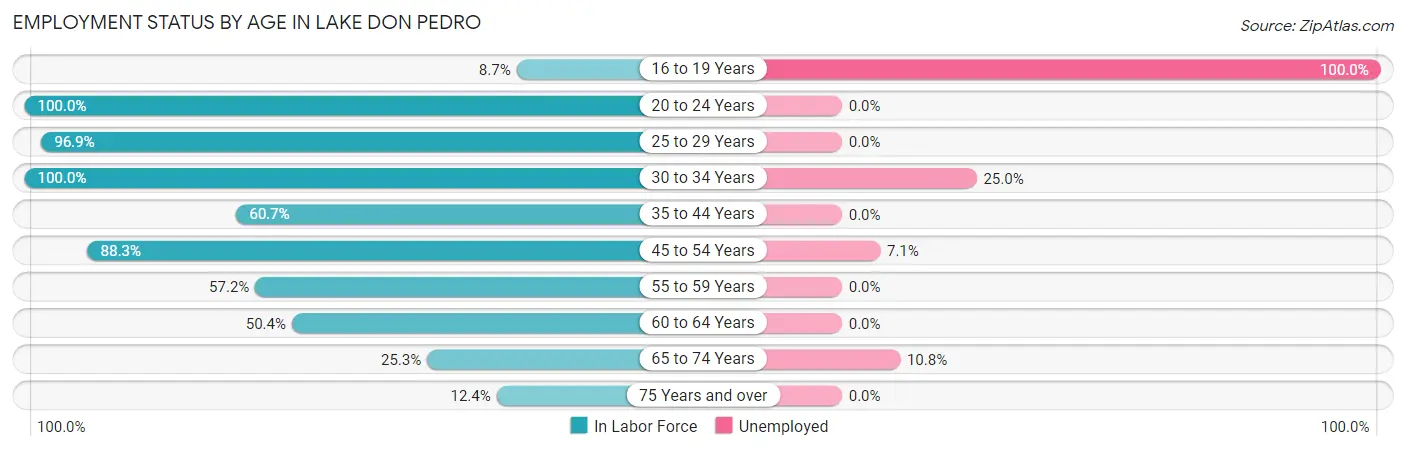
| Age Bracket | In Labor Force | Unemployed |
| 16 to 19 Years | 2 (8.7%) | 2 (100.0%) |
| 20 to 24 Years | 29 (100.0%) | 0 (0.0%) |
| 25 to 29 Years | 31 (96.9%) | 0 (0.0%) |
| 30 to 34 Years | 8 (100.0%) | 2 (25.0%) |
| 35 to 44 Years | 17 (60.7%) | 0 (0.0%) |
| 45 to 54 Years | 113 (88.3%) | 8 (7.1%) |
| 55 to 59 Years | 190 (57.2%) | 0 (0.0%) |
| 60 to 64 Years | 68 (50.4%) | 0 (0.0%) |
| 65 to 74 Years | 65 (25.3%) | 7 (10.8%) |
| 75 Years and over | 18 (12.4%) | 0 (0.0%) |
| Total | 541 (48.4%) | 19 (3.5%) |
Employment Status by Educational Attainment in Lake Don Pedro
According to labor force statistics for Lake Don Pedro, 64.4% of individuals (427) out of the total population between 25 and 64 years of age (663) are in the labor force, with 2.3% or 10 of them being unemployed. The group with the highest labor force participation rate are those with the educational attainment of bachelor's degree or higher, with 80.0% or 140 individuals in the labor force. Within the labor force, individuals with high school diploma education have the highest percentage of unemployment, with 13.0% or 10 of them being unemployed.
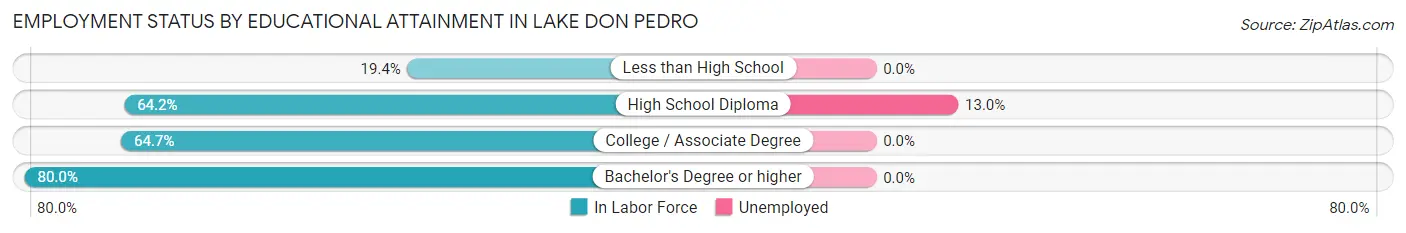
| Educational Attainment | In Labor Force | Unemployed |
| Less than High School | 12 (19.4%) | 0 (0.0%) |
| High School Diploma | 77 (64.2%) | 16 (13.0%) |
| College / Associate Degree | 198 (64.7%) | 0 (0.0%) |
| Bachelor's Degree or higher | 140 (80.0%) | 0 (0.0%) |
| Total | 427 (64.4%) | 15 (2.3%) |
Employment Occupations by Sex in Lake Don Pedro
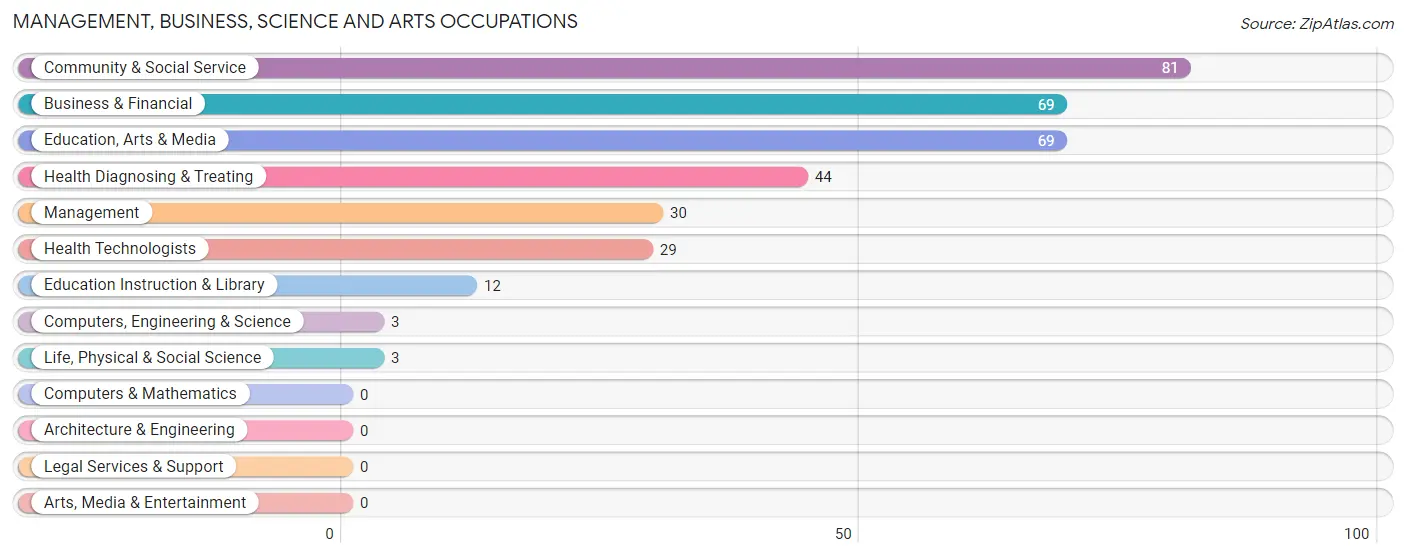
Management, Business, Science and Arts Occupations
The most common Management, Business, Science and Arts occupations in Lake Don Pedro are Community & Social Service (81 | 15.5%), Business & Financial (69 | 13.2%), Education, Arts & Media (69 | 13.2%), Health Diagnosing & Treating (44 | 8.4%), and Management (30 | 5.8%).
Management, Business, Science and Arts Occupations by Sex
Within the Management, Business, Science and Arts occupations in Lake Don Pedro, the most male-oriented occupations are Computers, Engineering & Science (100.0%), Life, Physical & Social Science (100.0%), and Business & Financial (92.7%), while the most female-oriented occupations are Health Technologists (100.0%), Education Instruction & Library (91.7%), and Health Diagnosing & Treating (65.9%).
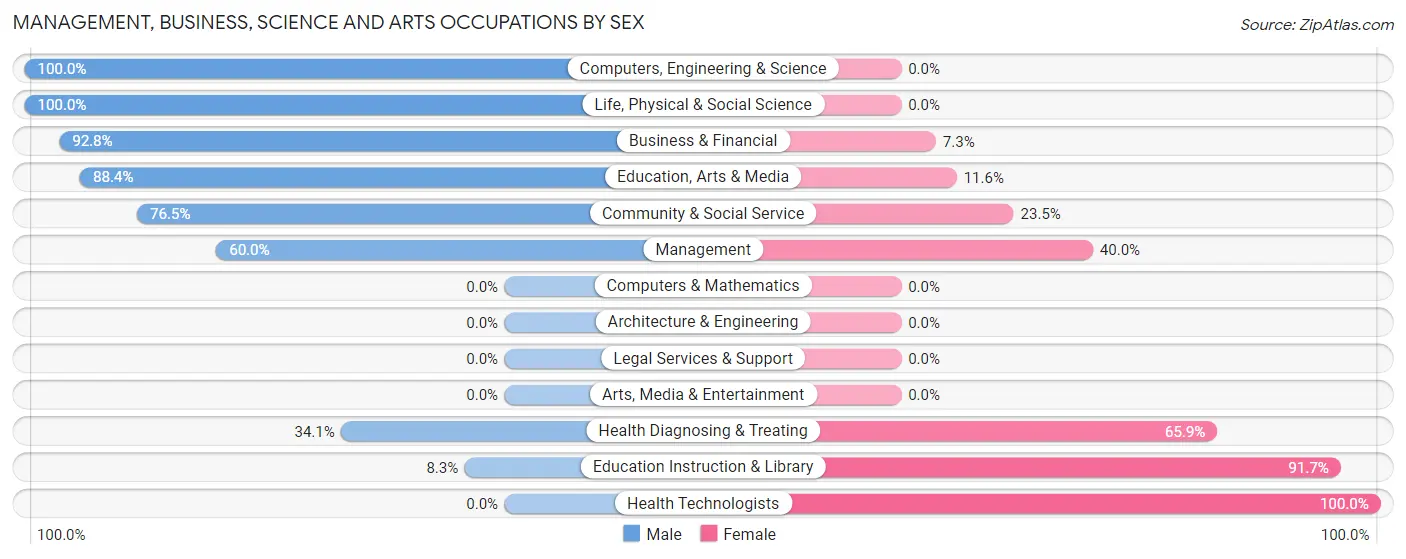
| Occupation | Male | Female |
| Management | 18 (60.0%) | 12 (40.0%) |
| Business & Financial | 64 (92.7%) | 5 (7.2%) |
| Computers, Engineering & Science | 3 (100.0%) | 0 (0.0%) |
| Computers & Mathematics | 0 (0.0%) | 0 (0.0%) |
| Architecture & Engineering | 0 (0.0%) | 0 (0.0%) |
| Life, Physical & Social Science | 3 (100.0%) | 0 (0.0%) |
| Community & Social Service | 62 (76.5%) | 19 (23.5%) |
| Education, Arts & Media | 61 (88.4%) | 8 (11.6%) |
| Legal Services & Support | 0 (0.0%) | 0 (0.0%) |
| Education Instruction & Library | 1 (8.3%) | 11 (91.7%) |
| Arts, Media & Entertainment | 0 (0.0%) | 0 (0.0%) |
| Health Diagnosing & Treating | 15 (34.1%) | 29 (65.9%) |
| Health Technologists | 0 (0.0%) | 29 (100.0%) |
| Total (Category) | 162 (71.4%) | 65 (28.6%) |
| Total (Overall) | 316 (60.5%) | 206 (39.5%) |
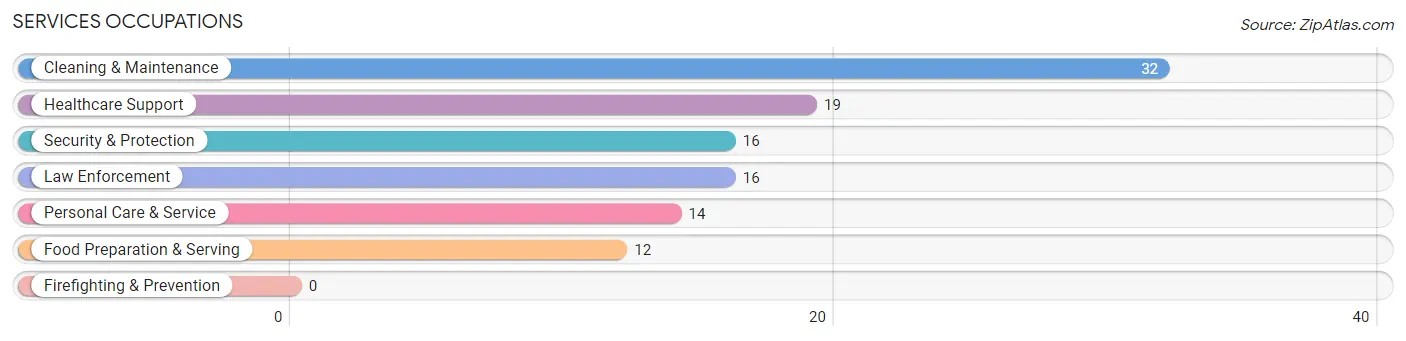
Services Occupations
The most common Services occupations in Lake Don Pedro are Cleaning & Maintenance (32 | 6.1%), Healthcare Support (19 | 3.6%), Security & Protection (16 | 3.1%), Law Enforcement (16 | 3.1%), and Personal Care & Service (14 | 2.7%).
Services Occupations by Sex
Within the Services occupations in Lake Don Pedro, the most male-oriented occupations are Healthcare Support (100.0%), Cleaning & Maintenance (75.0%), and Security & Protection (68.8%), while the most female-oriented occupations are Food Preparation & Serving (100.0%), Personal Care & Service (35.7%), and Security & Protection (31.2%).
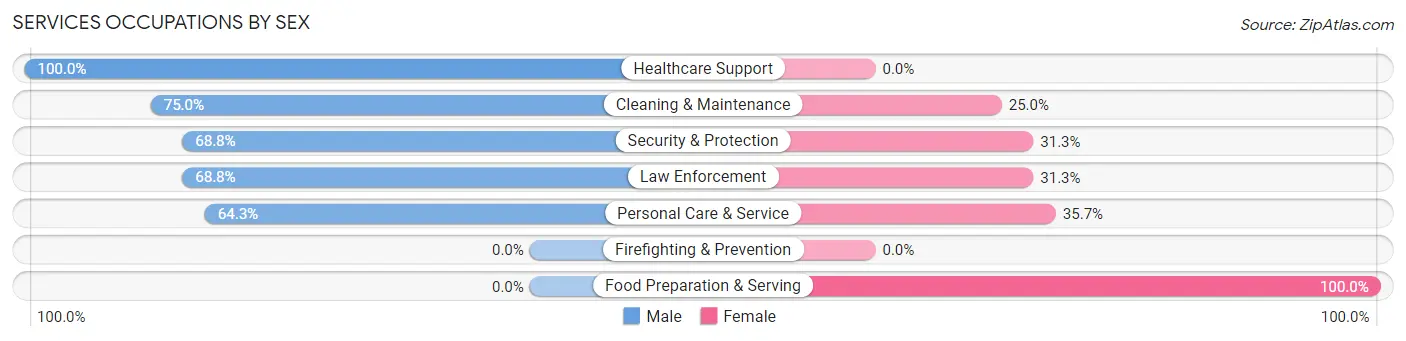
| Occupation | Male | Female |
| Healthcare Support | 19 (100.0%) | 0 (0.0%) |
| Security & Protection | 11 (68.8%) | 5 (31.2%) |
| Firefighting & Prevention | 0 (0.0%) | 0 (0.0%) |
| Law Enforcement | 11 (68.8%) | 5 (31.2%) |
| Food Preparation & Serving | 0 (0.0%) | 12 (100.0%) |
| Cleaning & Maintenance | 24 (75.0%) | 8 (25.0%) |
| Personal Care & Service | 9 (64.3%) | 5 (35.7%) |
| Total (Category) | 63 (67.7%) | 30 (32.3%) |
| Total (Overall) | 316 (60.5%) | 206 (39.5%) |
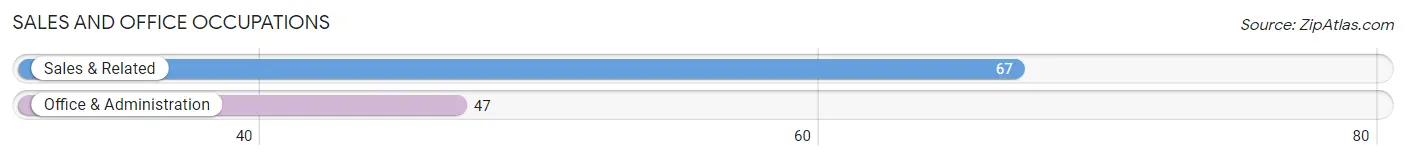
Sales and Office Occupations
The most common Sales and Office occupations in Lake Don Pedro are Sales & Related (67 | 12.8%), and Office & Administration (47 | 9.0%).
Sales and Office Occupations by Sex
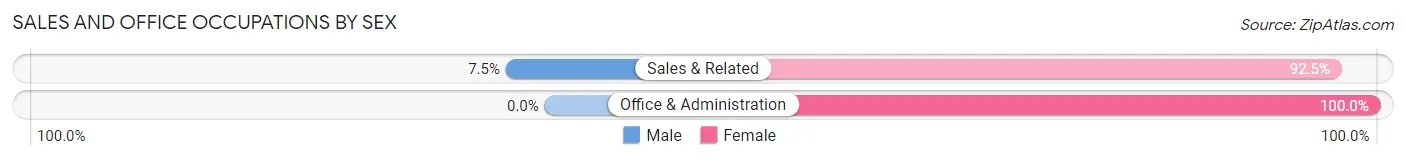
| Occupation | Male | Female |
| Sales & Related | 5 (7.5%) | 62 (92.5%) |
| Office & Administration | 0 (0.0%) | 47 (100.0%) |
| Total (Category) | 5 (4.4%) | 109 (95.6%) |
| Total (Overall) | 316 (60.5%) | 206 (39.5%) |
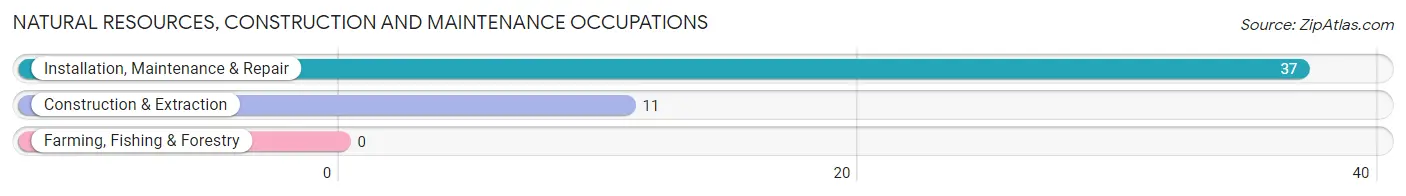
Natural Resources, Construction and Maintenance Occupations
The most common Natural Resources, Construction and Maintenance occupations in Lake Don Pedro are Installation, Maintenance & Repair (37 | 7.1%), and Construction & Extraction (11 | 2.1%).
Natural Resources, Construction and Maintenance Occupations by Sex
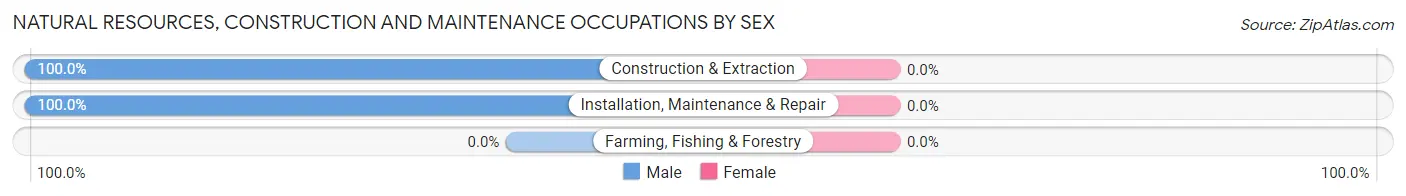
| Occupation | Male | Female |
| Farming, Fishing & Forestry | 0 (0.0%) | 0 (0.0%) |
| Construction & Extraction | 11 (100.0%) | 0 (0.0%) |
| Installation, Maintenance & Repair | 37 (100.0%) | 0 (0.0%) |
| Total (Category) | 48 (100.0%) | 0 (0.0%) |
| Total (Overall) | 316 (60.5%) | 206 (39.5%) |
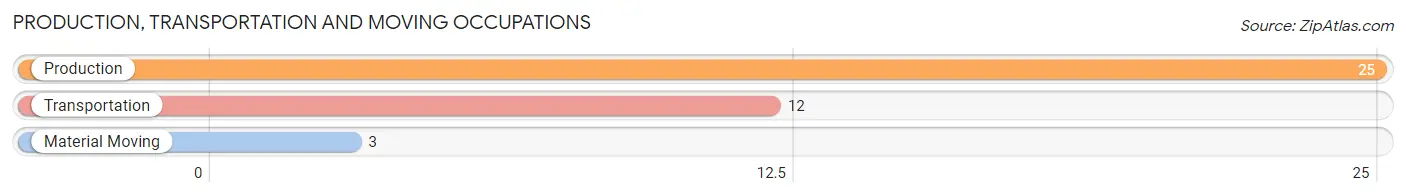
Production, Transportation and Moving Occupations
The most common Production, Transportation and Moving occupations in Lake Don Pedro are Production (25 | 4.8%), Transportation (12 | 2.3%), and Material Moving (3 | 0.6%).
Production, Transportation and Moving Occupations by Sex
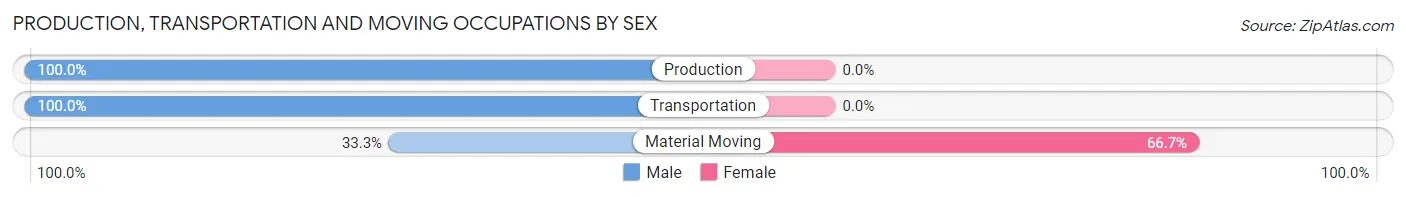
| Occupation | Male | Female |
| Production | 25 (100.0%) | 0 (0.0%) |
| Transportation | 12 (100.0%) | 0 (0.0%) |
| Material Moving | 1 (33.3%) | 2 (66.7%) |
| Total (Category) | 38 (95.0%) | 2 (5.0%) |
| Total (Overall) | 316 (60.5%) | 206 (39.5%) |
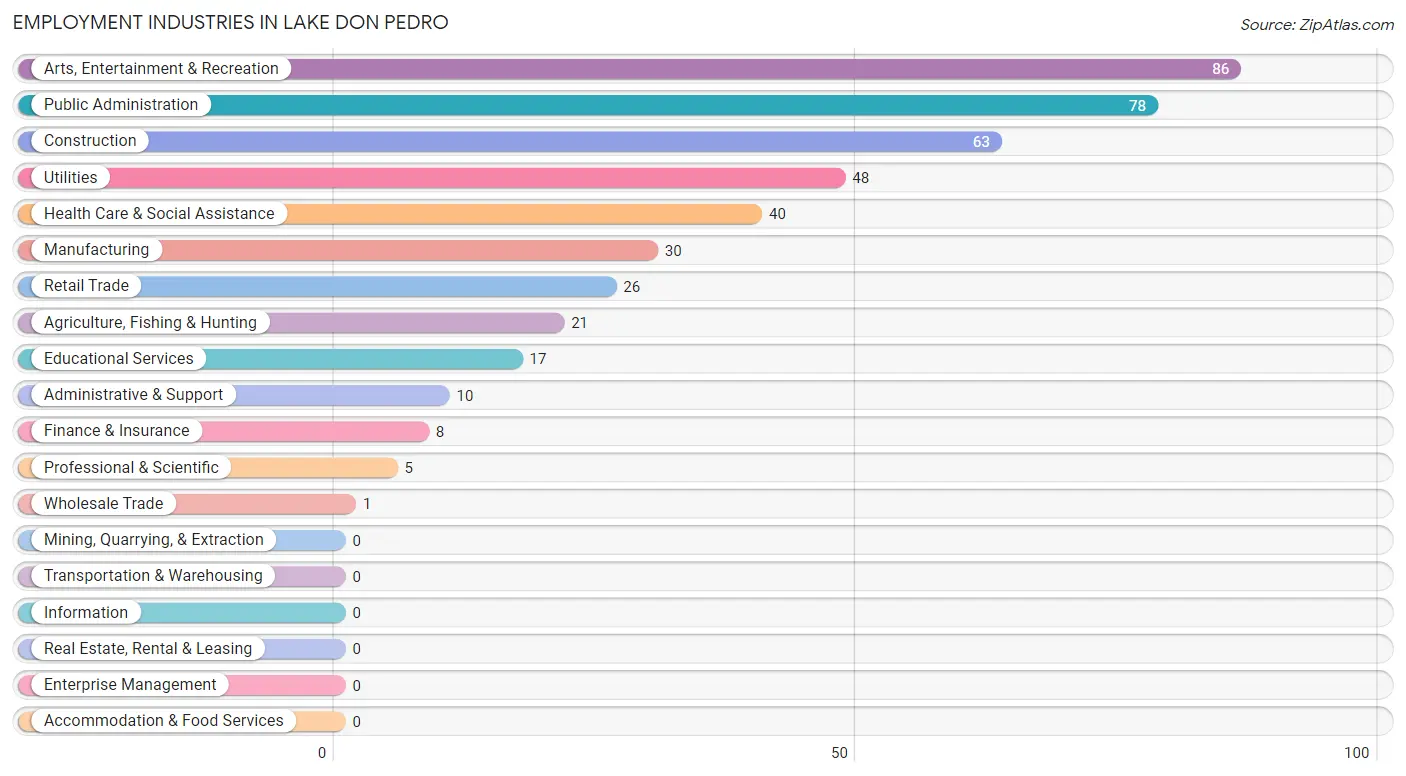
Employment Industries by Sex in Lake Don Pedro
Employment Industries in Lake Don Pedro
The major employment industries in Lake Don Pedro include Arts, Entertainment & Recreation (86 | 16.5%), Public Administration (78 | 14.9%), Construction (63 | 12.1%), Utilities (48 | 9.2%), and Health Care & Social Assistance (40 | 7.7%).
Employment Industries by Sex in Lake Don Pedro
The Lake Don Pedro industries that see more men than women are Agriculture, Fishing & Hunting (100.0%), Wholesale Trade (100.0%), and Professional & Scientific (100.0%), whereas the industries that tend to have a higher number of women are Finance & Insurance (100.0%), Educational Services (94.1%), and Retail Trade (80.8%).
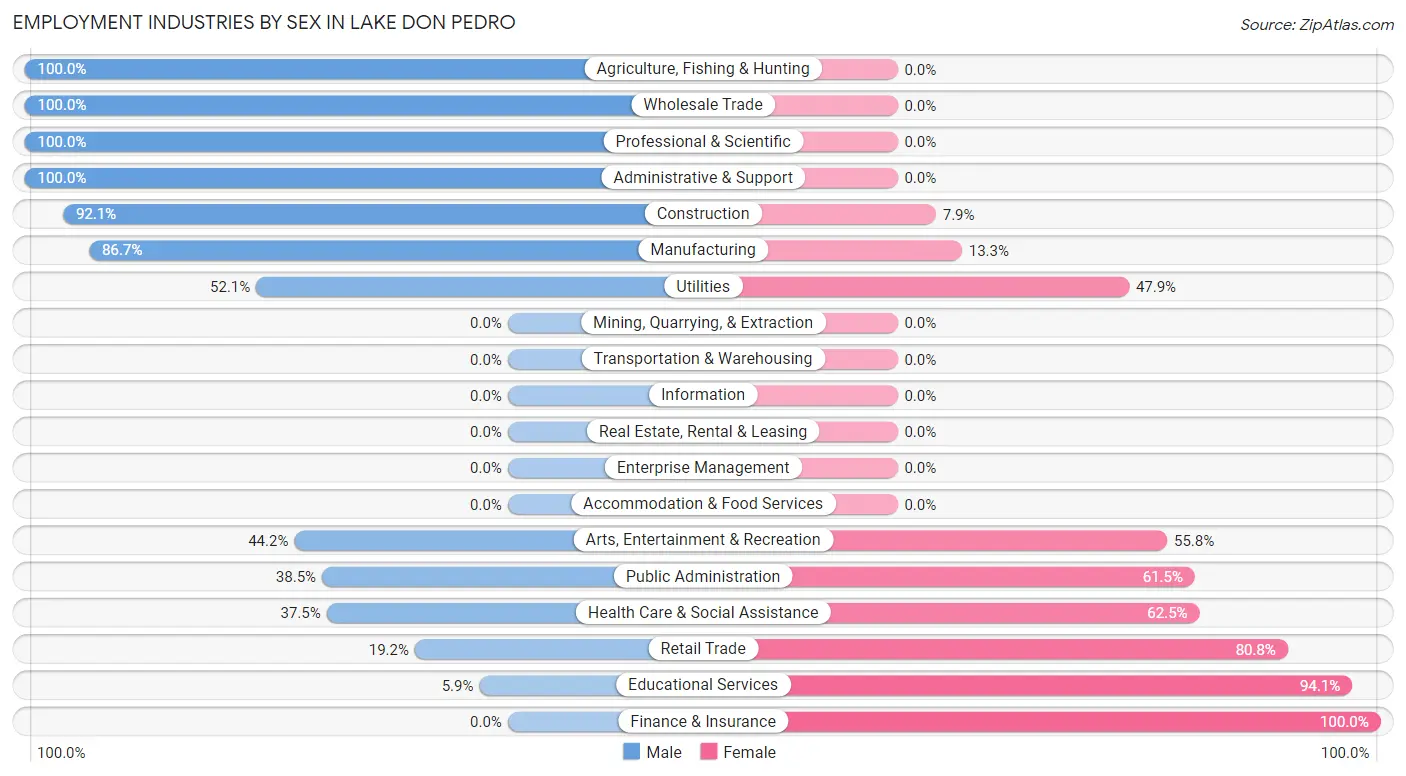
| Industry | Male | Female |
| Agriculture, Fishing & Hunting | 21 (100.0%) | 0 (0.0%) |
| Mining, Quarrying, & Extraction | 0 (0.0%) | 0 (0.0%) |
| Construction | 58 (92.1%) | 5 (7.9%) |
| Manufacturing | 26 (86.7%) | 4 (13.3%) |
| Wholesale Trade | 1 (100.0%) | 0 (0.0%) |
| Retail Trade | 5 (19.2%) | 21 (80.8%) |
| Transportation & Warehousing | 0 (0.0%) | 0 (0.0%) |
| Utilities | 25 (52.1%) | 23 (47.9%) |
| Information | 0 (0.0%) | 0 (0.0%) |
| Finance & Insurance | 0 (0.0%) | 8 (100.0%) |
| Real Estate, Rental & Leasing | 0 (0.0%) | 0 (0.0%) |
| Professional & Scientific | 5 (100.0%) | 0 (0.0%) |
| Enterprise Management | 0 (0.0%) | 0 (0.0%) |
| Administrative & Support | 10 (100.0%) | 0 (0.0%) |
| Educational Services | 1 (5.9%) | 16 (94.1%) |
| Health Care & Social Assistance | 15 (37.5%) | 25 (62.5%) |
| Arts, Entertainment & Recreation | 38 (44.2%) | 48 (55.8%) |
| Accommodation & Food Services | 0 (0.0%) | 0 (0.0%) |
| Public Administration | 30 (38.5%) | 48 (61.5%) |
| Total | 316 (60.5%) | 206 (39.5%) |
Education in Lake Don Pedro
School Enrollment in Lake Don Pedro
The most common levels of schooling among the 134 students in Lake Don Pedro are middle school (39 | 29.1%), college / undergraduate (38 | 28.4%), and elementary school (33 | 24.6%).
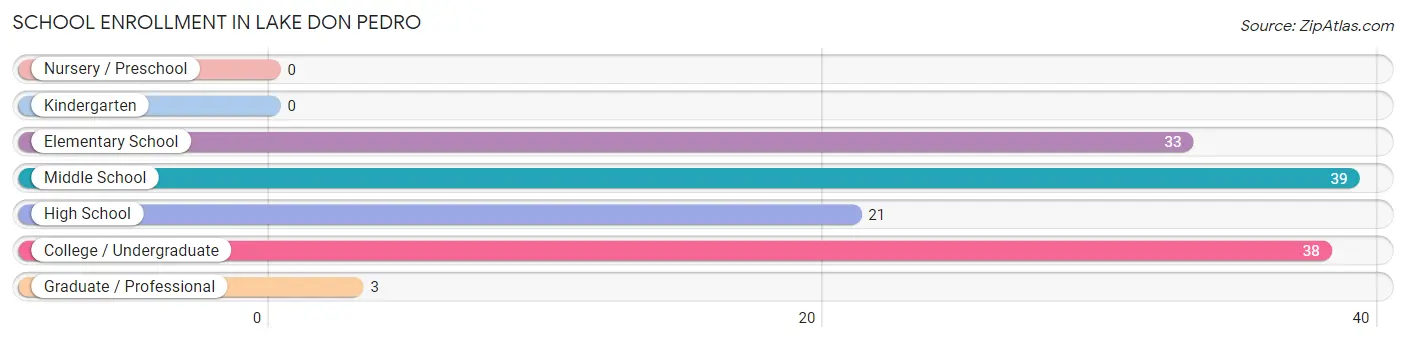
| School Level | # Students | % Students |
| Nursery / Preschool | 0 | 0.0% |
| Kindergarten | 0 | 0.0% |
| Elementary School | 33 | 24.6% |
| Middle School | 39 | 29.1% |
| High School | 21 | 15.7% |
| College / Undergraduate | 38 | 28.4% |
| Graduate / Professional | 3 | 2.2% |
| Total | 134 | 100.0% |
School Enrollment by Age by Funding Source in Lake Don Pedro
Out of a total of 134 students who are enrolled in schools in Lake Don Pedro, 7 (5.2%) attend a private institution, while the remaining 127 (94.8%) are enrolled in public schools. The age group of 35 years and over has the highest likelihood of being enrolled in private schools, with 7 (100.0% in the age bracket) enrolled. Conversely, the age group of 5 to 9 year old has the lowest likelihood of being enrolled in a private school, with 33 (100.0% in the age bracket) attending a public institution.
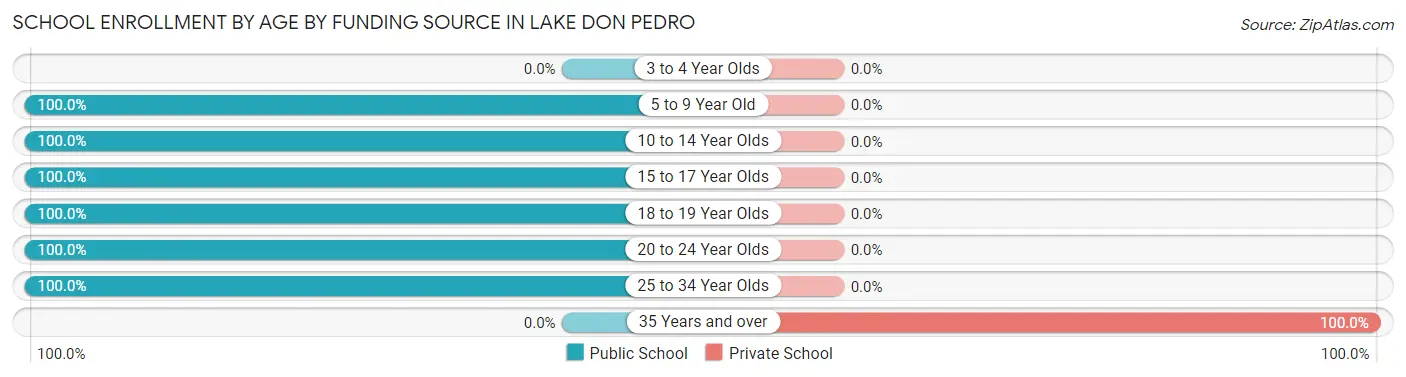
| Age Bracket | Public School | Private School |
| 3 to 4 Year Olds | 0 (0.0%) | 0 (0.0%) |
| 5 to 9 Year Old | 33 (100.0%) | 0 (0.0%) |
| 10 to 14 Year Olds | 39 (100.0%) | 0 (0.0%) |
| 15 to 17 Year Olds | 21 (100.0%) | 0 (0.0%) |
| 18 to 19 Year Olds | 2 (100.0%) | 0 (0.0%) |
| 20 to 24 Year Olds | 29 (100.0%) | 0 (0.0%) |
| 25 to 34 Year Olds | 3 (100.0%) | 0 (0.0%) |
| 35 Years and over | 0 (0.0%) | 7 (100.0%) |
| Total | 127 (94.8%) | 7 (5.2%) |
Educational Attainment by Field of Study in Lake Don Pedro
Social sciences (72 | 21.6%), liberal arts & history (50 | 15.0%), business (46 | 13.8%), education (38 | 11.4%), and science & technology (25 | 7.5%) are the most common fields of study among 333 individuals in Lake Don Pedro who have obtained a bachelor's degree or higher.
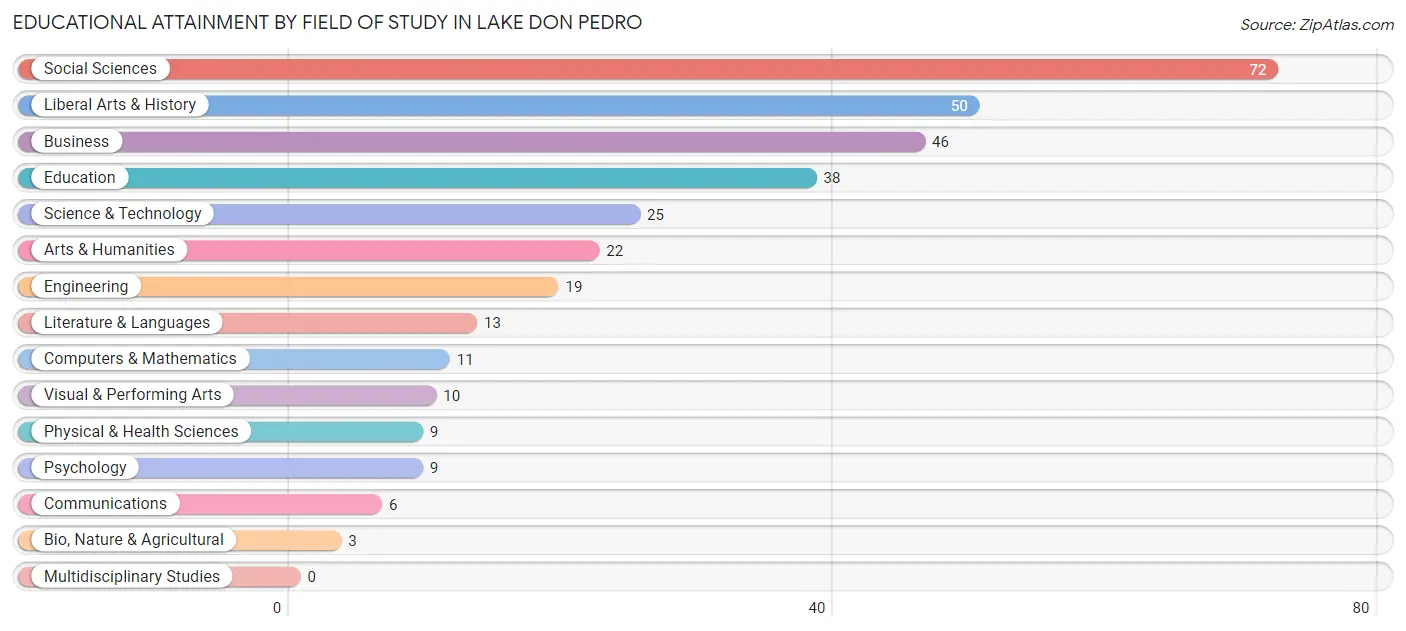
| Field of Study | # Graduates | % Graduates |
| Computers & Mathematics | 11 | 3.3% |
| Bio, Nature & Agricultural | 3 | 0.9% |
| Physical & Health Sciences | 9 | 2.7% |
| Psychology | 9 | 2.7% |
| Social Sciences | 72 | 21.6% |
| Engineering | 19 | 5.7% |
| Multidisciplinary Studies | 0 | 0.0% |
| Science & Technology | 25 | 7.5% |
| Business | 46 | 13.8% |
| Education | 38 | 11.4% |
| Literature & Languages | 13 | 3.9% |
| Liberal Arts & History | 50 | 15.0% |
| Visual & Performing Arts | 10 | 3.0% |
| Communications | 6 | 1.8% |
| Arts & Humanities | 22 | 6.6% |
| Total | 333 | 100.0% |
Transportation & Commute in Lake Don Pedro
Vehicle Availability by Sex in Lake Don Pedro
The most prevalent vehicle ownership categories in Lake Don Pedro are males with 2 vehicles (90, accounting for 29.7%) and females with 2 vehicles (96, making up 43.7%).
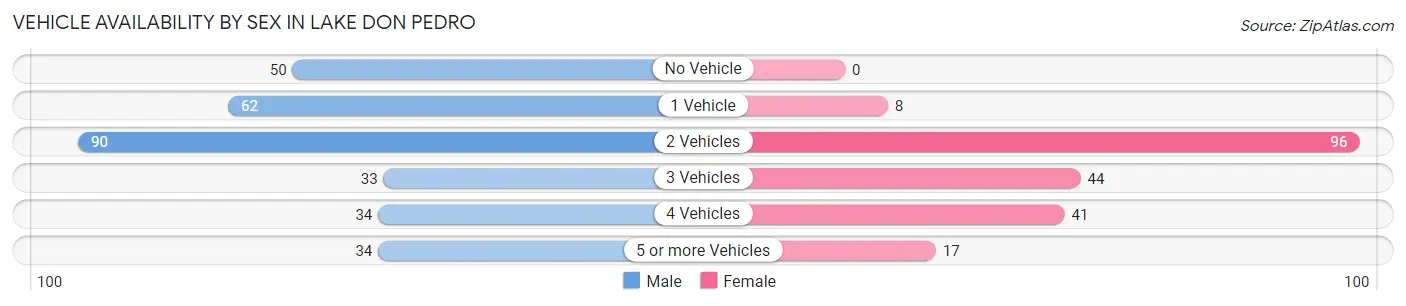
| Vehicles Available | Male | Female |
| No Vehicle | 50 (16.5%) | 0 (0.0%) |
| 1 Vehicle | 62 (20.5%) | 8 (3.9%) |
| 2 Vehicles | 90 (29.7%) | 96 (46.6%) |
| 3 Vehicles | 33 (10.9%) | 44 (21.4%) |
| 4 Vehicles | 34 (11.2%) | 41 (19.9%) |
| 5 or more Vehicles | 34 (11.2%) | 17 (8.3%) |
| Total | 303 (100.0%) | 206 (100.0%) |
Commute Time in Lake Don Pedro
The most frequently occuring commute durations in Lake Don Pedro are 10 to 14 minutes (123 commuters, 28.1%), 90 or more minutes (103 commuters, 23.5%), and 60 to 89 minutes (81 commuters, 18.5%).
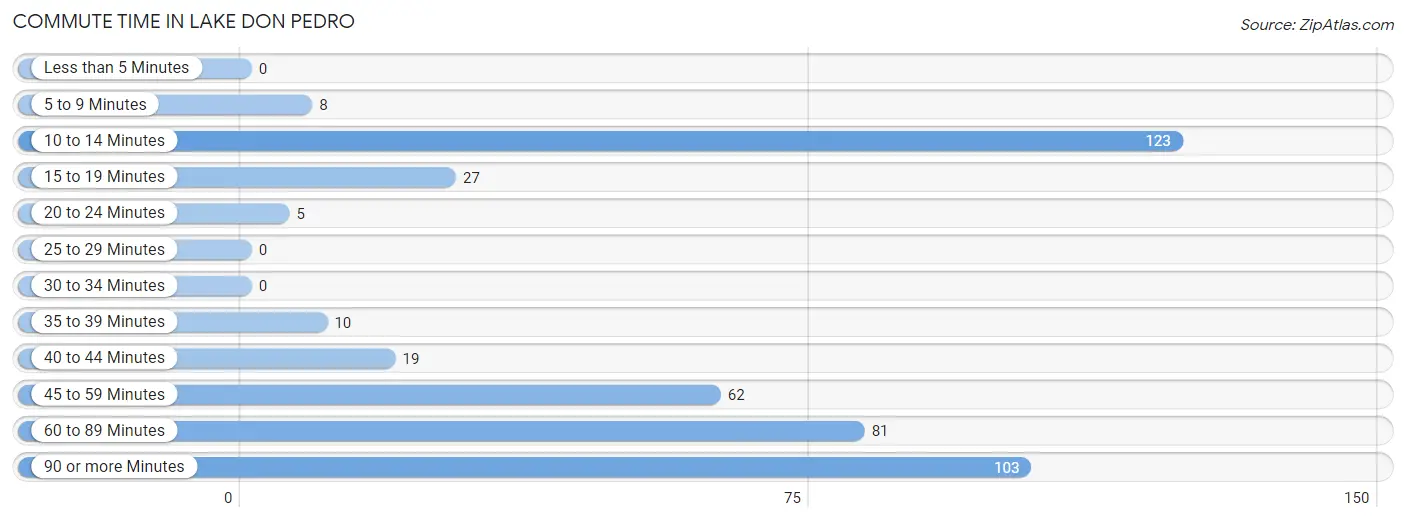
| Commute Time | # Commuters | % Commuters |
| Less than 5 Minutes | 0 | 0.0% |
| 5 to 9 Minutes | 8 | 1.8% |
| 10 to 14 Minutes | 123 | 28.1% |
| 15 to 19 Minutes | 27 | 6.2% |
| 20 to 24 Minutes | 5 | 1.1% |
| 25 to 29 Minutes | 0 | 0.0% |
| 30 to 34 Minutes | 0 | 0.0% |
| 35 to 39 Minutes | 10 | 2.3% |
| 40 to 44 Minutes | 19 | 4.3% |
| 45 to 59 Minutes | 62 | 14.2% |
| 60 to 89 Minutes | 81 | 18.5% |
| 90 or more Minutes | 103 | 23.5% |
Commute Time by Sex in Lake Don Pedro
The most common commute times in Lake Don Pedro are 90 or more minutes (64 commuters, 27.6%) for males and 10 to 14 minutes (78 commuters, 37.9%) for females.
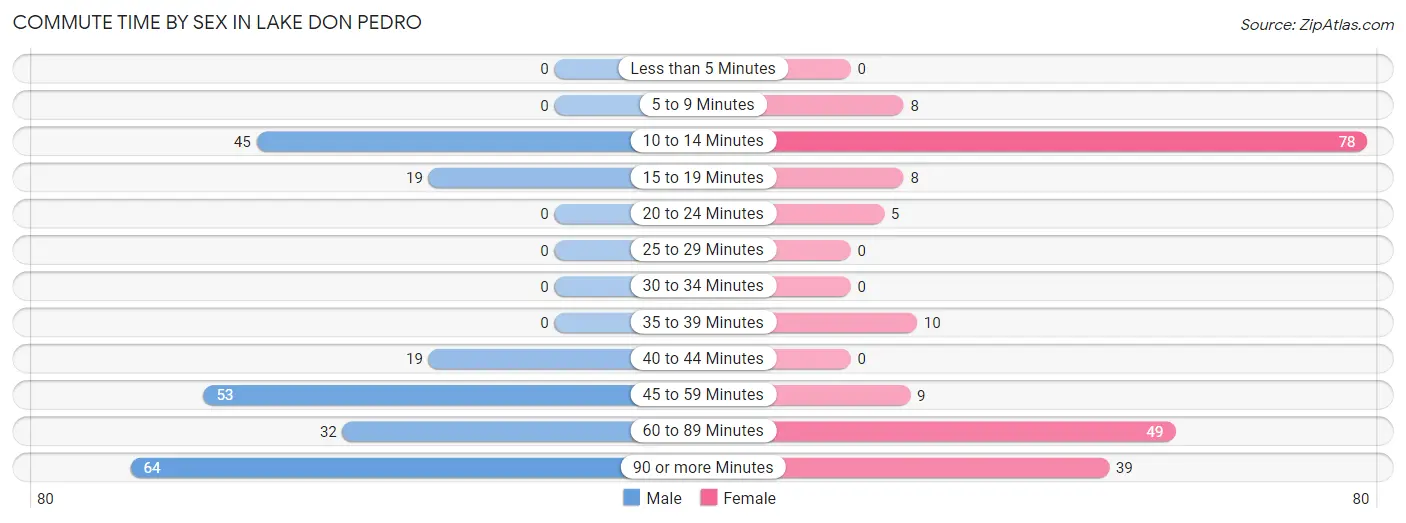
| Commute Time | Male | Female |
| Less than 5 Minutes | 0 (0.0%) | 0 (0.0%) |
| 5 to 9 Minutes | 0 (0.0%) | 8 (3.9%) |
| 10 to 14 Minutes | 45 (19.4%) | 78 (37.9%) |
| 15 to 19 Minutes | 19 (8.2%) | 8 (3.9%) |
| 20 to 24 Minutes | 0 (0.0%) | 5 (2.4%) |
| 25 to 29 Minutes | 0 (0.0%) | 0 (0.0%) |
| 30 to 34 Minutes | 0 (0.0%) | 0 (0.0%) |
| 35 to 39 Minutes | 0 (0.0%) | 10 (4.9%) |
| 40 to 44 Minutes | 19 (8.2%) | 0 (0.0%) |
| 45 to 59 Minutes | 53 (22.8%) | 9 (4.4%) |
| 60 to 89 Minutes | 32 (13.8%) | 49 (23.8%) |
| 90 or more Minutes | 64 (27.6%) | 39 (18.9%) |
Time of Departure to Work by Sex in Lake Don Pedro
The most frequent times of departure to work in Lake Don Pedro are 12:00 AM to 4:59 AM (87, 37.5%) for males and 7:00 AM to 7:29 AM (44, 21.4%) for females.
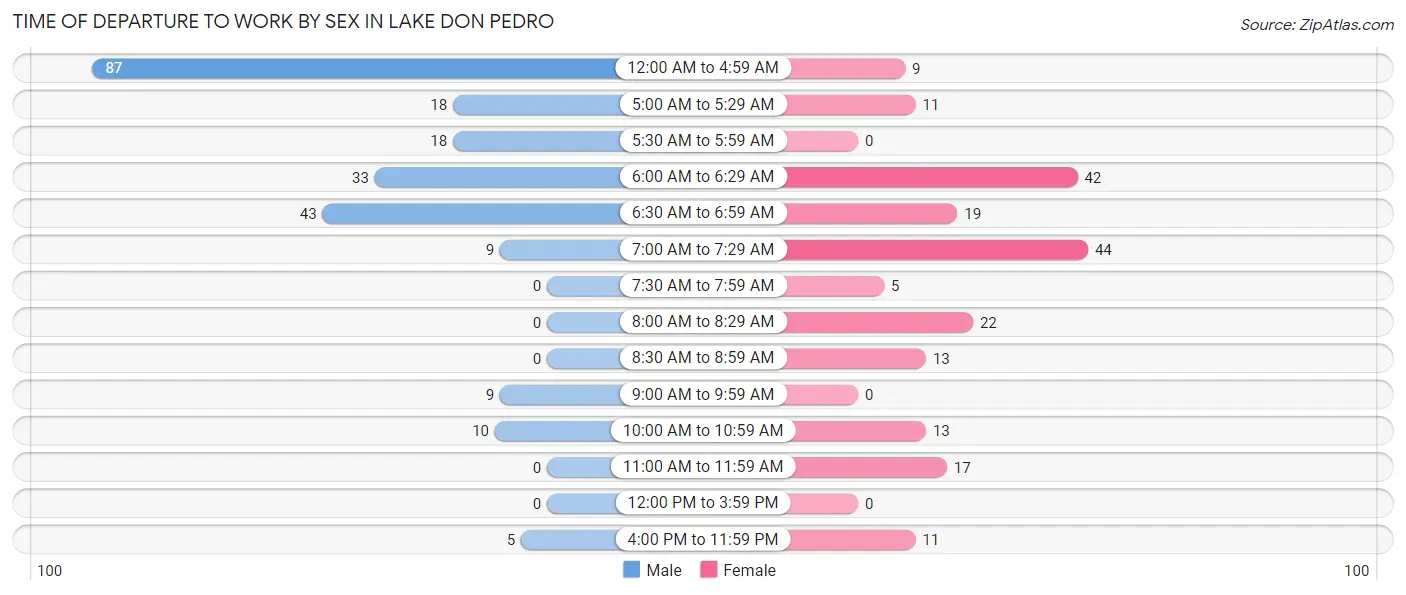
| Time of Departure | Male | Female |
| 12:00 AM to 4:59 AM | 87 (37.5%) | 9 (4.4%) |
| 5:00 AM to 5:29 AM | 18 (7.8%) | 11 (5.3%) |
| 5:30 AM to 5:59 AM | 18 (7.8%) | 0 (0.0%) |
| 6:00 AM to 6:29 AM | 33 (14.2%) | 42 (20.4%) |
| 6:30 AM to 6:59 AM | 43 (18.5%) | 19 (9.2%) |
| 7:00 AM to 7:29 AM | 9 (3.9%) | 44 (21.4%) |
| 7:30 AM to 7:59 AM | 0 (0.0%) | 5 (2.4%) |
| 8:00 AM to 8:29 AM | 0 (0.0%) | 22 (10.7%) |
| 8:30 AM to 8:59 AM | 0 (0.0%) | 13 (6.3%) |
| 9:00 AM to 9:59 AM | 9 (3.9%) | 0 (0.0%) |
| 10:00 AM to 10:59 AM | 10 (4.3%) | 13 (6.3%) |
| 11:00 AM to 11:59 AM | 0 (0.0%) | 17 (8.3%) |
| 12:00 PM to 3:59 PM | 0 (0.0%) | 0 (0.0%) |
| 4:00 PM to 11:59 PM | 5 (2.2%) | 11 (5.3%) |
| Total | 232 (100.0%) | 206 (100.0%) |
Housing Occupancy in Lake Don Pedro
Occupancy by Ownership in Lake Don Pedro
Of the total 600 dwellings in Lake Don Pedro, owner-occupied units account for 527 (87.8%), while renter-occupied units make up 73 (12.2%).
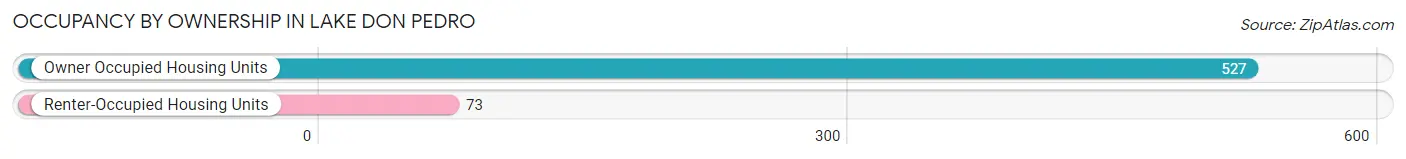
| Occupancy | # Housing Units | % Housing Units |
| Owner Occupied Housing Units | 527 | 87.8% |
| Renter-Occupied Housing Units | 73 | 12.2% |
| Total Occupied Housing Units | 600 | 100.0% |
Occupancy by Household Size in Lake Don Pedro
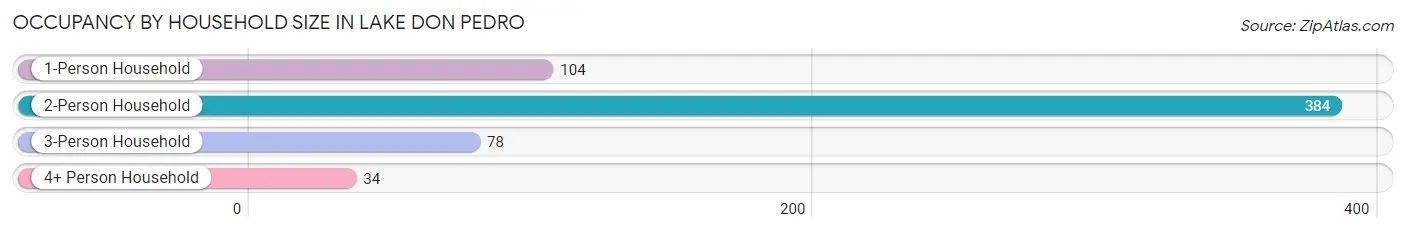
| Household Size | # Housing Units | % Housing Units |
| 1-Person Household | 104 | 17.3% |
| 2-Person Household | 384 | 64.0% |
| 3-Person Household | 78 | 13.0% |
| 4+ Person Household | 34 | 5.7% |
| Total Housing Units | 600 | 100.0% |
Occupancy by Ownership by Household Size in Lake Don Pedro
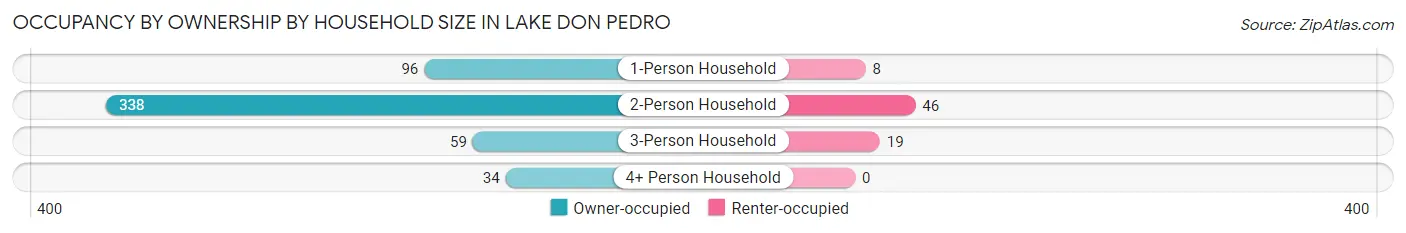
| Household Size | Owner-occupied | Renter-occupied |
| 1-Person Household | 96 (92.3%) | 8 (7.7%) |
| 2-Person Household | 338 (88.0%) | 46 (12.0%) |
| 3-Person Household | 59 (75.6%) | 19 (24.4%) |
| 4+ Person Household | 34 (100.0%) | 0 (0.0%) |
| Total Housing Units | 527 (87.8%) | 73 (12.2%) |
Occupancy by Educational Attainment in Lake Don Pedro
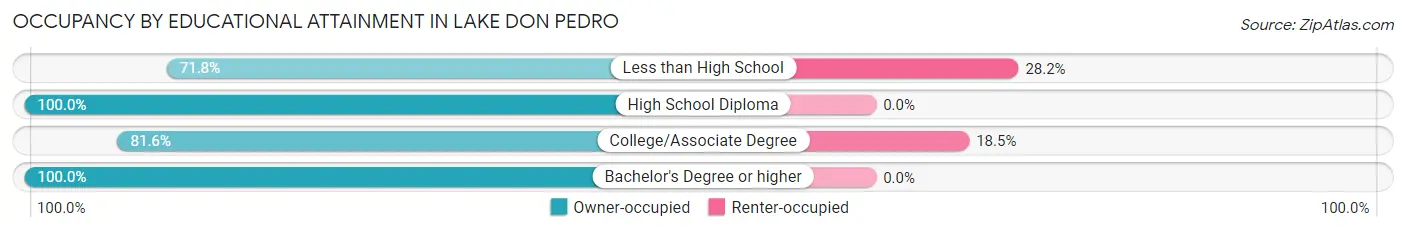
| Household Size | Owner-occupied | Renter-occupied |
| Less than High School | 28 (71.8%) | 11 (28.2%) |
| High School Diploma | 49 (100.0%) | 0 (0.0%) |
| College/Associate Degree | 274 (81.6%) | 62 (18.4%) |
| Bachelor's Degree or higher | 176 (100.0%) | 0 (0.0%) |
Occupancy by Age of Householder in Lake Don Pedro
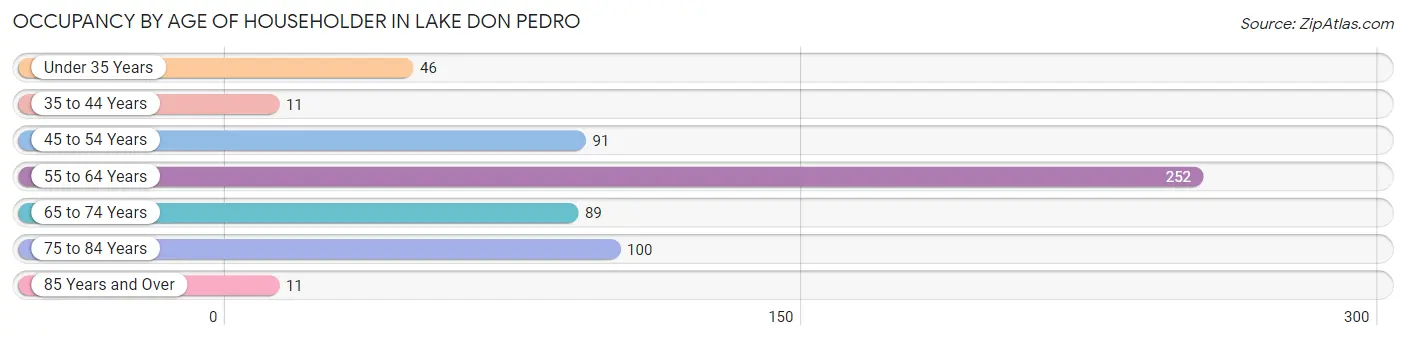
| Age Bracket | # Households | % Households |
| Under 35 Years | 46 | 7.7% |
| 35 to 44 Years | 11 | 1.8% |
| 45 to 54 Years | 91 | 15.2% |
| 55 to 64 Years | 252 | 42.0% |
| 65 to 74 Years | 89 | 14.8% |
| 75 to 84 Years | 100 | 16.7% |
| 85 Years and Over | 11 | 1.8% |
| Total | 600 | 100.0% |
Housing Finances in Lake Don Pedro
Median Income by Occupancy in Lake Don Pedro
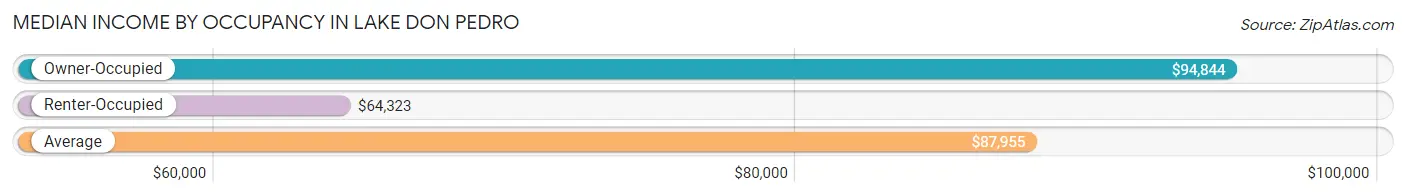
| Occupancy Type | # Households | Median Income |
| Owner-Occupied | 527 (87.8%) | $94,844 |
| Renter-Occupied | 73 (12.2%) | $64,323 |
| Average | 600 (100.0%) | $87,955 |
Occupancy by Householder Income Bracket in Lake Don Pedro
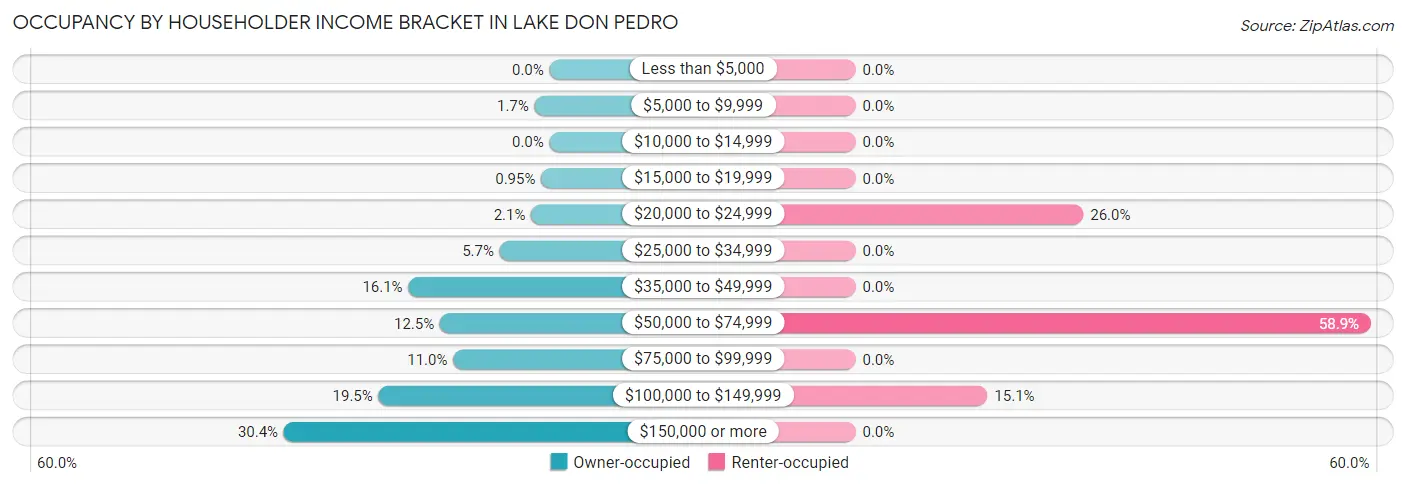
| Income Bracket | Owner-occupied | Renter-occupied |
| Less than $5,000 | 0 (0.0%) | 0 (0.0%) |
| $5,000 to $9,999 | 9 (1.7%) | 0 (0.0%) |
| $10,000 to $14,999 | 0 (0.0%) | 0 (0.0%) |
| $15,000 to $19,999 | 5 (0.9%) | 0 (0.0%) |
| $20,000 to $24,999 | 11 (2.1%) | 19 (26.0%) |
| $25,000 to $34,999 | 30 (5.7%) | 0 (0.0%) |
| $35,000 to $49,999 | 85 (16.1%) | 0 (0.0%) |
| $50,000 to $74,999 | 66 (12.5%) | 43 (58.9%) |
| $75,000 to $99,999 | 58 (11.0%) | 0 (0.0%) |
| $100,000 to $149,999 | 103 (19.5%) | 11 (15.1%) |
| $150,000 or more | 160 (30.4%) | 0 (0.0%) |
| Total | 527 (100.0%) | 73 (100.0%) |
Monthly Housing Cost Tiers in Lake Don Pedro
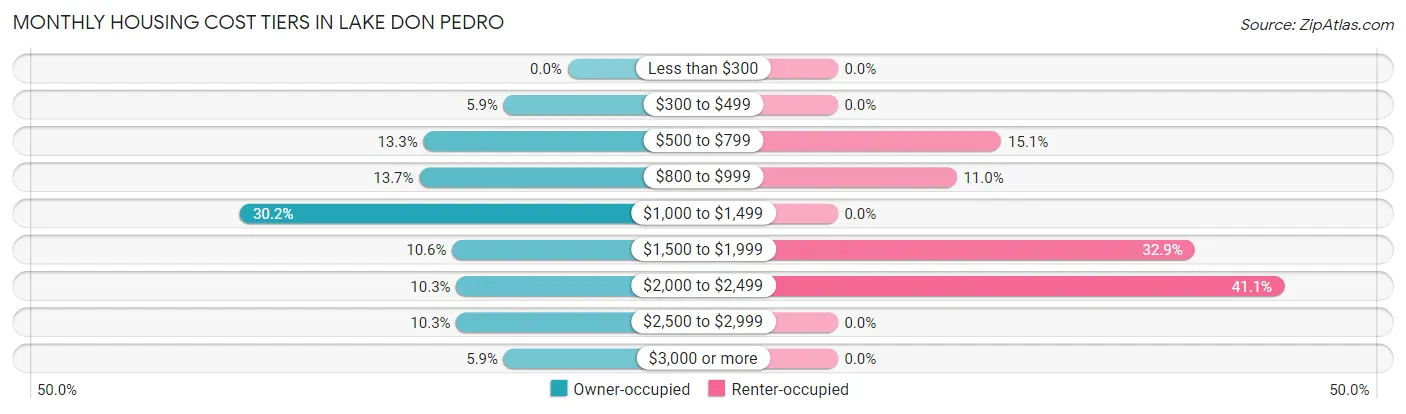
| Monthly Cost | Owner-occupied | Renter-occupied |
| Less than $300 | 0 (0.0%) | 0 (0.0%) |
| $300 to $499 | 31 (5.9%) | 0 (0.0%) |
| $500 to $799 | 70 (13.3%) | 11 (15.1%) |
| $800 to $999 | 72 (13.7%) | 8 (11.0%) |
| $1,000 to $1,499 | 159 (30.2%) | 0 (0.0%) |
| $1,500 to $1,999 | 56 (10.6%) | 24 (32.9%) |
| $2,000 to $2,499 | 54 (10.2%) | 30 (41.1%) |
| $2,500 to $2,999 | 54 (10.2%) | 0 (0.0%) |
| $3,000 or more | 31 (5.9%) | 0 (0.0%) |
| Total | 527 (100.0%) | 73 (100.0%) |
Physical Housing Characteristics in Lake Don Pedro
Housing Structures in Lake Don Pedro
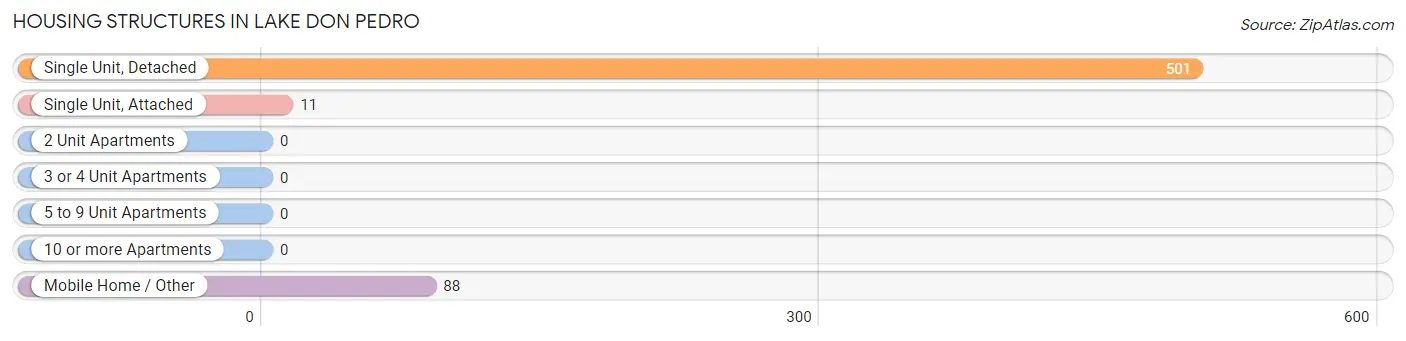
| Structure Type | # Housing Units | % Housing Units |
| Single Unit, Detached | 501 | 83.5% |
| Single Unit, Attached | 11 | 1.8% |
| 2 Unit Apartments | 0 | 0.0% |
| 3 or 4 Unit Apartments | 0 | 0.0% |
| 5 to 9 Unit Apartments | 0 | 0.0% |
| 10 or more Apartments | 0 | 0.0% |
| Mobile Home / Other | 88 | 14.7% |
| Total | 600 | 100.0% |
Housing Structures by Occupancy in Lake Don Pedro
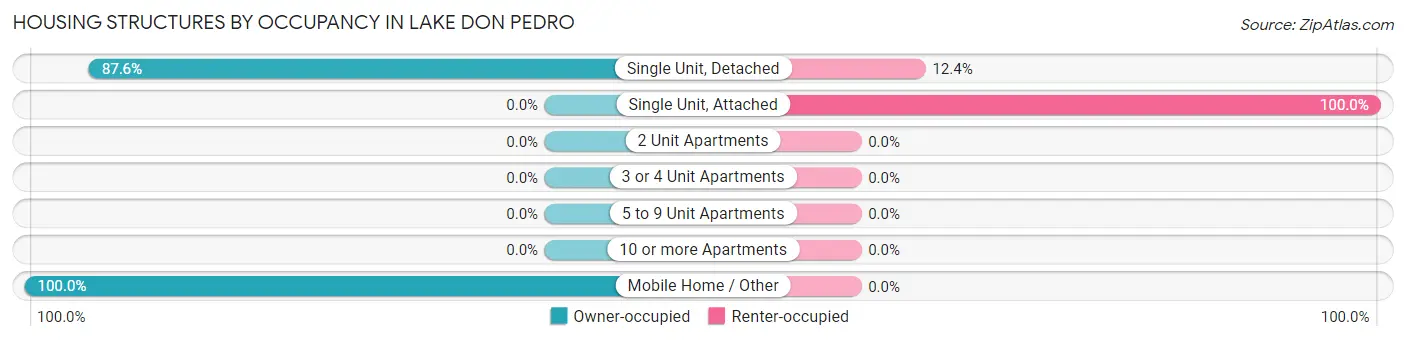
| Structure Type | Owner-occupied | Renter-occupied |
| Single Unit, Detached | 439 (87.6%) | 62 (12.4%) |
| Single Unit, Attached | 0 (0.0%) | 11 (100.0%) |
| 2 Unit Apartments | 0 (0.0%) | 0 (0.0%) |
| 3 or 4 Unit Apartments | 0 (0.0%) | 0 (0.0%) |
| 5 to 9 Unit Apartments | 0 (0.0%) | 0 (0.0%) |
| 10 or more Apartments | 0 (0.0%) | 0 (0.0%) |
| Mobile Home / Other | 88 (100.0%) | 0 (0.0%) |
| Total | 527 (87.8%) | 73 (12.2%) |
Housing Structures by Number of Rooms in Lake Don Pedro
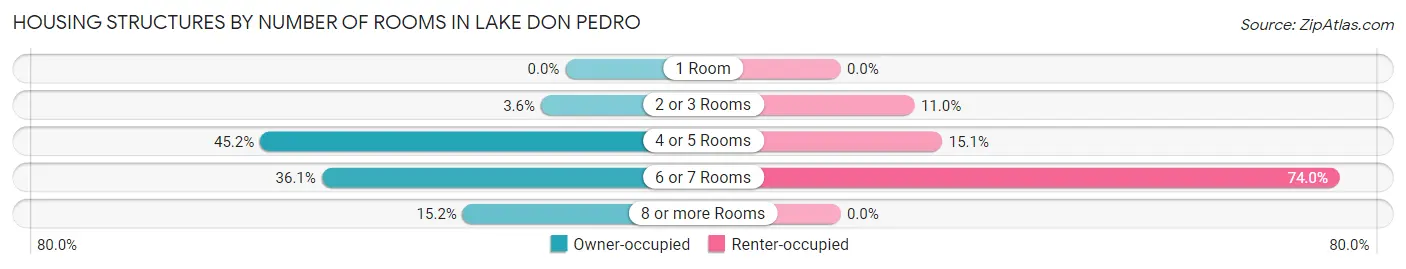
| Number of Rooms | Owner-occupied | Renter-occupied |
| 1 Room | 0 (0.0%) | 0 (0.0%) |
| 2 or 3 Rooms | 19 (3.6%) | 8 (11.0%) |
| 4 or 5 Rooms | 238 (45.2%) | 11 (15.1%) |
| 6 or 7 Rooms | 190 (36.0%) | 54 (74.0%) |
| 8 or more Rooms | 80 (15.2%) | 0 (0.0%) |
| Total | 527 (100.0%) | 73 (100.0%) |
Housing Structure by Heating Type in Lake Don Pedro

| Heating Type | Owner-occupied | Renter-occupied |
| Utility Gas | 13 (2.5%) | 11 (15.1%) |
| Bottled, Tank, or LP Gas | 299 (56.7%) | 30 (41.1%) |
| Electricity | 39 (7.4%) | 24 (32.9%) |
| Fuel Oil or Kerosene | 8 (1.5%) | 0 (0.0%) |
| Coal or Coke | 0 (0.0%) | 0 (0.0%) |
| All other Fuels | 168 (31.9%) | 8 (11.0%) |
| No Fuel Used | 0 (0.0%) | 0 (0.0%) |
| Total | 527 (100.0%) | 73 (100.0%) |
Household Vehicle Usage in Lake Don Pedro
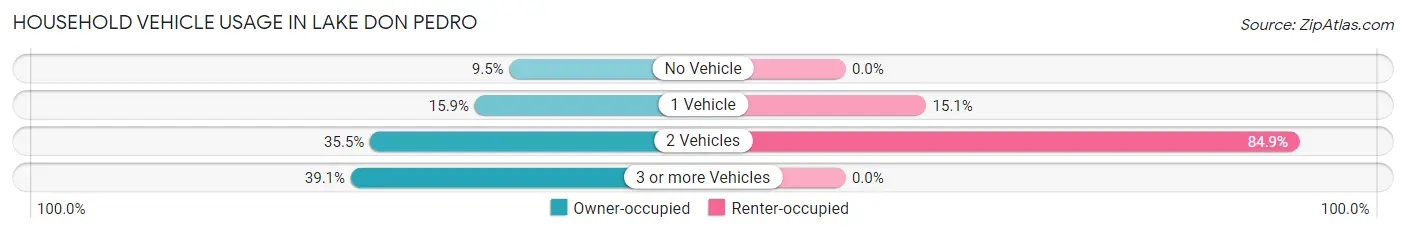
| Vehicles per Household | Owner-occupied | Renter-occupied |
| No Vehicle | 50 (9.5%) | 0 (0.0%) |
| 1 Vehicle | 84 (15.9%) | 11 (15.1%) |
| 2 Vehicles | 187 (35.5%) | 62 (84.9%) |
| 3 or more Vehicles | 206 (39.1%) | 0 (0.0%) |
| Total | 527 (100.0%) | 73 (100.0%) |
Real Estate & Mortgages in Lake Don Pedro
Real Estate and Mortgage Overview in Lake Don Pedro
| Characteristic | Without Mortgage | With Mortgage |
| Housing Units | 128 | 399 |
| Median Property Value | $350,900 | $295,400 |
| Median Household Income | $51,146 | $128 |
| Monthly Housing Costs | $745 | $31 |
| Real Estate Taxes | $2,906 | $8 |
Property Value by Mortgage Status in Lake Don Pedro
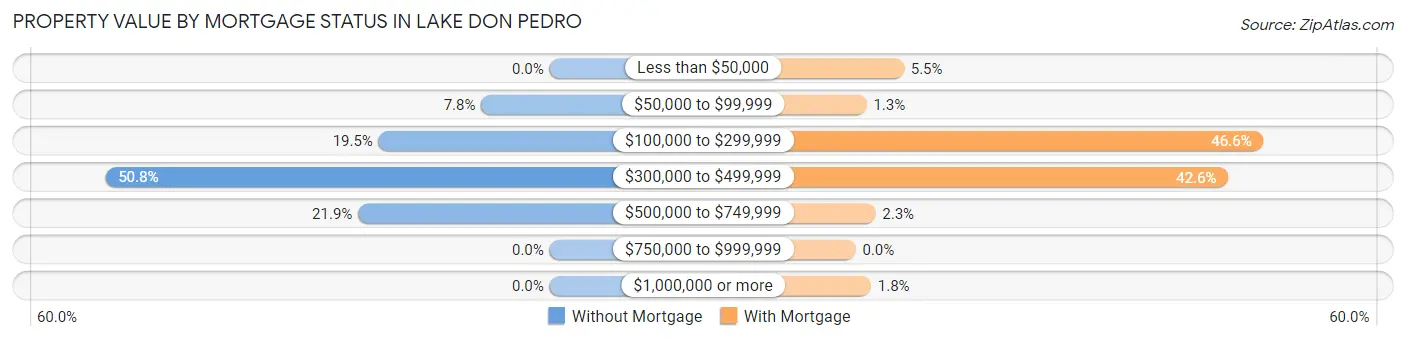
| Property Value | Without Mortgage | With Mortgage |
| Less than $50,000 | 0 (0.0%) | 22 (5.5%) |
| $50,000 to $99,999 | 10 (7.8%) | 5 (1.3%) |
| $100,000 to $299,999 | 25 (19.5%) | 186 (46.6%) |
| $300,000 to $499,999 | 65 (50.8%) | 170 (42.6%) |
| $500,000 to $749,999 | 28 (21.9%) | 9 (2.3%) |
| $750,000 to $999,999 | 0 (0.0%) | 0 (0.0%) |
| $1,000,000 or more | 0 (0.0%) | 7 (1.8%) |
| Total | 128 (100.0%) | 399 (100.0%) |
Household Income by Mortgage Status in Lake Don Pedro
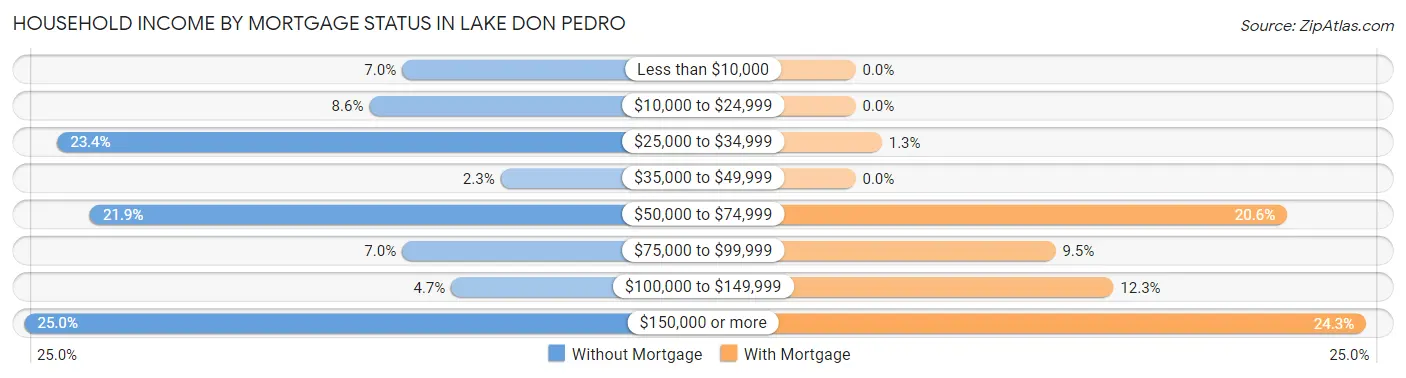
| Household Income | Without Mortgage | With Mortgage |
| Less than $10,000 | 9 (7.0%) | 0 (0.0%) |
| $10,000 to $24,999 | 11 (8.6%) | 0 (0.0%) |
| $25,000 to $34,999 | 30 (23.4%) | 5 (1.3%) |
| $35,000 to $49,999 | 3 (2.3%) | 0 (0.0%) |
| $50,000 to $74,999 | 28 (21.9%) | 82 (20.5%) |
| $75,000 to $99,999 | 9 (7.0%) | 38 (9.5%) |
| $100,000 to $149,999 | 6 (4.7%) | 49 (12.3%) |
| $150,000 or more | 32 (25.0%) | 97 (24.3%) |
| Total | 128 (100.0%) | 399 (100.0%) |
Property Value to Household Income Ratio in Lake Don Pedro
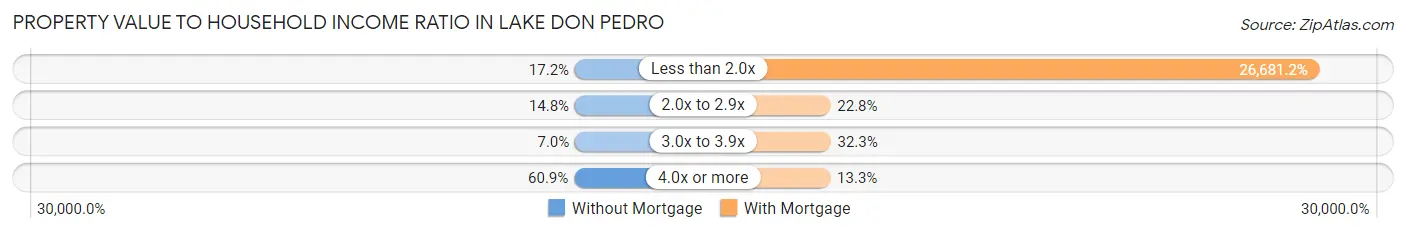
| Value-to-Income Ratio | Without Mortgage | With Mortgage |
| Less than 2.0x | 22 (17.2%) | 106,458 (26,681.2%) |
| 2.0x to 2.9x | 19 (14.8%) | 91 (22.8%) |
| 3.0x to 3.9x | 9 (7.0%) | 129 (32.3%) |
| 4.0x or more | 78 (60.9%) | 53 (13.3%) |
| Total | 128 (100.0%) | 399 (100.0%) |
Real Estate Taxes by Mortgage Status in Lake Don Pedro
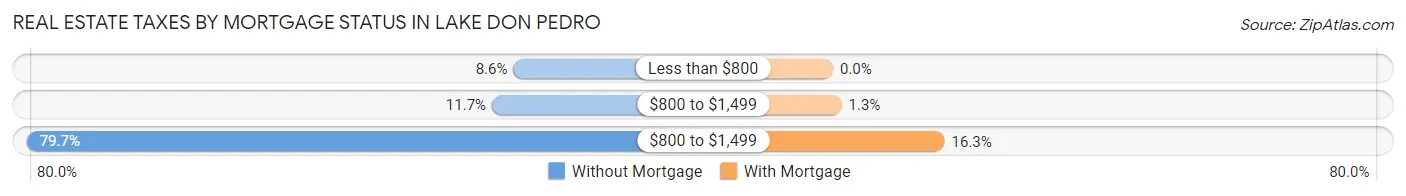
| Property Taxes | Without Mortgage | With Mortgage |
| Less than $800 | 11 (8.6%) | 0 (0.0%) |
| $800 to $1,499 | 15 (11.7%) | 5 (1.3%) |
| $800 to $1,499 | 102 (79.7%) | 65 (16.3%) |
| Total | 128 (100.0%) | 399 (100.0%) |
Health & Disability in Lake Don Pedro
Health Insurance Coverage by Age in Lake Don Pedro
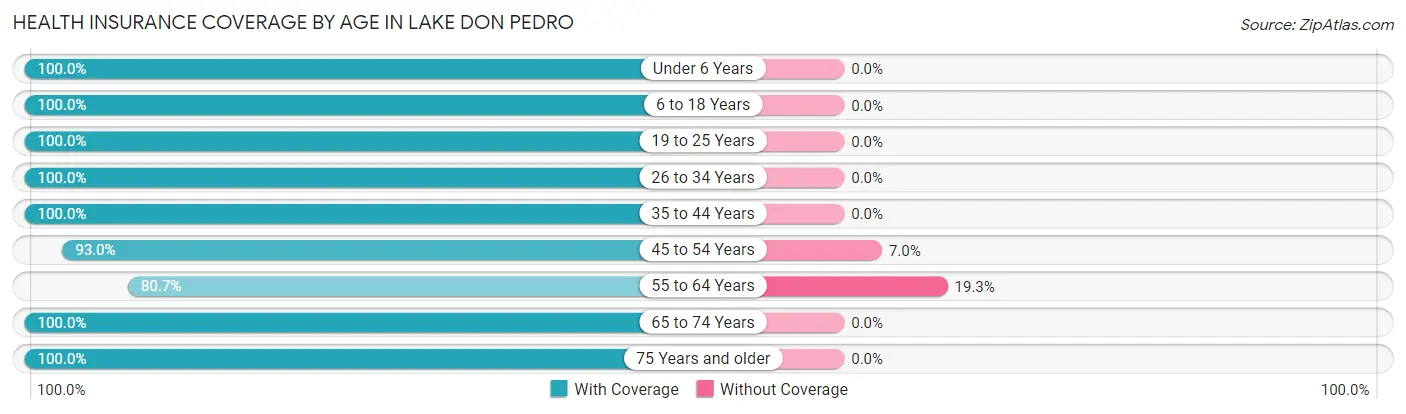
| Age Bracket | With Coverage | Without Coverage |
| Under 6 Years | 15 (100.0%) | 0 (0.0%) |
| 6 to 18 Years | 104 (100.0%) | 0 (0.0%) |
| 19 to 25 Years | 32 (100.0%) | 0 (0.0%) |
| 26 to 34 Years | 39 (100.0%) | 0 (0.0%) |
| 35 to 44 Years | 28 (100.0%) | 0 (0.0%) |
| 45 to 54 Years | 119 (93.0%) | 9 (7.0%) |
| 55 to 64 Years | 377 (80.7%) | 90 (19.3%) |
| 65 to 74 Years | 257 (100.0%) | 0 (0.0%) |
| 75 Years and older | 145 (100.0%) | 0 (0.0%) |
| Total | 1,116 (91.8%) | 99 (8.2%) |
Health Insurance Coverage by Citizenship Status in Lake Don Pedro
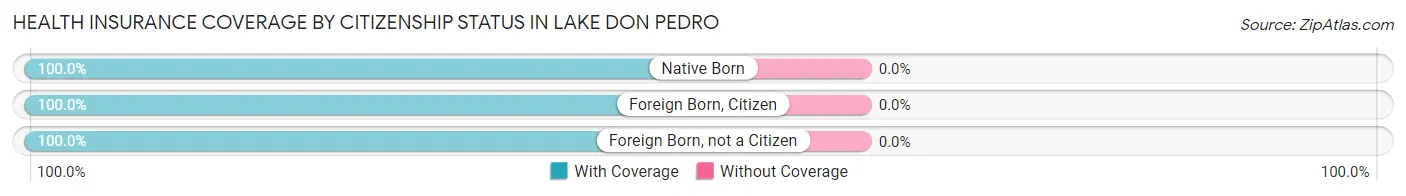
| Citizenship Status | With Coverage | Without Coverage |
| Native Born | 15 (100.0%) | 0 (0.0%) |
| Foreign Born, Citizen | 104 (100.0%) | 0 (0.0%) |
| Foreign Born, not a Citizen | 32 (100.0%) | 0 (0.0%) |
Health Insurance Coverage by Household Income in Lake Don Pedro
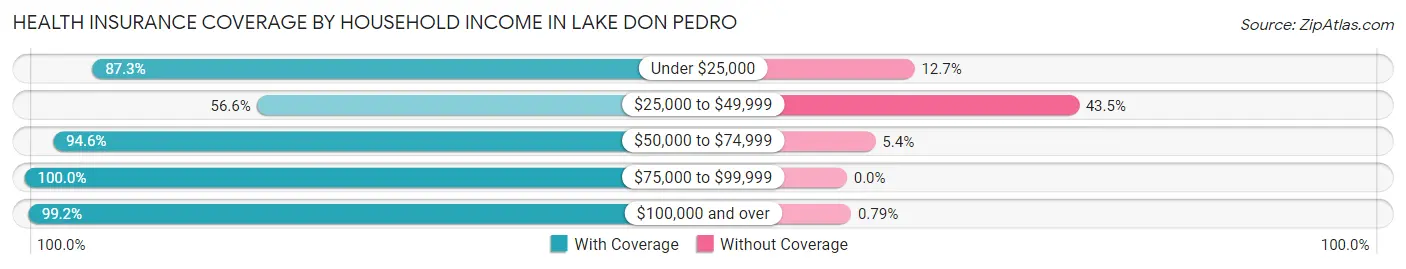
| Household Income | With Coverage | Without Coverage |
| Under $25,000 | 62 (87.3%) | 9 (12.7%) |
| $25,000 to $49,999 | 95 (56.6%) | 73 (43.4%) |
| $50,000 to $74,999 | 212 (94.6%) | 12 (5.4%) |
| $75,000 to $99,999 | 116 (100.0%) | 0 (0.0%) |
| $100,000 and over | 631 (99.2%) | 5 (0.8%) |
Public vs Private Health Insurance Coverage by Age in Lake Don Pedro
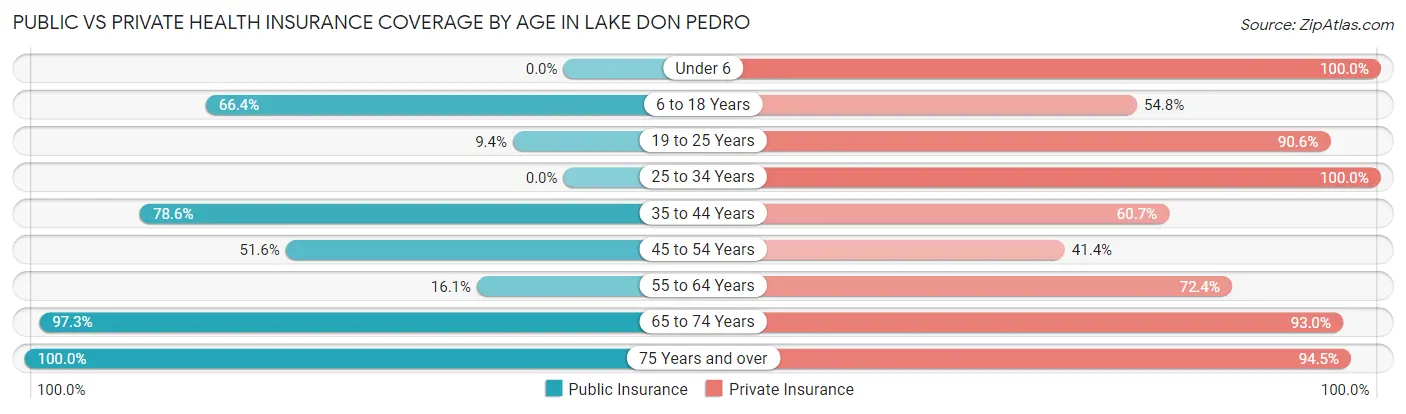
| Age Bracket | Public Insurance | Private Insurance |
| Under 6 | 0 (0.0%) | 15 (100.0%) |
| 6 to 18 Years | 69 (66.3%) | 57 (54.8%) |
| 19 to 25 Years | 3 (9.4%) | 29 (90.6%) |
| 25 to 34 Years | 0 (0.0%) | 39 (100.0%) |
| 35 to 44 Years | 22 (78.6%) | 17 (60.7%) |
| 45 to 54 Years | 66 (51.6%) | 53 (41.4%) |
| 55 to 64 Years | 75 (16.1%) | 338 (72.4%) |
| 65 to 74 Years | 250 (97.3%) | 239 (93.0%) |
| 75 Years and over | 145 (100.0%) | 137 (94.5%) |
| Total | 630 (51.8%) | 924 (76.0%) |
Disability Status by Sex by Age in Lake Don Pedro
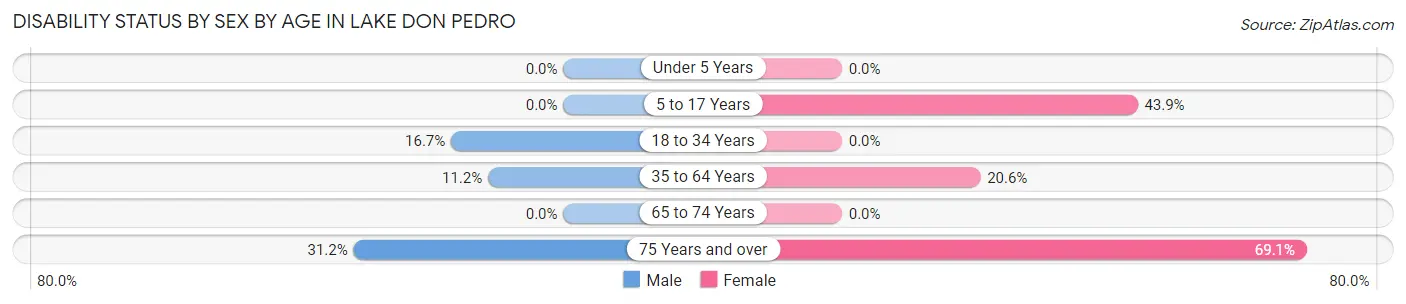
| Age Bracket | Male | Female |
| Under 5 Years | 0 (0.0%) | 0 (0.0%) |
| 5 to 17 Years | 0 (0.0%) | 36 (43.9%) |
| 18 to 34 Years | 3 (16.7%) | 0 (0.0%) |
| 35 to 64 Years | 37 (11.2%) | 60 (20.5%) |
| 65 to 74 Years | 0 (0.0%) | 0 (0.0%) |
| 75 Years and over | 19 (31.1%) | 58 (69.1%) |
Disability Class by Sex by Age in Lake Don Pedro
Disability Class: Hearing Difficulty
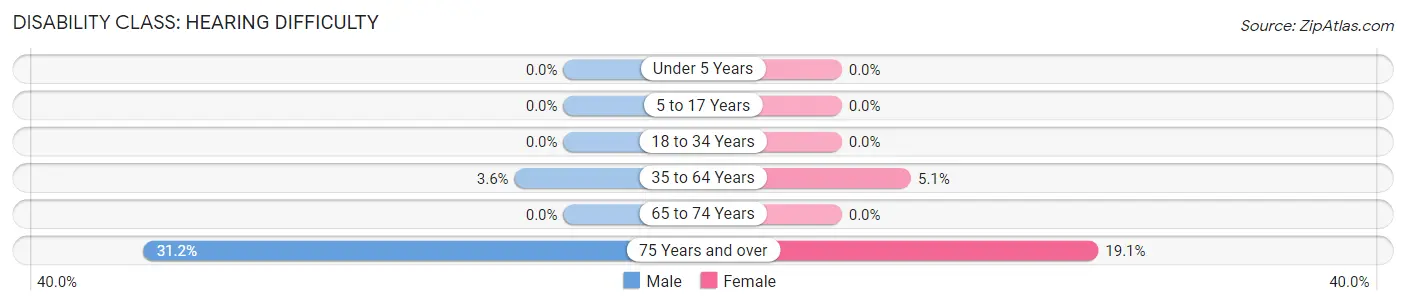
| Age Bracket | Male | Female |
| Under 5 Years | 0 (0.0%) | 0 (0.0%) |
| 5 to 17 Years | 0 (0.0%) | 0 (0.0%) |
| 18 to 34 Years | 0 (0.0%) | 0 (0.0%) |
| 35 to 64 Years | 12 (3.6%) | 15 (5.1%) |
| 65 to 74 Years | 0 (0.0%) | 0 (0.0%) |
| 75 Years and over | 19 (31.1%) | 16 (19.1%) |
Disability Class: Vision Difficulty
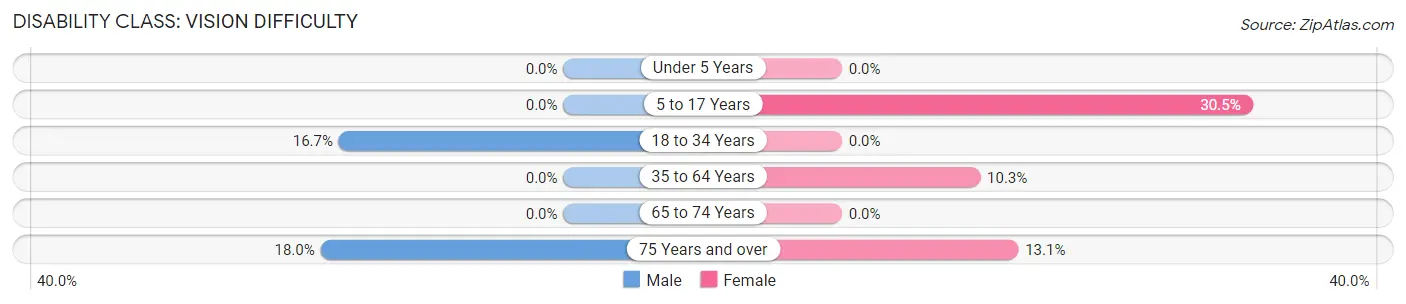
| Age Bracket | Male | Female |
| Under 5 Years | 0 (0.0%) | 0 (0.0%) |
| 5 to 17 Years | 0 (0.0%) | 25 (30.5%) |
| 18 to 34 Years | 3 (16.7%) | 0 (0.0%) |
| 35 to 64 Years | 0 (0.0%) | 30 (10.3%) |
| 65 to 74 Years | 0 (0.0%) | 0 (0.0%) |
| 75 Years and over | 11 (18.0%) | 11 (13.1%) |
Disability Class: Cognitive Difficulty
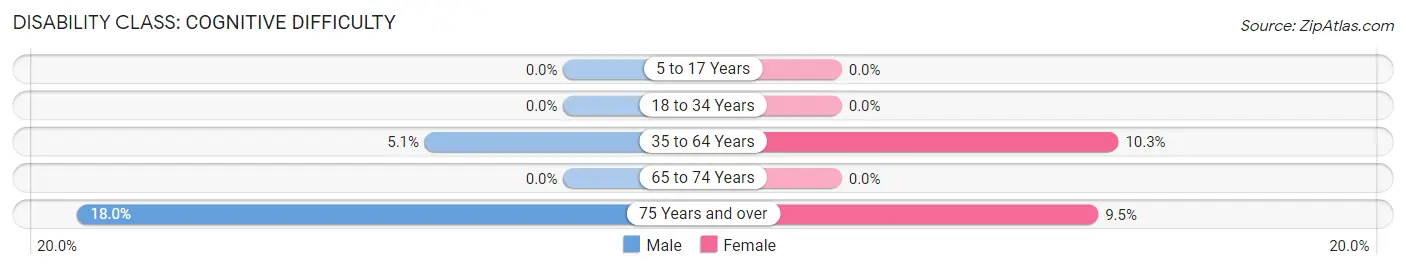
| Age Bracket | Male | Female |
| 5 to 17 Years | 0 (0.0%) | 0 (0.0%) |
| 18 to 34 Years | 0 (0.0%) | 0 (0.0%) |
| 35 to 64 Years | 17 (5.1%) | 30 (10.3%) |
| 65 to 74 Years | 0 (0.0%) | 0 (0.0%) |
| 75 Years and over | 11 (18.0%) | 8 (9.5%) |
Disability Class: Ambulatory Difficulty
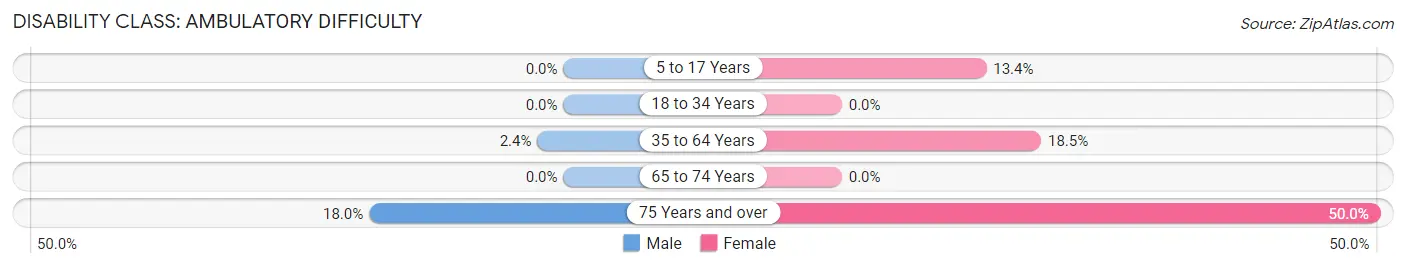
| Age Bracket | Male | Female |
| 5 to 17 Years | 0 (0.0%) | 11 (13.4%) |
| 18 to 34 Years | 0 (0.0%) | 0 (0.0%) |
| 35 to 64 Years | 8 (2.4%) | 54 (18.5%) |
| 65 to 74 Years | 0 (0.0%) | 0 (0.0%) |
| 75 Years and over | 11 (18.0%) | 42 (50.0%) |
Disability Class: Self-Care Difficulty

| Age Bracket | Male | Female |
| 5 to 17 Years | 0 (0.0%) | 0 (0.0%) |
| 18 to 34 Years | 0 (0.0%) | 0 (0.0%) |
| 35 to 64 Years | 16 (4.8%) | 30 (10.3%) |
| 65 to 74 Years | 0 (0.0%) | 0 (0.0%) |
| 75 Years and over | 11 (18.0%) | 8 (9.5%) |
Technology Access in Lake Don Pedro
Computing Device Access in Lake Don Pedro
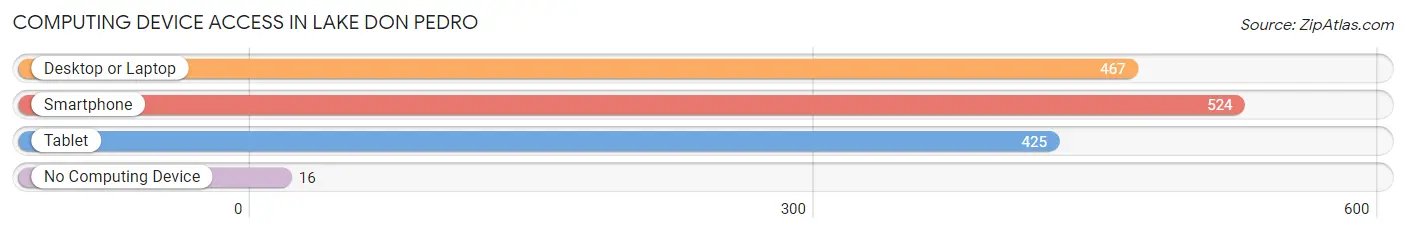
| Device Type | # Households | % Households |
| Desktop or Laptop | 467 | 77.8% |
| Smartphone | 524 | 87.3% |
| Tablet | 425 | 70.8% |
| No Computing Device | 16 | 2.7% |
| Total | 600 | 100.0% |
Internet Access in Lake Don Pedro
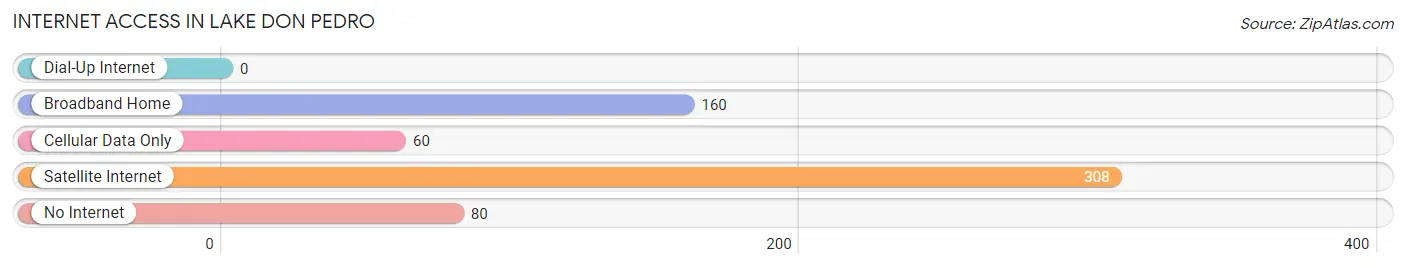
| Internet Type | # Households | % Households |
| Dial-Up Internet | 0 | 0.0% |
| Broadband Home | 160 | 26.7% |
| Cellular Data Only | 60 | 10.0% |
| Satellite Internet | 308 | 51.3% |
| No Internet | 80 | 13.3% |
| Total | 600 | 100.0% |
Lake Don Pedro Summary
Don Pedro is a census-designated place located in Tuolumne County, California. It is situated on the south shore of Lake Don Pedro, a reservoir created by the construction of the New Don Pedro Dam in 1971. The lake is the second largest reservoir in California, and is a popular destination for fishing, boating, and other recreational activities.
History
The area around Lake Don Pedro has a long and varied history. The lake was created by the construction of the New Don Pedro Dam in 1971, which was built to provide hydroelectric power to the region. Prior to the dam's construction, the area was home to the Miwok and Yokut Native American tribes, who lived in the area for thousands of years.
The first European settlers arrived in the area in the mid-1800s, and the town of Don Pedro was established in 1854. The town was named after Don Pedro Fages, a Spanish explorer who explored the area in the late 1700s. The town grew quickly, and by the early 1900s it had become a popular tourist destination.
In the 1950s, the area was chosen as the site for the New Don Pedro Dam, which was completed in 1971. The dam created the lake, which quickly became a popular destination for fishing, boating, and other recreational activities.
Geography
Lake Don Pedro is located in the Sierra Nevada mountain range in Tuolumne County, California. The lake is the second largest reservoir in California, and is surrounded by steep, forested hills. The lake is fed by the Tuolumne River, which originates in the nearby Yosemite National Park.
The lake is approximately 13 miles long and has a maximum depth of over 300 feet. The lake is a popular destination for fishing, boating, and other recreational activities. The lake is also home to a variety of wildlife, including bald eagles, ospreys, and great blue herons.
Economy
The economy of Lake Don Pedro is largely based on tourism and recreation. The lake is a popular destination for fishing, boating, and other recreational activities. The area is also home to several marinas, campgrounds, and resorts.
In addition to tourism and recreation, the area is also home to several small businesses, including restaurants, convenience stores, and gas stations. The area is also home to several wineries, which produce a variety of wines from local grapes.
Demographics
As of the 2010 census, the population of Lake Don Pedro was 1,845. The population is largely white (90.2%), with small percentages of Hispanic (4.2%), Asian (2.2%), and African American (1.2%) residents. The median household income is $50,000, and the median age is 44.
Conclusion
Lake Don Pedro is a census-designated place located in Tuolumne County, California. It is situated on the south shore of Lake Don Pedro, a reservoir created by the construction of the New Don Pedro Dam in 1971. The lake is the second largest reservoir in California, and is a popular destination for fishing, boating, and other recreational activities. The area has a long and varied history, and the economy is largely based on tourism and recreation. The population is largely white, with small percentages of Hispanic, Asian, and African American residents.
Common Questions
What is Per Capita Income in Lake Don Pedro?
Per Capita income in Lake Don Pedro is $50,136.
What is the Median Family Income in Lake Don Pedro?
Median Family Income in Lake Don Pedro is $105,417.
What is the Median Household income in Lake Don Pedro?
Median Household Income in Lake Don Pedro is $87,955.
What is Income or Wage Gap in Lake Don Pedro?
Income or Wage Gap in Lake Don Pedro is 14.5%.
Women in Lake Don Pedro earn 85.5 cents for every dollar earned by a man.
What is Inequality or Gini Index in Lake Don Pedro?
Inequality or Gini Index in Lake Don Pedro is 0.37.
What is the Total Population of Lake Don Pedro?
Total Population of Lake Don Pedro is 1,215.
What is the Total Male Population of Lake Don Pedro?
Total Male Population of Lake Don Pedro is 563.
What is the Total Female Population of Lake Don Pedro?
Total Female Population of Lake Don Pedro is 652.
What is the Ratio of Males per 100 Females in Lake Don Pedro?
There are 86.35 Males per 100 Females in Lake Don Pedro.
What is the Ratio of Females per 100 Males in Lake Don Pedro?
There are 115.81 Females per 100 Males in Lake Don Pedro.
What is the Median Population Age in Lake Don Pedro?
Median Population Age in Lake Don Pedro is 59.4 Years.
What is the Average Family Size in Lake Don Pedro
Average Family Size in Lake Don Pedro is 2.2 People.
What is the Average Household Size in Lake Don Pedro
Average Household Size in Lake Don Pedro is 2.0 People.
How Large is the Labor Force in Lake Don Pedro?
There are 541 People in the Labor Forcein in Lake Don Pedro.
What is the Percentage of People in the Labor Force in Lake Don Pedro?
48.4% of People are in the Labor Force in Lake Don Pedro.
What is the Unemployment Rate in Lake Don Pedro?
Unemployment Rate in Lake Don Pedro is 3.5%.