Los Alamos, CA Map & Demographics
Los Alamos Map
Los Alamos Overview
$47,661
PER CAPITA INCOME
$46,930
AVG HOUSEHOLD INCOME
0.48
INEQUALITY / GINI INDEX
834
TOTAL POPULATION
319
MALE POPULATION
515
FEMALE POPULATION
61.94
MALES / 100 FEMALES
161.44
FEMALES / 100 MALES
68.3
MEDIAN AGE
2.6
AVG FAMILY SIZE
1.9
AVG HOUSEHOLD SIZE
431
LABOR FORCE [ PEOPLE ]
56.6%
PERCENT IN LABOR FORCE
6.7%
UNEMPLOYMENT RATE
Los Alamos Zip Codes
Income in Los Alamos
Income Overview in Los Alamos
| Characteristic | Number | Measure |
| Per Capita Income | 834 | $47,661 |
| Median Family Income | 237 | $0 |
| Mean Family Income | 237 | $100,771 |
| Median Household Income | 424 | $46,930 |
| Mean Household Income | 424 | $91,481 |
| Income Deficit | 237 | $0 |
| Wage / Income Gap (%) | 834 | 0.00% |
| Wage / Income Gap ($) | 834 | 100.00¢ per $1 |
| Gini / Inequality Index | 834 | 0.48 |
Earnings by Sex in Los Alamos
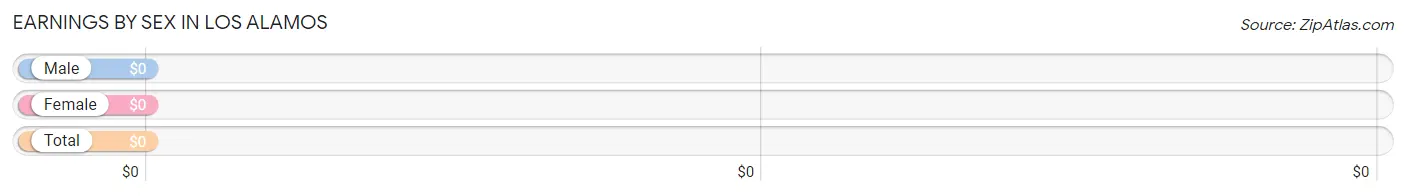
| Sex | Number | Average Earnings |
| Male | 192 (45.3%) | $0 |
| Female | 232 (54.7%) | $0 |
| Total | 424 (100.0%) | $0 |
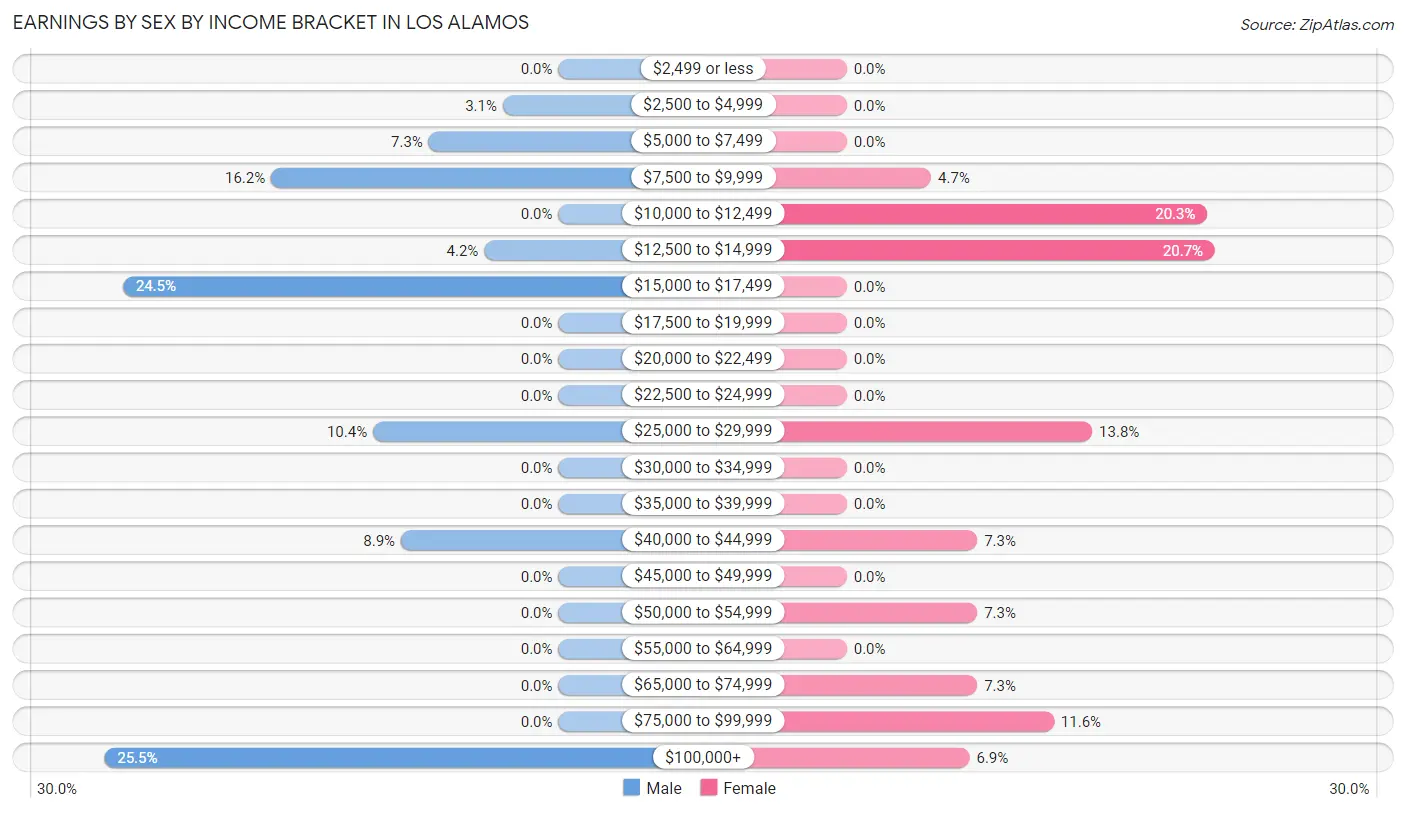
Earnings by Sex by Income Bracket in Los Alamos
The most common earnings brackets in Los Alamos are $100,000+ for men (49 | 25.5%) and $12,500 to $14,999 for women (48 | 20.7%).
| Income | Male | Female |
| $2,499 or less | 0 (0.0%) | 0 (0.0%) |
| $2,500 to $4,999 | 6 (3.1%) | 0 (0.0%) |
| $5,000 to $7,499 | 14 (7.3%) | 0 (0.0%) |
| $7,500 to $9,999 | 31 (16.2%) | 11 (4.7%) |
| $10,000 to $12,499 | 0 (0.0%) | 47 (20.3%) |
| $12,500 to $14,999 | 8 (4.2%) | 48 (20.7%) |
| $15,000 to $17,499 | 47 (24.5%) | 0 (0.0%) |
| $17,500 to $19,999 | 0 (0.0%) | 0 (0.0%) |
| $20,000 to $22,499 | 0 (0.0%) | 0 (0.0%) |
| $22,500 to $24,999 | 0 (0.0%) | 0 (0.0%) |
| $25,000 to $29,999 | 20 (10.4%) | 32 (13.8%) |
| $30,000 to $34,999 | 0 (0.0%) | 0 (0.0%) |
| $35,000 to $39,999 | 0 (0.0%) | 0 (0.0%) |
| $40,000 to $44,999 | 17 (8.8%) | 17 (7.3%) |
| $45,000 to $49,999 | 0 (0.0%) | 0 (0.0%) |
| $50,000 to $54,999 | 0 (0.0%) | 17 (7.3%) |
| $55,000 to $64,999 | 0 (0.0%) | 0 (0.0%) |
| $65,000 to $74,999 | 0 (0.0%) | 17 (7.3%) |
| $75,000 to $99,999 | 0 (0.0%) | 27 (11.6%) |
| $100,000+ | 49 (25.5%) | 16 (6.9%) |
| Total | 192 (100.0%) | 232 (100.0%) |
Earnings by Sex by Educational Attainment in Los Alamos
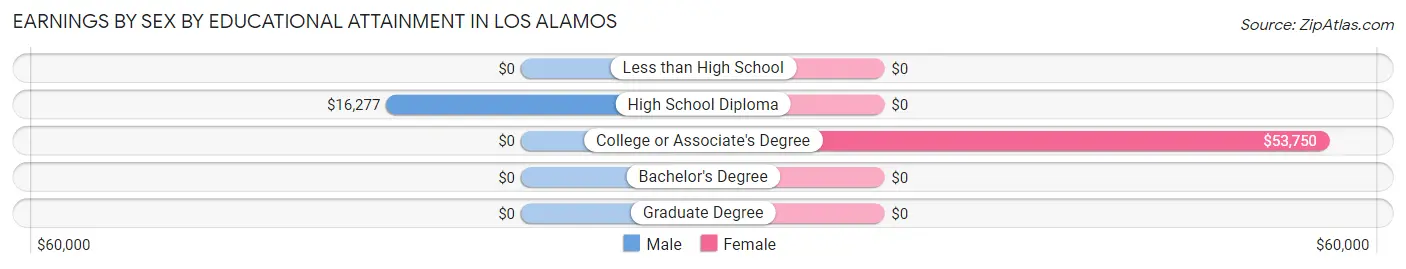
| Educational Attainment | Male Income | Female Income |
| Less than High School | - | - |
| High School Diploma | $16,277 | $0 |
| College or Associate's Degree | - | - |
| Bachelor's Degree | - | - |
| Graduate Degree | - | - |
| Total | - | - |
Family Income in Los Alamos
Family Income Brackets in Los Alamos
According to the Los Alamos family income data, there are 73 families falling into the $35,000 to $49,999 income range, which is the most common income bracket and makes up 30.8% of all families.
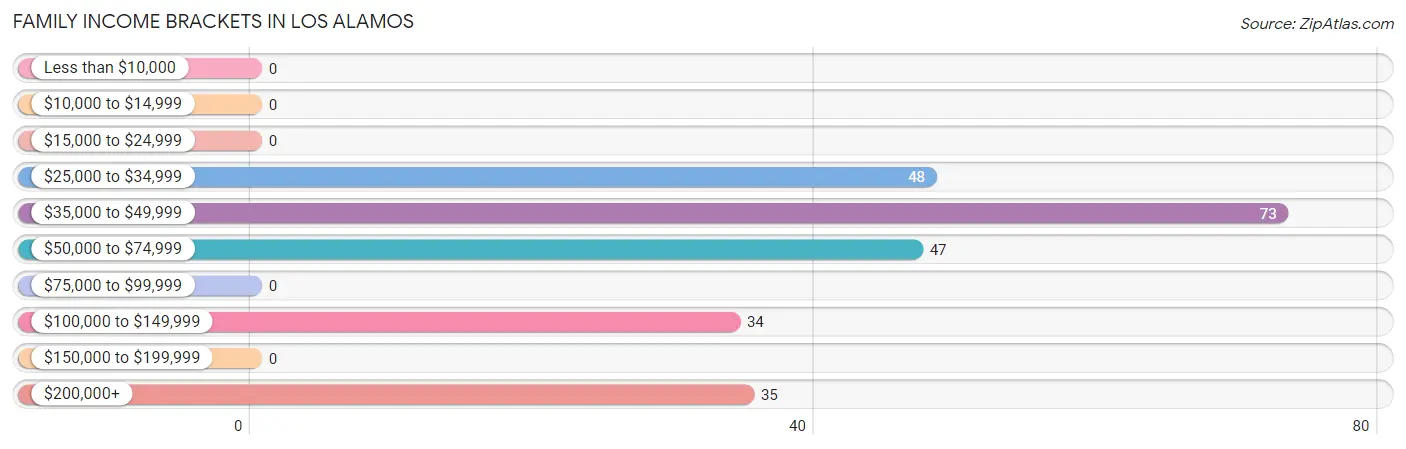
| Income Bracket | # Families | % Families |
| Less than $10,000 | 0 | 0.0% |
| $10,000 to $14,999 | 0 | 0.0% |
| $15,000 to $24,999 | 0 | 0.0% |
| $25,000 to $34,999 | 48 | 20.3% |
| $35,000 to $49,999 | 73 | 30.8% |
| $50,000 to $74,999 | 47 | 19.8% |
| $75,000 to $99,999 | 0 | 0.0% |
| $100,000 to $149,999 | 34 | 14.3% |
| $150,000 to $199,999 | 0 | 0.0% |
| $200,000+ | 35 | 14.8% |
Family Income by Famaliy Size in Los Alamos
2-person families (185 | 78.1%) account for the highest median family income in Los Alamos with $46,250 per family, while 2-person families (185 | 78.1%) have the highest median income of $23,125 per family member.
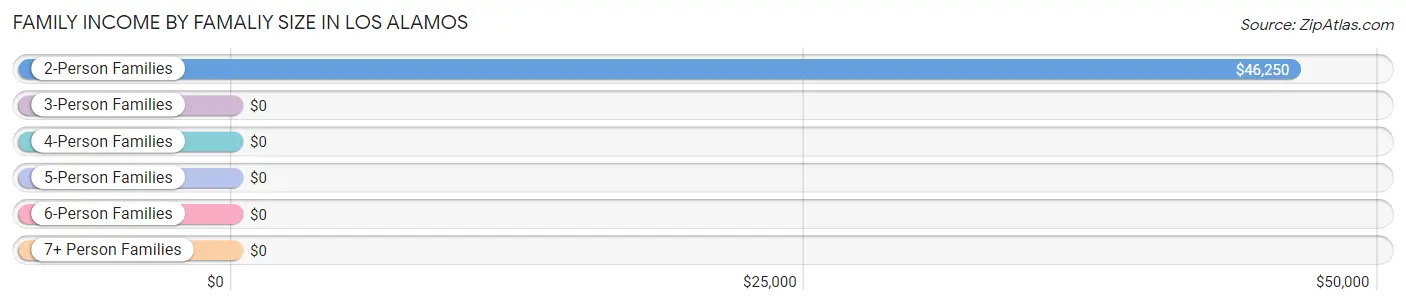
| Income Bracket | # Families | Median Income |
| 2-Person Families | 185 (78.1%) | $46,250 |
| 3-Person Families | 14 (5.9%) | $0 |
| 4-Person Families | 0 (0.0%) | $0 |
| 5-Person Families | 38 (16.0%) | $0 |
| 6-Person Families | 0 (0.0%) | $0 |
| 7+ Person Families | 0 (0.0%) | $0 |
| Total | 237 (100.0%) | $0 |
Family Income by Number of Earners in Los Alamos
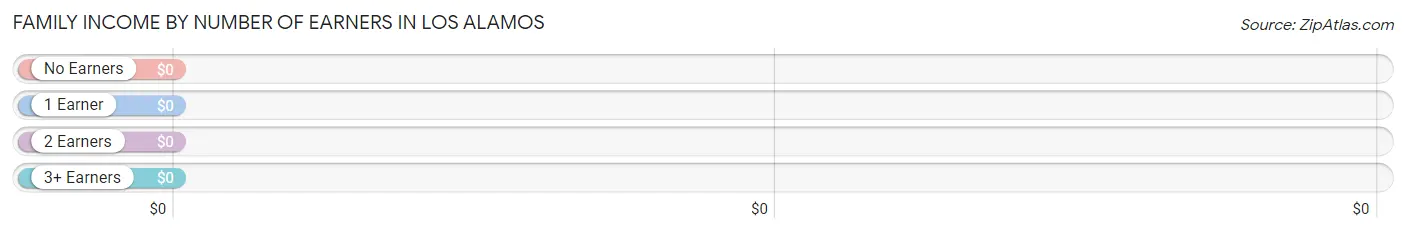
| Number of Earners | # Families | Median Income |
| No Earners | 57 (24.0%) | $0 |
| 1 Earner | 63 (26.6%) | $0 |
| 2 Earners | 86 (36.3%) | $0 |
| 3+ Earners | 31 (13.1%) | $0 |
| Total | 237 (100.0%) | $0 |
Household Income in Los Alamos
Household Income Brackets in Los Alamos
With 159 households falling in the category, the $35,000 to $49,999 income range is the most frequent in Los Alamos, accounting for 37.5% of all households.
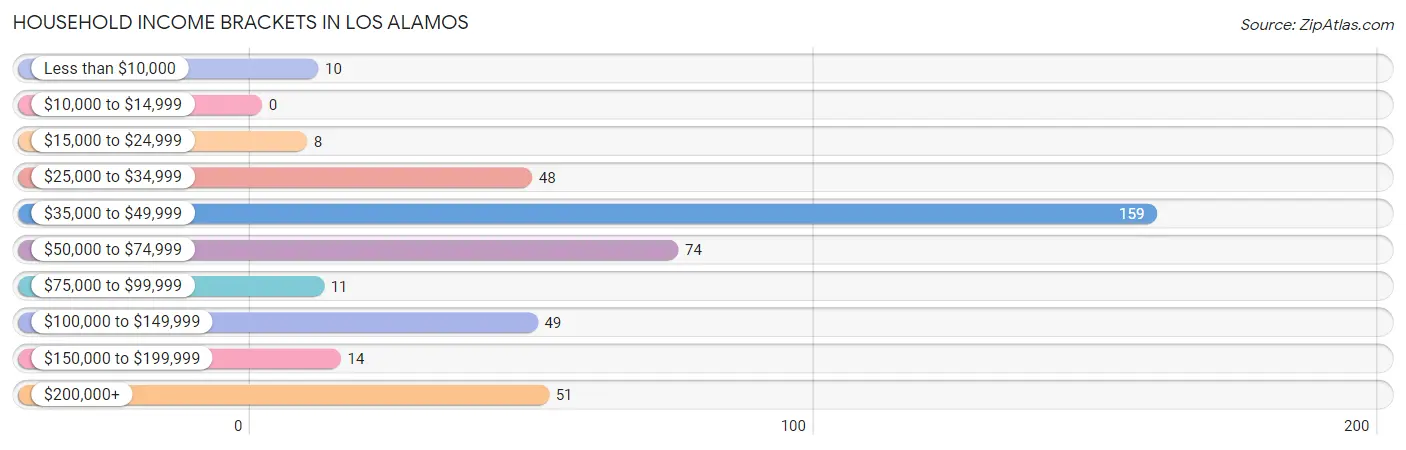
| Income Bracket | # Households | % Households |
| Less than $10,000 | 10 | 2.4% |
| $10,000 to $14,999 | 0 | 0.0% |
| $15,000 to $24,999 | 8 | 1.9% |
| $25,000 to $34,999 | 48 | 11.3% |
| $35,000 to $49,999 | 159 | 37.5% |
| $50,000 to $74,999 | 74 | 17.5% |
| $75,000 to $99,999 | 11 | 2.6% |
| $100,000 to $149,999 | 49 | 11.6% |
| $150,000 to $199,999 | 14 | 3.3% |
| $200,000+ | 51 | 12.0% |
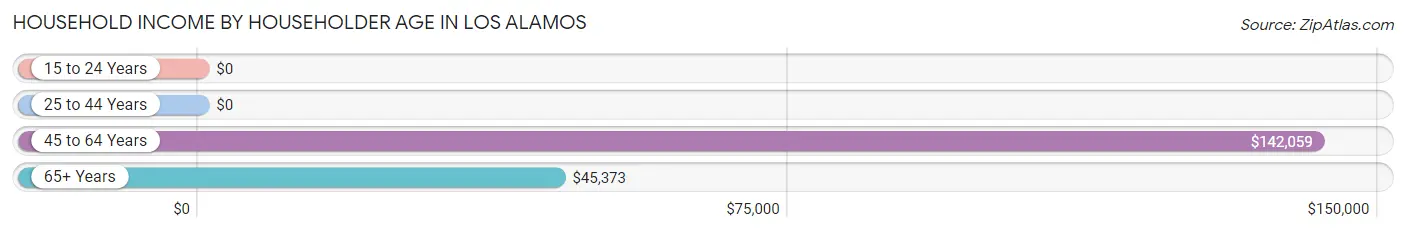
Household Income by Householder Age in Los Alamos
The median household income in Los Alamos is $46,930, with the highest median household income of $142,059 found in the 45 to 64 years age bracket for the primary householder. A total of 66 households (15.6%) fall into this category.
| Income Bracket | # Households | Median Income |
| 15 to 24 Years | 0 (0.0%) | $0 |
| 25 to 44 Years | 21 (5.0%) | $0 |
| 45 to 64 Years | 66 (15.6%) | $142,059 |
| 65+ Years | 337 (79.5%) | $45,373 |
| Total | 424 (100.0%) | $46,930 |
Poverty in Los Alamos
Income Below Poverty by Sex and Age in Los Alamos
With 6.3% poverty level for males and 1.9% for females among the residents of Los Alamos, 25 to 34 year old males and 75 year old and over females are the most vulnerable to poverty, with 14 males (100.0%) and 10 females (10.7%) in their respective age groups living below the poverty level.
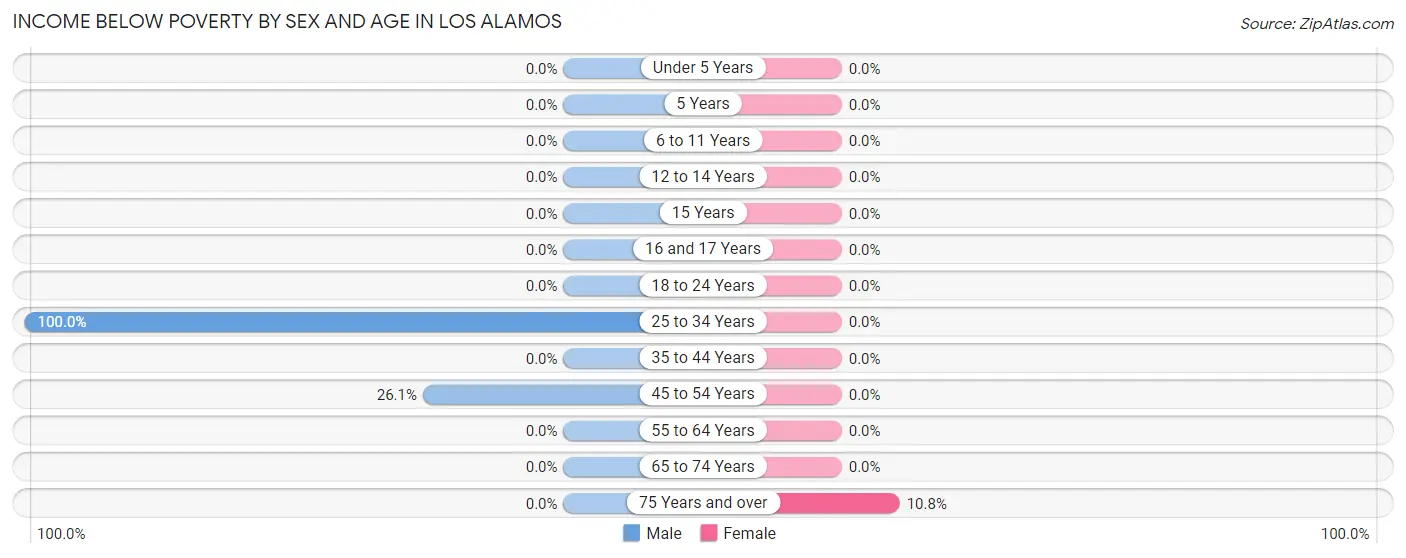
| Age Bracket | Male | Female |
| Under 5 Years | 0 (0.0%) | 0 (0.0%) |
| 5 Years | 0 (0.0%) | 0 (0.0%) |
| 6 to 11 Years | 0 (0.0%) | 0 (0.0%) |
| 12 to 14 Years | 0 (0.0%) | 0 (0.0%) |
| 15 Years | 0 (0.0%) | 0 (0.0%) |
| 16 and 17 Years | 0 (0.0%) | 0 (0.0%) |
| 18 to 24 Years | 0 (0.0%) | 0 (0.0%) |
| 25 to 34 Years | 14 (100.0%) | 0 (0.0%) |
| 35 to 44 Years | 0 (0.0%) | 0 (0.0%) |
| 45 to 54 Years | 6 (26.1%) | 0 (0.0%) |
| 55 to 64 Years | 0 (0.0%) | 0 (0.0%) |
| 65 to 74 Years | 0 (0.0%) | 0 (0.0%) |
| 75 Years and over | 0 (0.0%) | 10 (10.7%) |
| Total | 20 (6.3%) | 10 (1.9%) |
Income Above Poverty by Sex and Age in Los Alamos
According to the poverty statistics in Los Alamos, males aged 18 to 24 years and females aged under 5 years are the age groups that are most secure financially, with 100.0% of males and 100.0% of females in these age groups living above the poverty line.
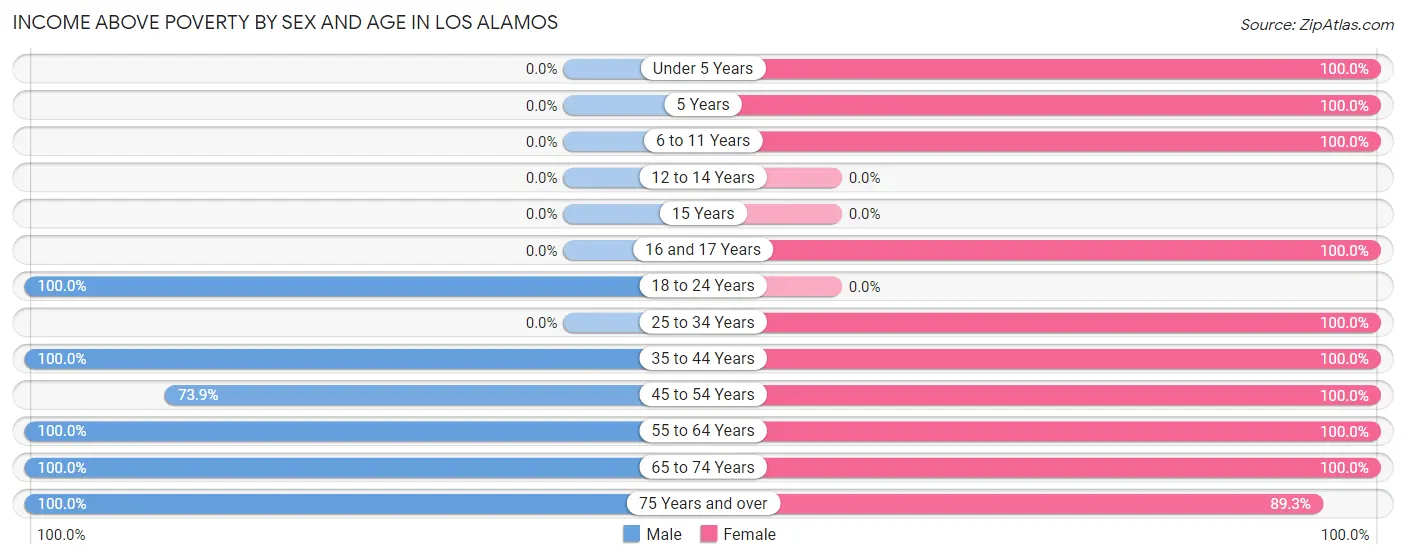
| Age Bracket | Male | Female |
| Under 5 Years | 0 (0.0%) | 24 (100.0%) |
| 5 Years | 0 (0.0%) | 24 (100.0%) |
| 6 to 11 Years | 0 (0.0%) | 24 (100.0%) |
| 12 to 14 Years | 0 (0.0%) | 0 (0.0%) |
| 15 Years | 0 (0.0%) | 0 (0.0%) |
| 16 and 17 Years | 0 (0.0%) | 18 (100.0%) |
| 18 to 24 Years | 31 (100.0%) | 0 (0.0%) |
| 25 to 34 Years | 0 (0.0%) | 33 (100.0%) |
| 35 to 44 Years | 21 (100.0%) | 27 (100.0%) |
| 45 to 54 Years | 17 (73.9%) | 33 (100.0%) |
| 55 to 64 Years | 36 (100.0%) | 81 (100.0%) |
| 65 to 74 Years | 124 (100.0%) | 158 (100.0%) |
| 75 Years and over | 70 (100.0%) | 83 (89.2%) |
| Total | 299 (93.7%) | 505 (98.1%) |
Income Below Poverty Among Married-Couple Families in Los Alamos
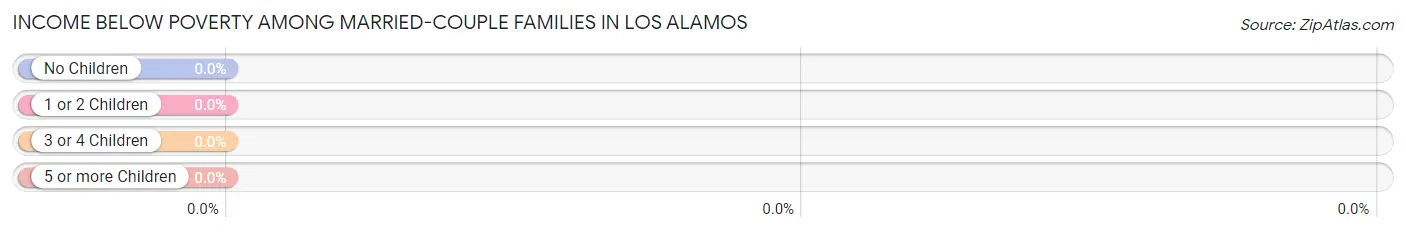
| Children | Above Poverty | Below Poverty |
| No Children | 119 (100.0%) | 0 (0.0%) |
| 1 or 2 Children | 0 (0.0%) | 0 (0.0%) |
| 3 or 4 Children | 21 (100.0%) | 0 (0.0%) |
| 5 or more Children | 0 (0.0%) | 0 (0.0%) |
| Total | 140 (100.0%) | 0 (0.0%) |
Income Below Poverty Among Single-Parent Households in Los Alamos
| Children | Single Father | Single Mother |
| No Children | 0 (0.0%) | 0 (0.0%) |
| 1 or 2 Children | 0 (0.0%) | 0 (0.0%) |
| 3 or 4 Children | 0 (0.0%) | 0 (0.0%) |
| 5 or more Children | 0 (0.0%) | 0 (0.0%) |
| Total | 0 (0.0%) | 0 (0.0%) |
Income Below Poverty Among Married-Couple vs Single-Parent Households in Los Alamos
| Children | Married-Couple Families | Single-Parent Households |
| No Children | 0 (0.0%) | 0 (0.0%) |
| 1 or 2 Children | 0 (0.0%) | 0 (0.0%) |
| 3 or 4 Children | 0 (0.0%) | 0 (0.0%) |
| 5 or more Children | 0 (0.0%) | 0 (0.0%) |
| Total | 0 (0.0%) | 0 (0.0%) |
Race in Los Alamos
The most populous races in Los Alamos are White / Caucasian (607 | 72.8%), Two or more Races (116 | 13.9%), and Hispanic or Latino (68 | 8.2%).
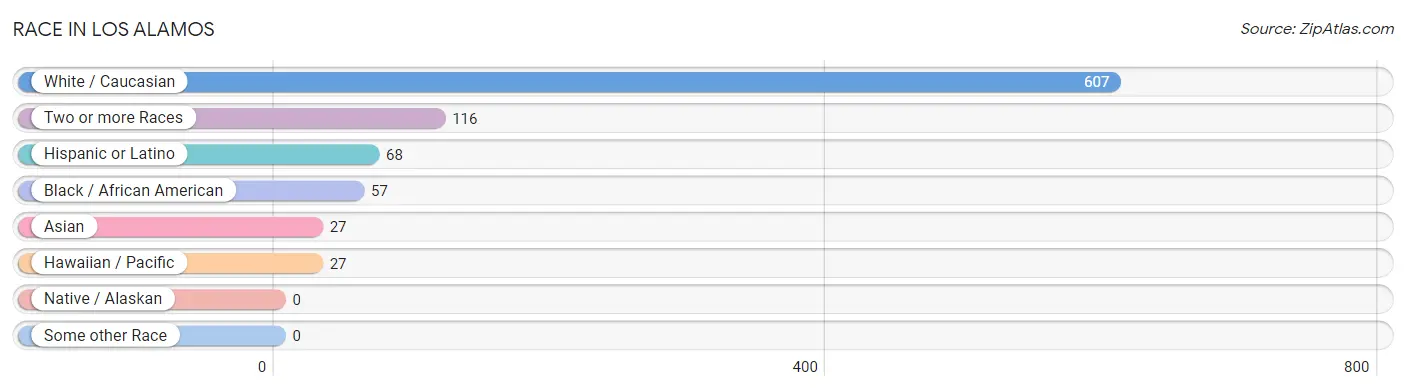
| Race | # Population | % Population |
| Asian | 27 | 3.2% |
| Black / African American | 57 | 6.8% |
| Hawaiian / Pacific | 27 | 3.2% |
| Hispanic or Latino | 68 | 8.2% |
| Native / Alaskan | 0 | 0.0% |
| White / Caucasian | 607 | 72.8% |
| Two or more Races | 116 | 13.9% |
| Some other Race | 0 | 0.0% |
| Total | 834 | 100.0% |
Ancestry in Los Alamos
The most populous ancestries reported in Los Alamos are English (223 | 26.7%), Italian (174 | 20.9%), Native Hawaiian (99 | 11.9%), German (73 | 8.7%), and Scotch-Irish (64 | 7.7%), together accounting for 75.9% of all Los Alamos residents.
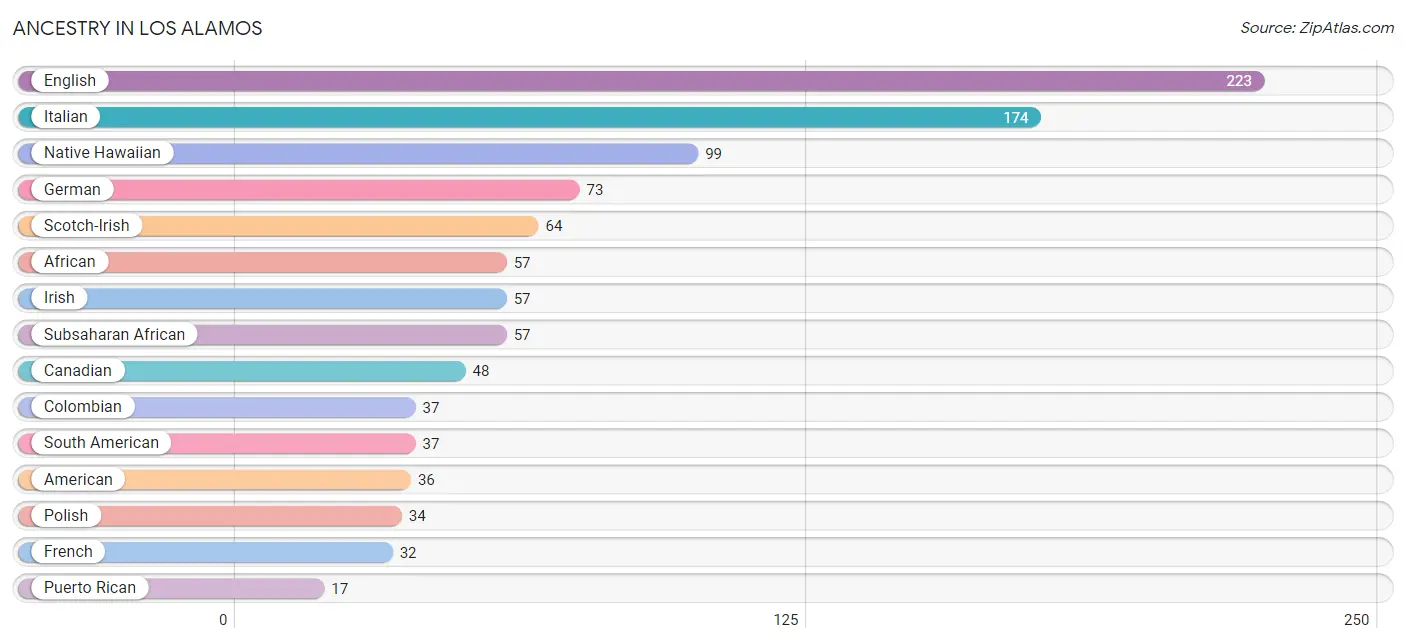
| Ancestry | # Population | % Population |
| African | 57 | 6.8% |
| American | 36 | 4.3% |
| Bhutanese | 16 | 1.9% |
| Bulgarian | 14 | 1.7% |
| Canadian | 48 | 5.8% |
| Colombian | 37 | 4.4% |
| English | 223 | 26.7% |
| European | 6 | 0.7% |
| French | 32 | 3.8% |
| German | 73 | 8.7% |
| Irish | 57 | 6.8% |
| Italian | 174 | 20.9% |
| Korean | 11 | 1.3% |
| Mexican | 14 | 1.7% |
| Native Hawaiian | 99 | 11.9% |
| Polish | 34 | 4.1% |
| Puerto Rican | 17 | 2.0% |
| Scotch-Irish | 64 | 7.7% |
| South American | 37 | 4.4% |
| Subsaharan African | 57 | 6.8% |
| Swedish | 8 | 1.0% | View All 21 Rows |
Immigrants in Los Alamos
The most numerous immigrant groups reported in Los Alamos came from Latin America (51 | 6.1%), Canada (48 | 5.8%), Europe (47 | 5.6%), Italy (47 | 5.6%), and Southern Europe (47 | 5.6%), together accounting for 28.8% of all Los Alamos residents.
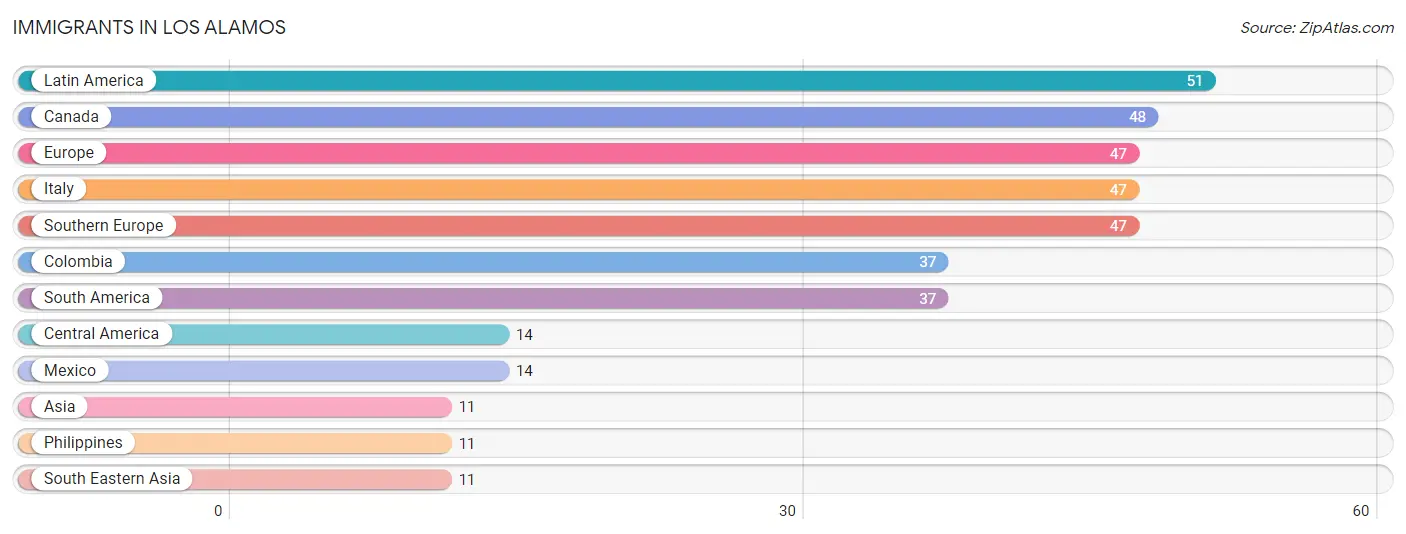
| Immigration Origin | # Population | % Population |
| Asia | 11 | 1.3% |
| Canada | 48 | 5.8% |
| Central America | 14 | 1.7% |
| Colombia | 37 | 4.4% |
| Europe | 47 | 5.6% |
| Italy | 47 | 5.6% |
| Latin America | 51 | 6.1% |
| Mexico | 14 | 1.7% |
| Philippines | 11 | 1.3% |
| South America | 37 | 4.4% |
| South Eastern Asia | 11 | 1.3% |
| Southern Europe | 47 | 5.6% | View All 12 Rows |
Sex and Age in Los Alamos
Sex and Age in Los Alamos
The most populous age groups in Los Alamos are 70 to 74 Years (63 | 19.8%) for men and 70 to 74 Years (141 | 27.4%) for women.
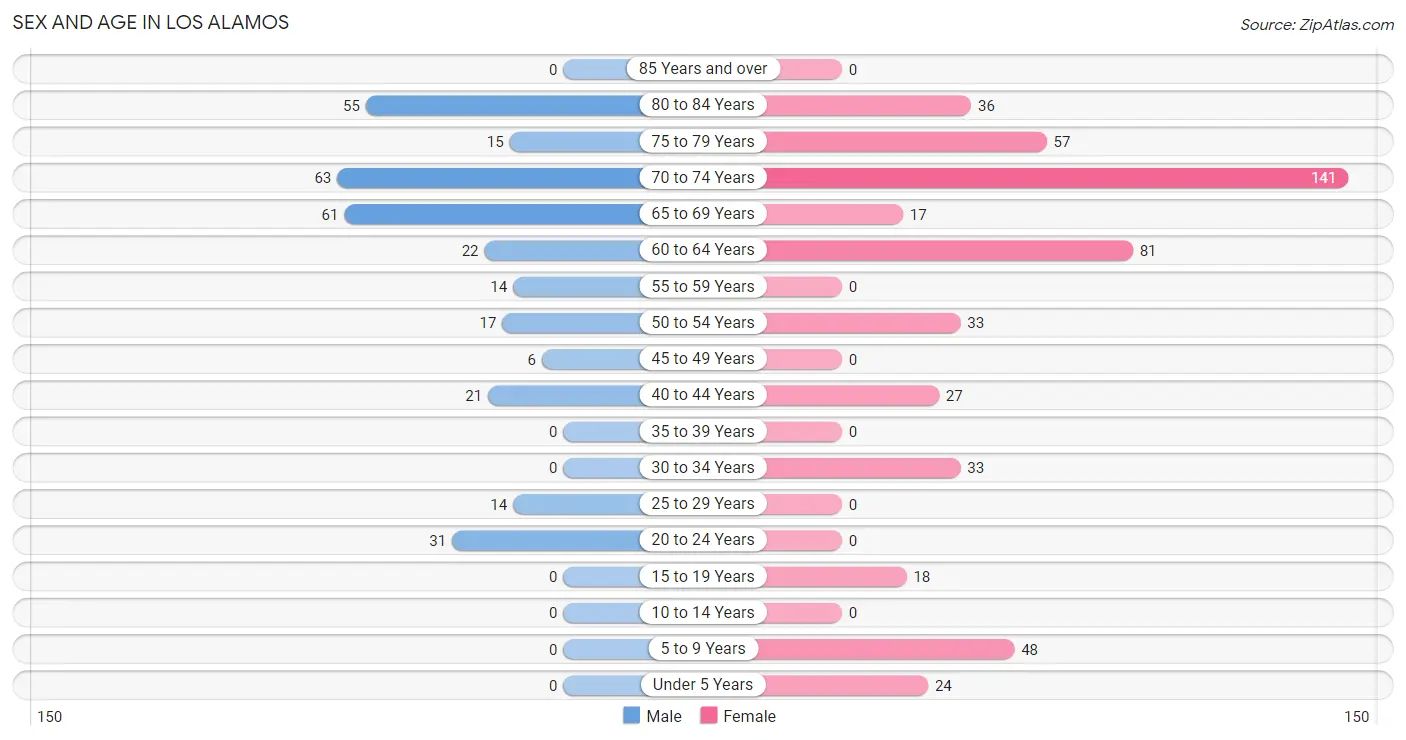
| Age Bracket | Male | Female |
| Under 5 Years | 0 (0.0%) | 24 (4.7%) |
| 5 to 9 Years | 0 (0.0%) | 48 (9.3%) |
| 10 to 14 Years | 0 (0.0%) | 0 (0.0%) |
| 15 to 19 Years | 0 (0.0%) | 18 (3.5%) |
| 20 to 24 Years | 31 (9.7%) | 0 (0.0%) |
| 25 to 29 Years | 14 (4.4%) | 0 (0.0%) |
| 30 to 34 Years | 0 (0.0%) | 33 (6.4%) |
| 35 to 39 Years | 0 (0.0%) | 0 (0.0%) |
| 40 to 44 Years | 21 (6.6%) | 27 (5.2%) |
| 45 to 49 Years | 6 (1.9%) | 0 (0.0%) |
| 50 to 54 Years | 17 (5.3%) | 33 (6.4%) |
| 55 to 59 Years | 14 (4.4%) | 0 (0.0%) |
| 60 to 64 Years | 22 (6.9%) | 81 (15.7%) |
| 65 to 69 Years | 61 (19.1%) | 17 (3.3%) |
| 70 to 74 Years | 63 (19.8%) | 141 (27.4%) |
| 75 to 79 Years | 15 (4.7%) | 57 (11.1%) |
| 80 to 84 Years | 55 (17.2%) | 36 (7.0%) |
| 85 Years and over | 0 (0.0%) | 0 (0.0%) |
| Total | 319 (100.0%) | 515 (100.0%) |
Families and Households in Los Alamos
Median Family Size in Los Alamos
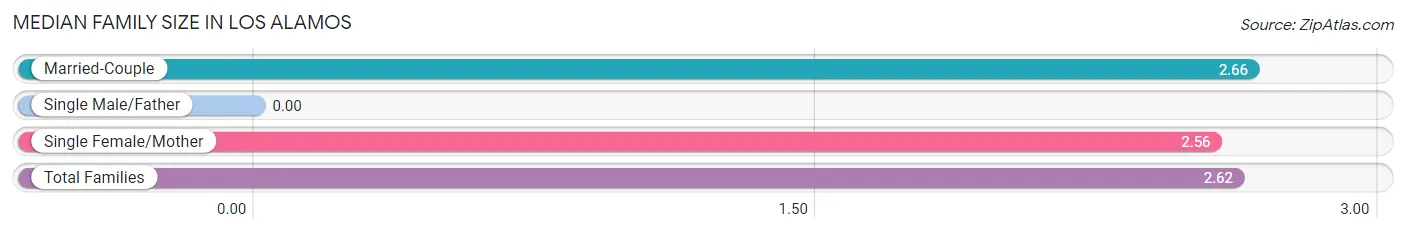
| Family Type | # Families | Family Size |
| Married-Couple | 140 (59.1%) | 2.66 |
| Single Male/Father | 0 (0.0%) | - |
| Single Female/Mother | 97 (40.9%) | 2.56 |
| Total Families | 237 (100.0%) | 2.62 |
Median Household Size in Los Alamos
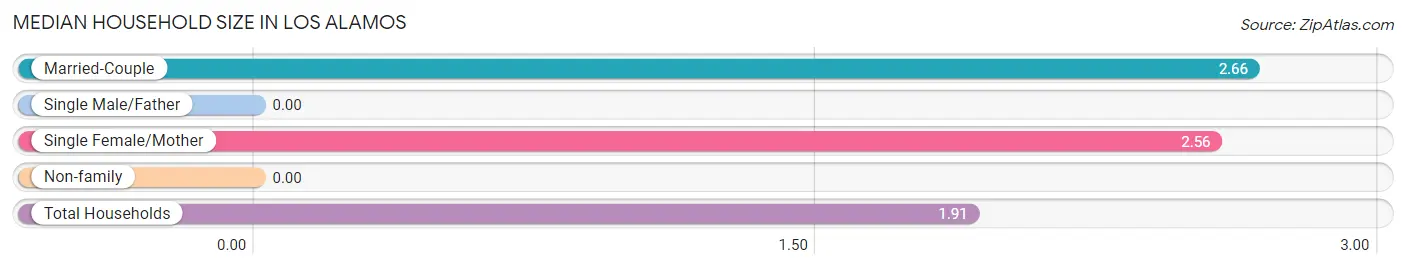
| Household Type | # Households | Household Size |
| Married-Couple | 140 (33.0%) | 2.66 |
| Single Male/Father | 0 (0.0%) | - |
| Single Female/Mother | 97 (22.9%) | 2.56 |
| Non-family | 187 (44.1%) | - |
| Total Households | 424 (100.0%) | 1.91 |
Household Size by Marriage Status in Los Alamos
Out of a total of 424 households in Los Alamos, 237 (55.9%) are family households, while 187 (44.1%) are nonfamily households. The most numerous type of family households are 2-person households, comprising 185, and the most common type of nonfamily households are 1-person households, comprising 187.
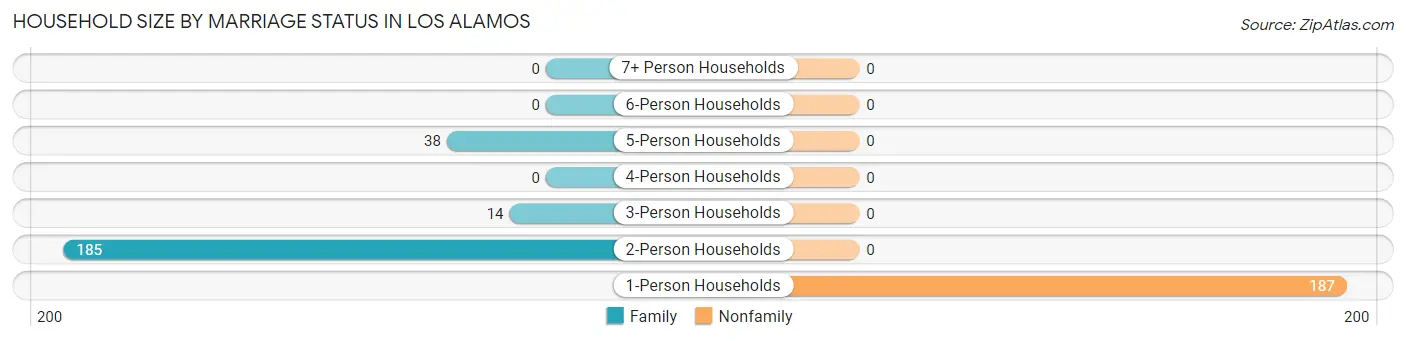
| Household Size | Family Households | Nonfamily Households |
| 1-Person Households | - | 187 (44.1%) |
| 2-Person Households | 185 (43.6%) | 0 (0.0%) |
| 3-Person Households | 14 (3.3%) | 0 (0.0%) |
| 4-Person Households | 0 (0.0%) | 0 (0.0%) |
| 5-Person Households | 38 (9.0%) | 0 (0.0%) |
| 6-Person Households | 0 (0.0%) | 0 (0.0%) |
| 7+ Person Households | 0 (0.0%) | 0 (0.0%) |
| Total | 237 (55.9%) | 187 (44.1%) |
Female Fertility in Los Alamos
Fertility by Age in Los Alamos
| Age Bracket | Women with Births | Births / 1,000 Women |
| 15 to 19 years | 0 (0.0%) | 0.0 |
| 20 to 34 years | 0 (0.0%) | 0.0 |
| 35 to 50 years | 0 (0.0%) | 0.0 |
| Total | 0 (0.0%) | 0.0 |
Fertility by Age by Marriage Status in Los Alamos
| Age Bracket | Married | Unmarried |
| 15 to 19 years | 0 (0.0%) | 0 (0.0%) |
| 20 to 34 years | 0 (0.0%) | 0 (0.0%) |
| 35 to 50 years | 0 (0.0%) | 0 (0.0%) |
| Total | 0 (0.0%) | 0 (0.0%) |
Fertility by Education in Los Alamos
| Educational Attainment | Women with Births | Births / 1,000 Women |
| Less than High School | 0 (0.0%) | 0.0 |
| High School Diploma | 0 (0.0%) | 0.0 |
| College or Associate's Degree | 0 (0.0%) | 0.0 |
| Bachelor's Degree | 0 (0.0%) | 0.0 |
| Graduate Degree | 0 (0.0%) | 0.0 |
| Total | 0 (0.0%) | 0.0 |
Fertility by Education by Marriage Status in Los Alamos
| Educational Attainment | Married | Unmarried |
| Less than High School | 0 (0.0%) | 0 (0.0%) |
| High School Diploma | 0 (0.0%) | 0 (0.0%) |
| College or Associate's Degree | 0 (0.0%) | 0 (0.0%) |
| Bachelor's Degree | 0 (0.0%) | 0 (0.0%) |
| Graduate Degree | 0 (0.0%) | 0 (0.0%) |
| Total | 0 (0.0%) | 0 (0.0%) |
Employment Characteristics in Los Alamos
Employment by Class of Employer in Los Alamos
Among the 402 employed individuals in Los Alamos, private company employees (182 | 45.3%), self-employed (incorporated) (111 | 27.6%), and not-for-profit organizations (67 | 16.7%) make up the most common classes of employment.
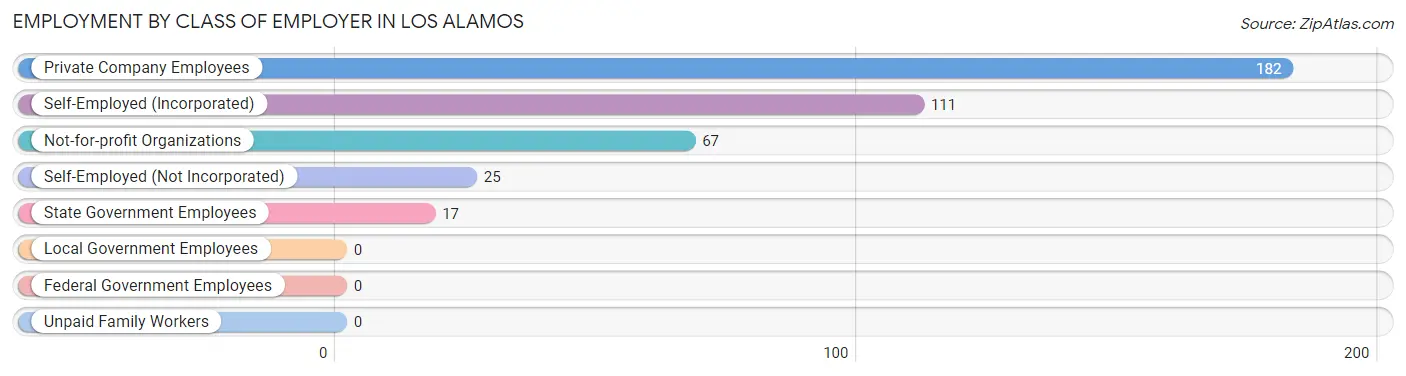
| Employer Class | # Employees | % Employees |
| Private Company Employees | 182 | 45.3% |
| Self-Employed (Incorporated) | 111 | 27.6% |
| Self-Employed (Not Incorporated) | 25 | 6.2% |
| Not-for-profit Organizations | 67 | 16.7% |
| Local Government Employees | 0 | 0.0% |
| State Government Employees | 17 | 4.2% |
| Federal Government Employees | 0 | 0.0% |
| Unpaid Family Workers | 0 | 0.0% |
| Total | 402 | 100.0% |
Employment Status by Age in Los Alamos
According to the labor force statistics for Los Alamos, out of the total population over 16 years of age (762), 56.6% or 431 individuals are in the labor force, with 6.7% or 29 of them unemployed. The age group with the highest labor force participation rate is 20 to 24 years, with 100.0% or 31 individuals in the labor force. Within the labor force, the 65 to 74 years age range has the highest percentage of unemployed individuals, with 15.2% or 29 of them being unemployed.
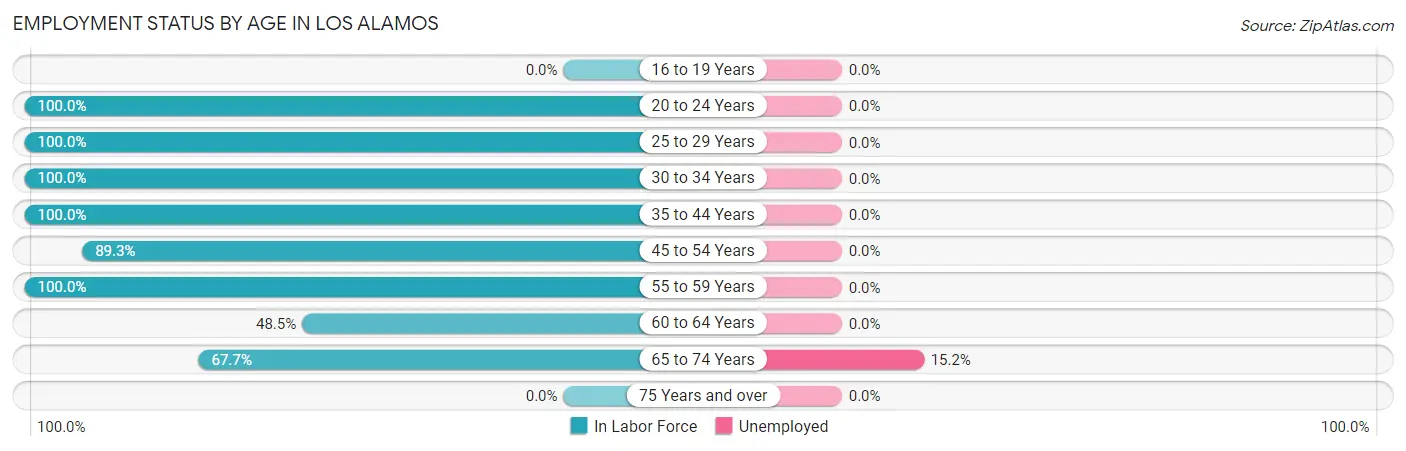
| Age Bracket | In Labor Force | Unemployed |
| 16 to 19 Years | 0 (0.0%) | 0 (0.0%) |
| 20 to 24 Years | 31 (100.0%) | 0 (0.0%) |
| 25 to 29 Years | 14 (100.0%) | 0 (0.0%) |
| 30 to 34 Years | 33 (100.0%) | 0 (0.0%) |
| 35 to 44 Years | 48 (100.0%) | 0 (0.0%) |
| 45 to 54 Years | 50 (89.3%) | 0 (0.0%) |
| 55 to 59 Years | 14 (100.0%) | 0 (0.0%) |
| 60 to 64 Years | 50 (48.5%) | 0 (0.0%) |
| 65 to 74 Years | 191 (67.7%) | 29 (15.2%) |
| 75 Years and over | 0 (0.0%) | 0 (0.0%) |
| Total | 431 (56.6%) | 29 (6.7%) |
Employment Status by Educational Attainment in Los Alamos
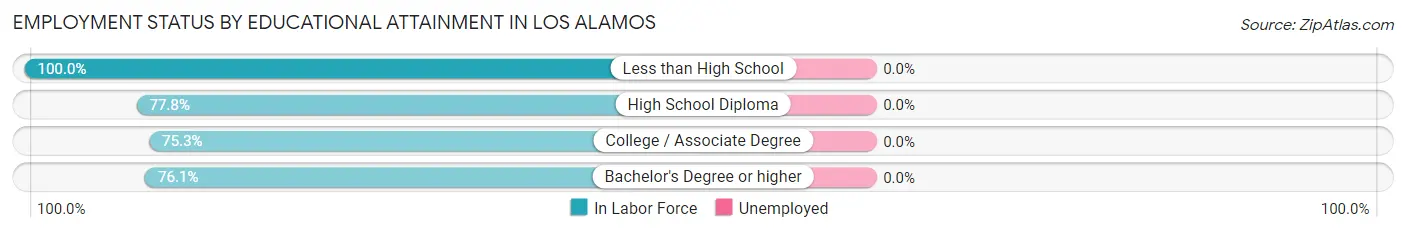
| Educational Attainment | In Labor Force | Unemployed |
| Less than High School | 24 (100.0%) | 0 (0.0%) |
| High School Diploma | 21 (77.8%) | 0 (0.0%) |
| College / Associate Degree | 113 (75.3%) | 0 (0.0%) |
| Bachelor's Degree or higher | 51 (76.1%) | 0 (0.0%) |
| Total | 209 (78.0%) | 0 (0.0%) |
Employment Occupations by Sex in Los Alamos
Management, Business, Science and Arts Occupations
The most common Management, Business, Science and Arts occupations in Los Alamos are Business & Financial (88 | 21.9%), Management (14 | 3.5%), Community & Social Service (6 | 1.5%), and Education, Arts & Media (6 | 1.5%).
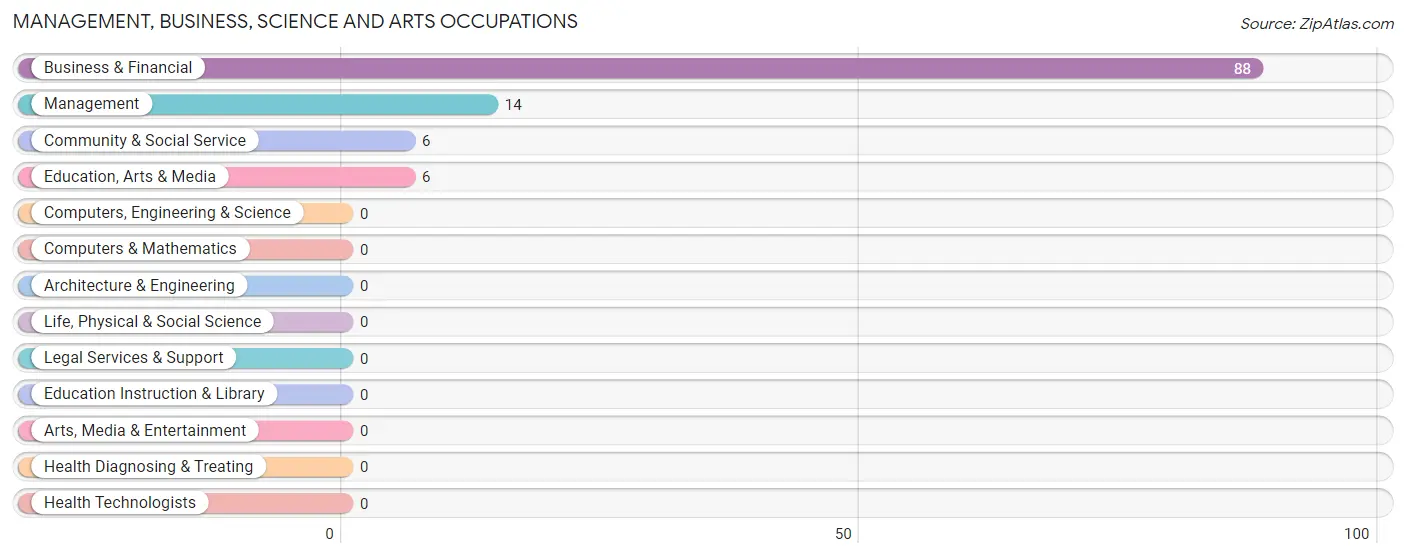
Management, Business, Science and Arts Occupations by Sex
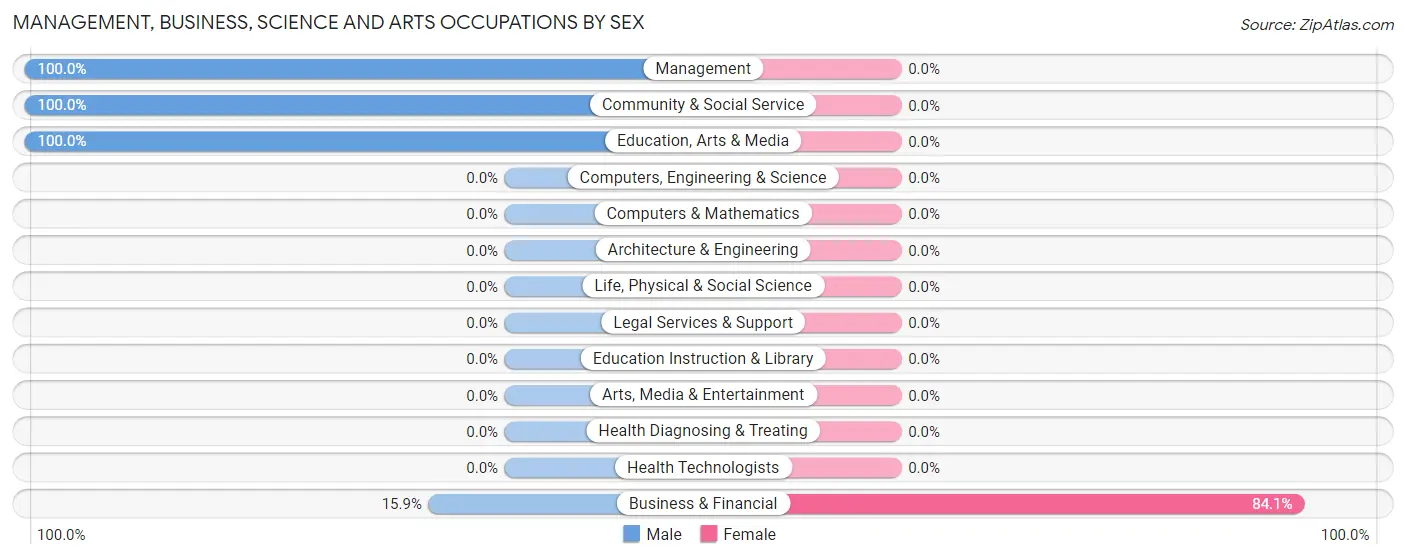
| Occupation | Male | Female |
| Management | 14 (100.0%) | 0 (0.0%) |
| Business & Financial | 14 (15.9%) | 74 (84.1%) |
| Computers, Engineering & Science | 0 (0.0%) | 0 (0.0%) |
| Computers & Mathematics | 0 (0.0%) | 0 (0.0%) |
| Architecture & Engineering | 0 (0.0%) | 0 (0.0%) |
| Life, Physical & Social Science | 0 (0.0%) | 0 (0.0%) |
| Community & Social Service | 6 (100.0%) | 0 (0.0%) |
| Education, Arts & Media | 6 (100.0%) | 0 (0.0%) |
| Legal Services & Support | 0 (0.0%) | 0 (0.0%) |
| Education Instruction & Library | 0 (0.0%) | 0 (0.0%) |
| Arts, Media & Entertainment | 0 (0.0%) | 0 (0.0%) |
| Health Diagnosing & Treating | 0 (0.0%) | 0 (0.0%) |
| Health Technologists | 0 (0.0%) | 0 (0.0%) |
| Total (Category) | 34 (31.5%) | 74 (68.5%) |
| Total (Overall) | 186 (46.3%) | 216 (53.7%) |
Services Occupations
The most common Services occupations in Los Alamos are Healthcare Support (17 | 4.2%), Cleaning & Maintenance (14 | 3.5%), and Food Preparation & Serving (11 | 2.7%).
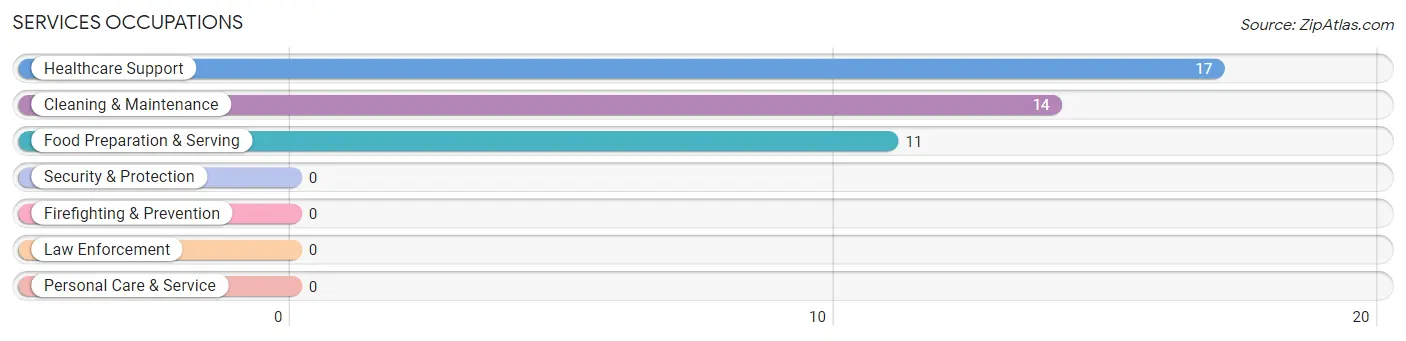
Services Occupations by Sex
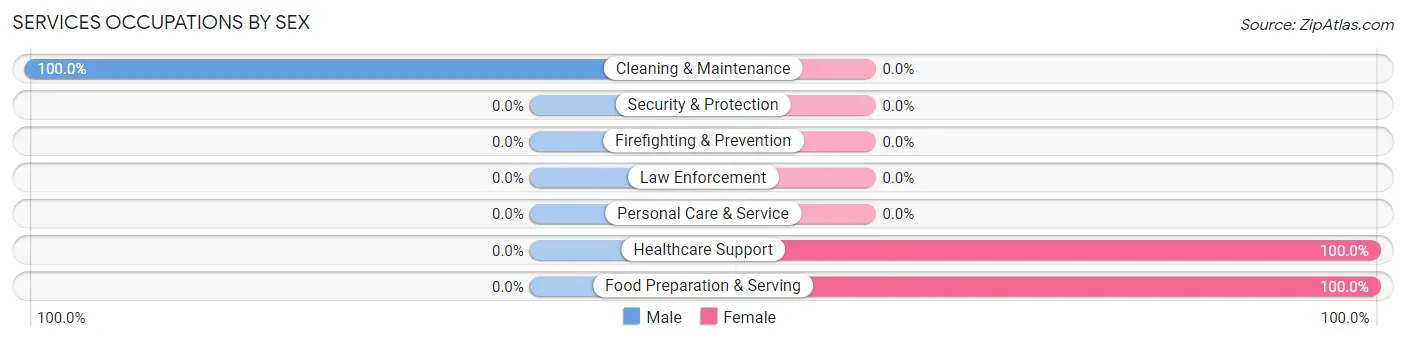
| Occupation | Male | Female |
| Healthcare Support | 0 (0.0%) | 17 (100.0%) |
| Security & Protection | 0 (0.0%) | 0 (0.0%) |
| Firefighting & Prevention | 0 (0.0%) | 0 (0.0%) |
| Law Enforcement | 0 (0.0%) | 0 (0.0%) |
| Food Preparation & Serving | 0 (0.0%) | 11 (100.0%) |
| Cleaning & Maintenance | 14 (100.0%) | 0 (0.0%) |
| Personal Care & Service | 0 (0.0%) | 0 (0.0%) |
| Total (Category) | 14 (33.3%) | 28 (66.7%) |
| Total (Overall) | 186 (46.3%) | 216 (53.7%) |
Sales and Office Occupations
The most common Sales and Office occupations in Los Alamos are Sales & Related (95 | 23.6%), and Office & Administration (71 | 17.7%).
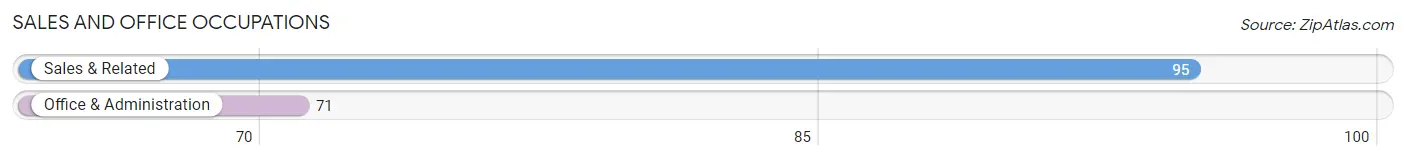
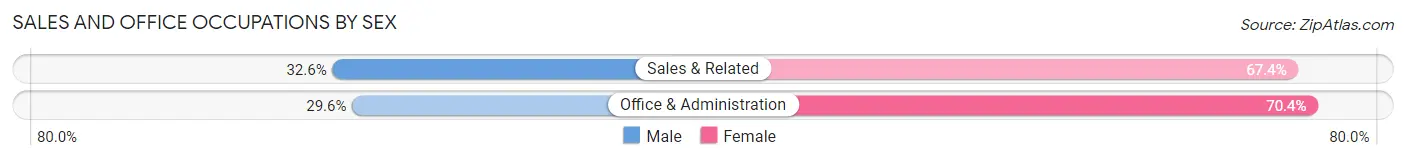
Sales and Office Occupations by Sex
| Occupation | Male | Female |
| Sales & Related | 31 (32.6%) | 64 (67.4%) |
| Office & Administration | 21 (29.6%) | 50 (70.4%) |
| Total (Category) | 52 (31.3%) | 114 (68.7%) |
| Total (Overall) | 186 (46.3%) | 216 (53.7%) |
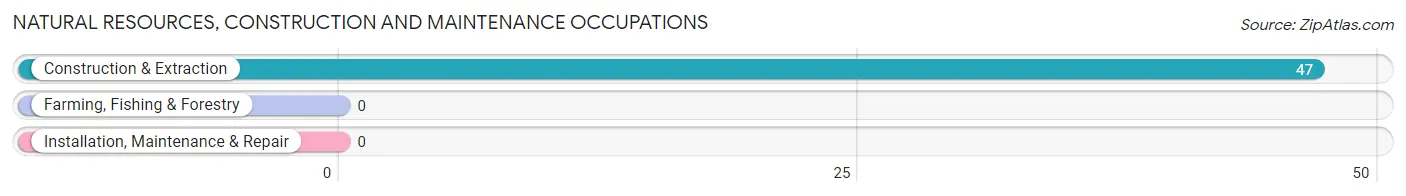
Natural Resources, Construction and Maintenance Occupations
The most common Natural Resources, Construction and Maintenance occupations in Los Alamos are , and Construction & Extraction (47 | 11.7%).
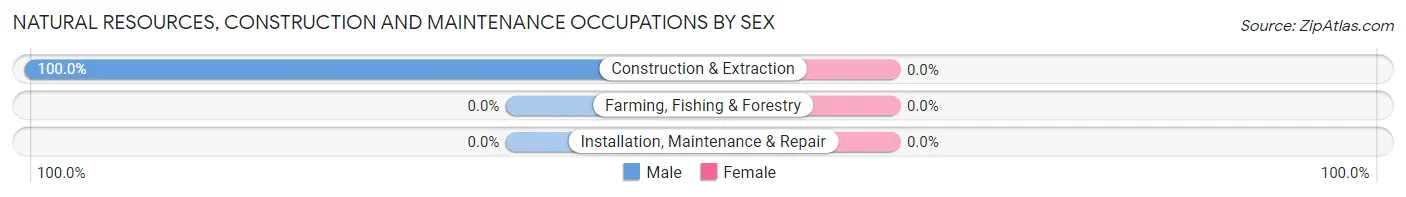
Natural Resources, Construction and Maintenance Occupations by Sex
| Occupation | Male | Female |
| Farming, Fishing & Forestry | 0 (0.0%) | 0 (0.0%) |
| Construction & Extraction | 47 (100.0%) | 0 (0.0%) |
| Installation, Maintenance & Repair | 0 (0.0%) | 0 (0.0%) |
| Total (Category) | 47 (100.0%) | 0 (0.0%) |
| Total (Overall) | 186 (46.3%) | 216 (53.7%) |
Production, Transportation and Moving Occupations
The most common Production, Transportation and Moving occupations in Los Alamos are Transportation (17 | 4.2%), Material Moving (14 | 3.5%), and Production (8 | 2.0%).
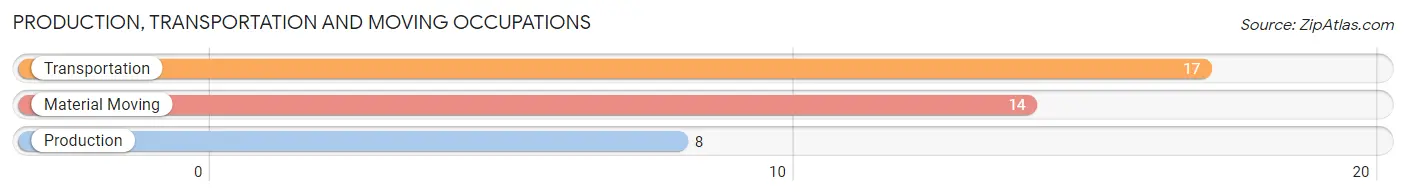
Production, Transportation and Moving Occupations by Sex
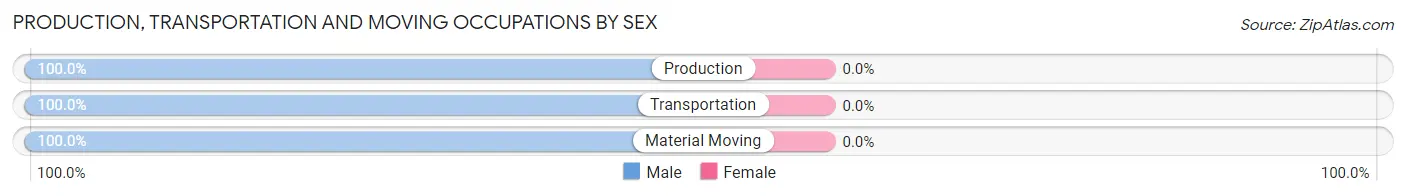
| Occupation | Male | Female |
| Production | 8 (100.0%) | 0 (0.0%) |
| Transportation | 17 (100.0%) | 0 (0.0%) |
| Material Moving | 14 (100.0%) | 0 (0.0%) |
| Total (Category) | 39 (100.0%) | 0 (0.0%) |
| Total (Overall) | 186 (46.3%) | 216 (53.7%) |
Employment Industries by Sex in Los Alamos
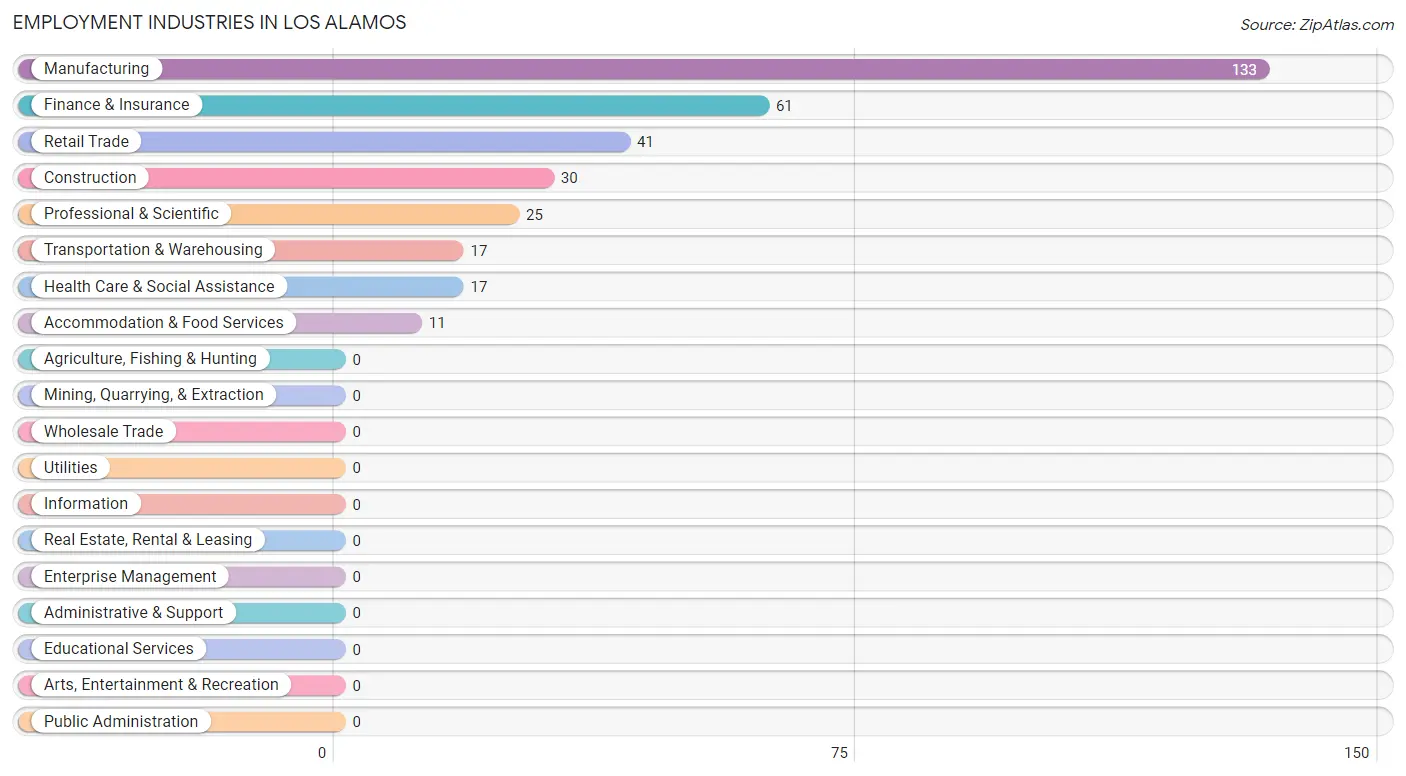
Employment Industries in Los Alamos
The major employment industries in Los Alamos include Manufacturing (133 | 33.1%), Finance & Insurance (61 | 15.2%), Retail Trade (41 | 10.2%), Construction (30 | 7.5%), and Professional & Scientific (25 | 6.2%).
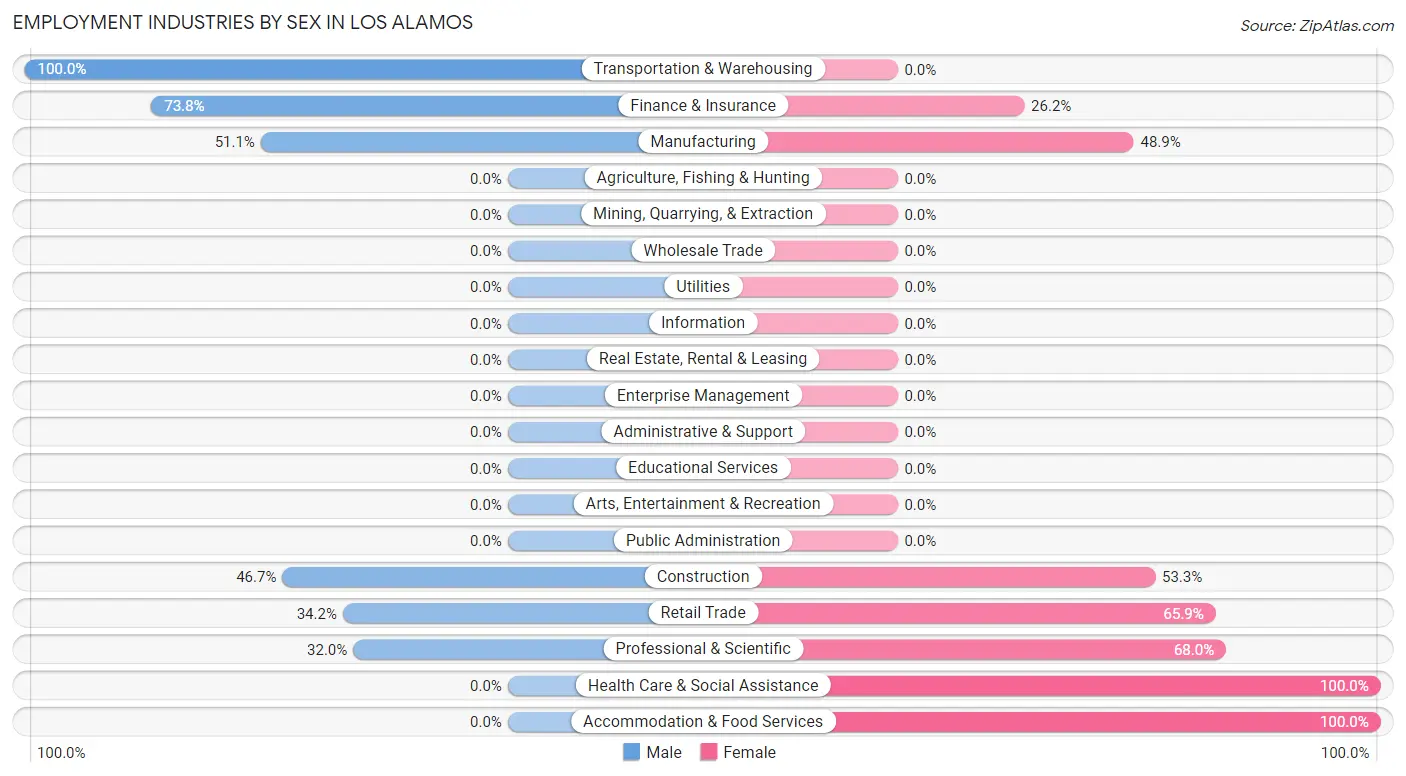
Employment Industries by Sex in Los Alamos
The Los Alamos industries that see more men than women are Transportation & Warehousing (100.0%), Finance & Insurance (73.8%), and Manufacturing (51.1%), whereas the industries that tend to have a higher number of women are Health Care & Social Assistance (100.0%), Accommodation & Food Services (100.0%), and Professional & Scientific (68.0%).
| Industry | Male | Female |
| Agriculture, Fishing & Hunting | 0 (0.0%) | 0 (0.0%) |
| Mining, Quarrying, & Extraction | 0 (0.0%) | 0 (0.0%) |
| Construction | 14 (46.7%) | 16 (53.3%) |
| Manufacturing | 68 (51.1%) | 65 (48.9%) |
| Wholesale Trade | 0 (0.0%) | 0 (0.0%) |
| Retail Trade | 14 (34.2%) | 27 (65.8%) |
| Transportation & Warehousing | 17 (100.0%) | 0 (0.0%) |
| Utilities | 0 (0.0%) | 0 (0.0%) |
| Information | 0 (0.0%) | 0 (0.0%) |
| Finance & Insurance | 45 (73.8%) | 16 (26.2%) |
| Real Estate, Rental & Leasing | 0 (0.0%) | 0 (0.0%) |
| Professional & Scientific | 8 (32.0%) | 17 (68.0%) |
| Enterprise Management | 0 (0.0%) | 0 (0.0%) |
| Administrative & Support | 0 (0.0%) | 0 (0.0%) |
| Educational Services | 0 (0.0%) | 0 (0.0%) |
| Health Care & Social Assistance | 0 (0.0%) | 17 (100.0%) |
| Arts, Entertainment & Recreation | 0 (0.0%) | 0 (0.0%) |
| Accommodation & Food Services | 0 (0.0%) | 11 (100.0%) |
| Public Administration | 0 (0.0%) | 0 (0.0%) |
| Total | 186 (46.3%) | 216 (53.7%) |
Education in Los Alamos
School Enrollment in Los Alamos
The most common levels of schooling among the 97 students in Los Alamos are college / undergraduate (31 | 32.0%), nursery / preschool (24 | 24.7%), and elementary school (24 | 24.7%).
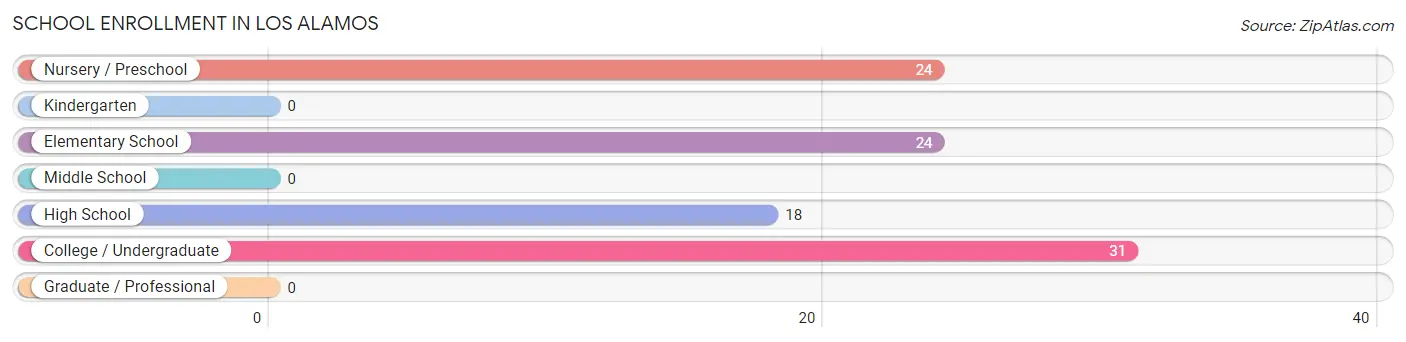
| School Level | # Students | % Students |
| Nursery / Preschool | 24 | 24.7% |
| Kindergarten | 0 | 0.0% |
| Elementary School | 24 | 24.7% |
| Middle School | 0 | 0.0% |
| High School | 18 | 18.6% |
| College / Undergraduate | 31 | 32.0% |
| Graduate / Professional | 0 | 0.0% |
| Total | 97 | 100.0% |
School Enrollment by Age by Funding Source in Los Alamos
Out of a total of 97 students who are enrolled in schools in Los Alamos, 55 (56.7%) attend a private institution, while the remaining 42 (43.3%) are enrolled in public schools. The age group of 20 to 24 year olds has the highest likelihood of being enrolled in private schools, with 31 (100.0% in the age bracket) enrolled. Conversely, the age group of 15 to 17 year olds has the lowest likelihood of being enrolled in a private school, with 18 (100.0% in the age bracket) attending a public institution.
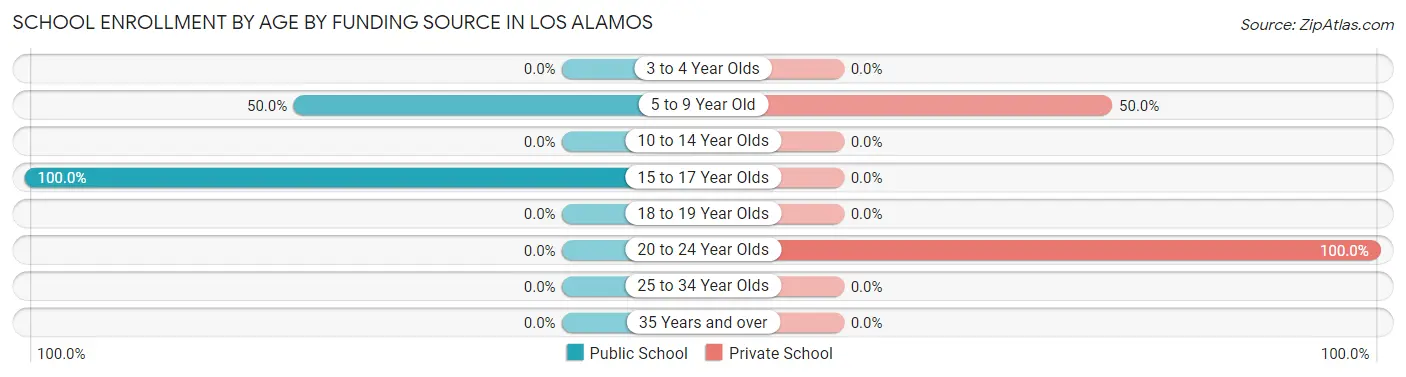
| Age Bracket | Public School | Private School |
| 3 to 4 Year Olds | 0 (0.0%) | 0 (0.0%) |
| 5 to 9 Year Old | 24 (50.0%) | 24 (50.0%) |
| 10 to 14 Year Olds | 0 (0.0%) | 0 (0.0%) |
| 15 to 17 Year Olds | 18 (100.0%) | 0 (0.0%) |
| 18 to 19 Year Olds | 0 (0.0%) | 0 (0.0%) |
| 20 to 24 Year Olds | 0 (0.0%) | 31 (100.0%) |
| 25 to 34 Year Olds | 0 (0.0%) | 0 (0.0%) |
| 35 Years and over | 0 (0.0%) | 0 (0.0%) |
| Total | 42 (43.3%) | 55 (56.7%) |
Educational Attainment by Field of Study in Los Alamos
Business (65 | 45.1%), arts & humanities (47 | 32.6%), education (16 | 11.1%), and liberal arts & history (16 | 11.1%) are the most common fields of study among 144 individuals in Los Alamos who have obtained a bachelor's degree or higher.
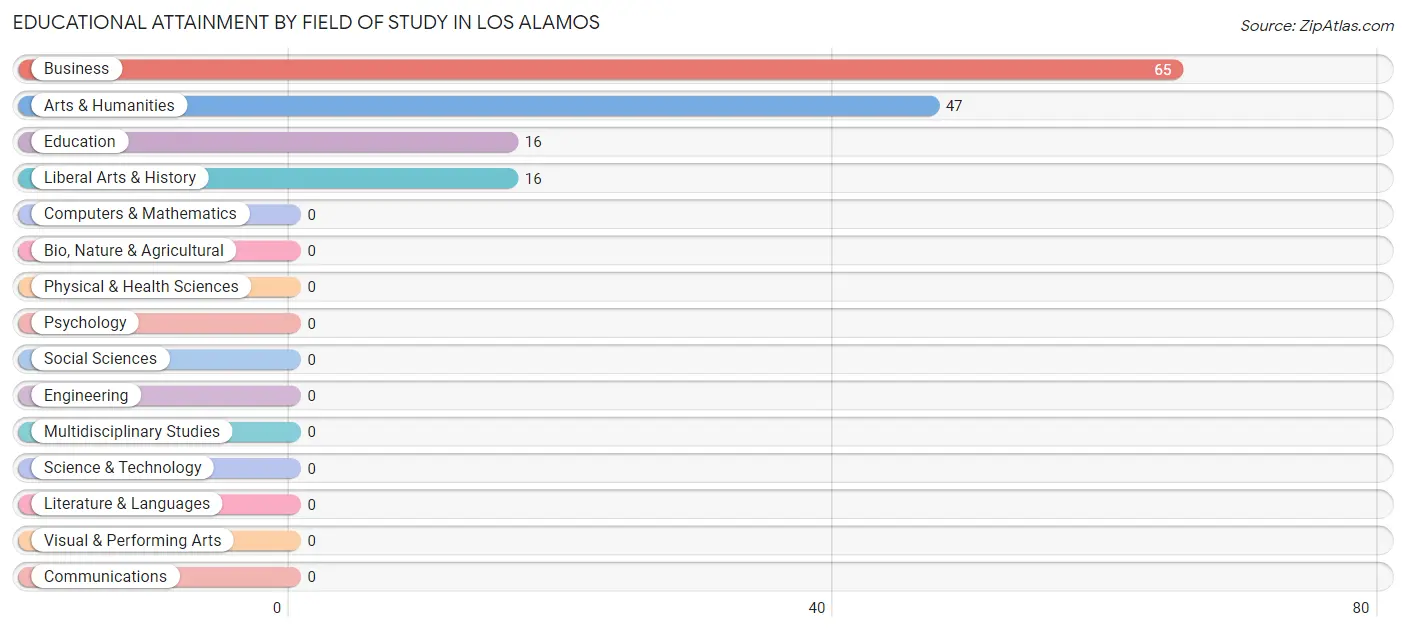
| Field of Study | # Graduates | % Graduates |
| Computers & Mathematics | 0 | 0.0% |
| Bio, Nature & Agricultural | 0 | 0.0% |
| Physical & Health Sciences | 0 | 0.0% |
| Psychology | 0 | 0.0% |
| Social Sciences | 0 | 0.0% |
| Engineering | 0 | 0.0% |
| Multidisciplinary Studies | 0 | 0.0% |
| Science & Technology | 0 | 0.0% |
| Business | 65 | 45.1% |
| Education | 16 | 11.1% |
| Literature & Languages | 0 | 0.0% |
| Liberal Arts & History | 16 | 11.1% |
| Visual & Performing Arts | 0 | 0.0% |
| Communications | 0 | 0.0% |
| Arts & Humanities | 47 | 32.6% |
| Total | 144 | 100.0% |
Transportation & Commute in Los Alamos
Vehicle Availability by Sex in Los Alamos
The most prevalent vehicle ownership categories in Los Alamos are males with 2 vehicles (82, accounting for 49.4%) and females with 2 vehicles (109, making up 38.0%).
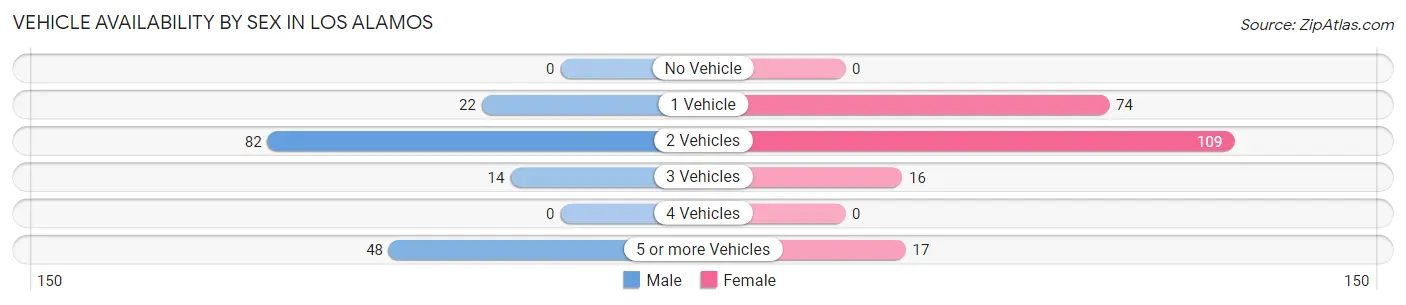
| Vehicles Available | Male | Female |
| No Vehicle | 0 (0.0%) | 0 (0.0%) |
| 1 Vehicle | 22 (13.3%) | 74 (34.3%) |
| 2 Vehicles | 82 (49.4%) | 109 (50.5%) |
| 3 Vehicles | 14 (8.4%) | 16 (7.4%) |
| 4 Vehicles | 0 (0.0%) | 0 (0.0%) |
| 5 or more Vehicles | 48 (28.9%) | 17 (7.9%) |
| Total | 166 (100.0%) | 216 (100.0%) |
Commute Time in Los Alamos
The most frequently occuring commute durations in Los Alamos are 15 to 19 minutes (102 commuters, 40.6%), 20 to 24 minutes (38 commuters, 15.1%), and 30 to 34 minutes (31 commuters, 12.3%).
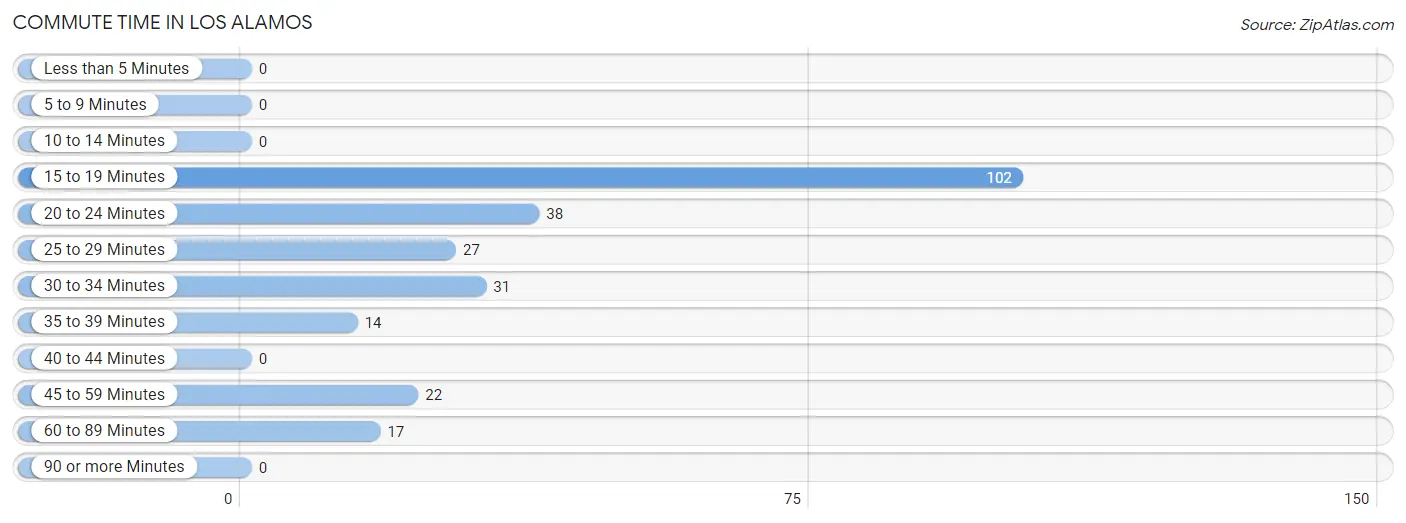
| Commute Time | # Commuters | % Commuters |
| Less than 5 Minutes | 0 | 0.0% |
| 5 to 9 Minutes | 0 | 0.0% |
| 10 to 14 Minutes | 0 | 0.0% |
| 15 to 19 Minutes | 102 | 40.6% |
| 20 to 24 Minutes | 38 | 15.1% |
| 25 to 29 Minutes | 27 | 10.8% |
| 30 to 34 Minutes | 31 | 12.3% |
| 35 to 39 Minutes | 14 | 5.6% |
| 40 to 44 Minutes | 0 | 0.0% |
| 45 to 59 Minutes | 22 | 8.8% |
| 60 to 89 Minutes | 17 | 6.8% |
| 90 or more Minutes | 0 | 0.0% |
Commute Time by Sex in Los Alamos
The most common commute times in Los Alamos are 15 to 19 minutes (54 commuters, 34.0%) for males and 15 to 19 minutes (48 commuters, 52.2%) for females.
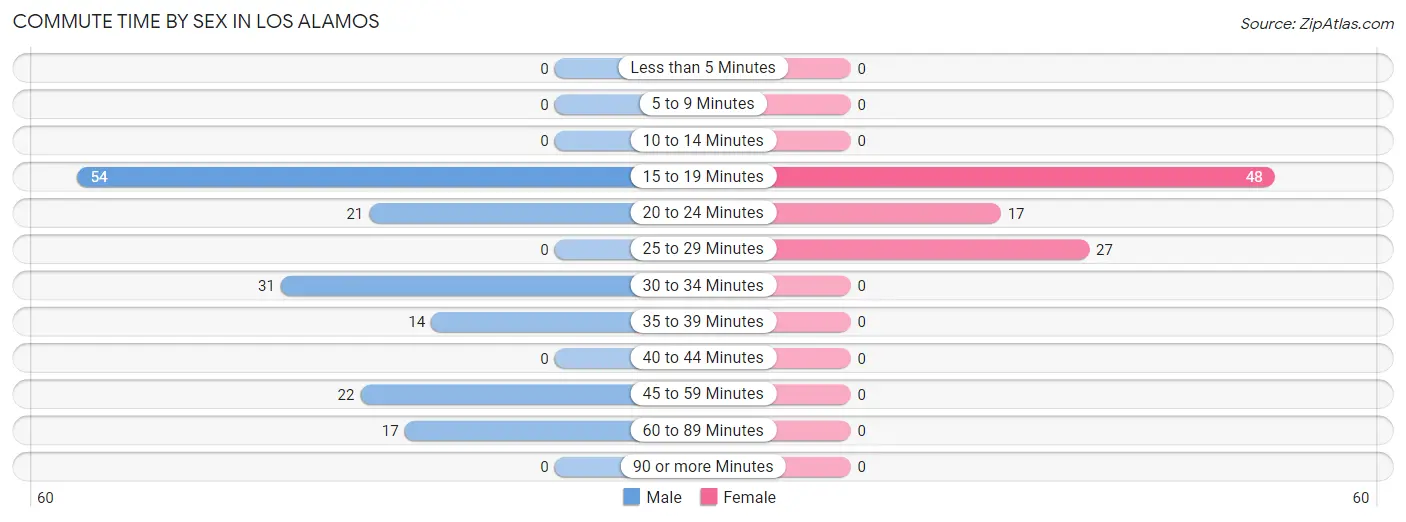
| Commute Time | Male | Female |
| Less than 5 Minutes | 0 (0.0%) | 0 (0.0%) |
| 5 to 9 Minutes | 0 (0.0%) | 0 (0.0%) |
| 10 to 14 Minutes | 0 (0.0%) | 0 (0.0%) |
| 15 to 19 Minutes | 54 (34.0%) | 48 (52.2%) |
| 20 to 24 Minutes | 21 (13.2%) | 17 (18.5%) |
| 25 to 29 Minutes | 0 (0.0%) | 27 (29.3%) |
| 30 to 34 Minutes | 31 (19.5%) | 0 (0.0%) |
| 35 to 39 Minutes | 14 (8.8%) | 0 (0.0%) |
| 40 to 44 Minutes | 0 (0.0%) | 0 (0.0%) |
| 45 to 59 Minutes | 22 (13.8%) | 0 (0.0%) |
| 60 to 89 Minutes | 17 (10.7%) | 0 (0.0%) |
| 90 or more Minutes | 0 (0.0%) | 0 (0.0%) |
Time of Departure to Work by Sex in Los Alamos
The most frequent times of departure to work in Los Alamos are 8:30 AM to 8:59 AM (47, 29.6%) for males and 9:00 AM to 9:59 AM (48, 52.2%) for females.
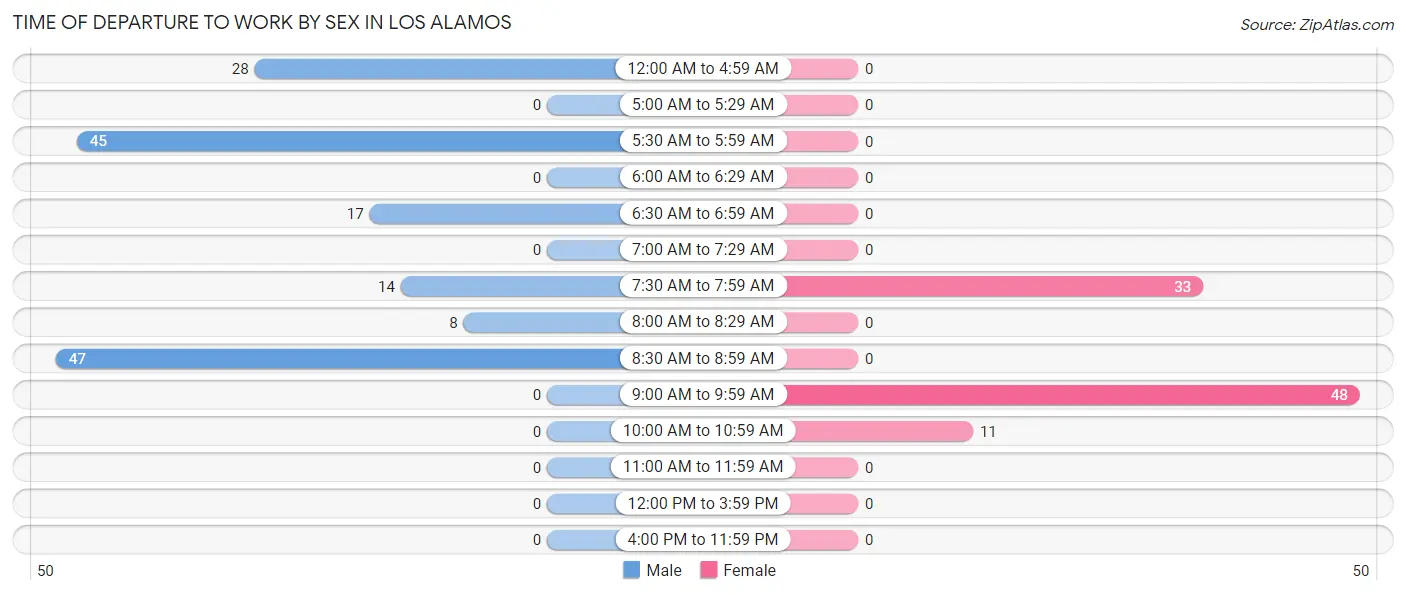
| Time of Departure | Male | Female |
| 12:00 AM to 4:59 AM | 28 (17.6%) | 0 (0.0%) |
| 5:00 AM to 5:29 AM | 0 (0.0%) | 0 (0.0%) |
| 5:30 AM to 5:59 AM | 45 (28.3%) | 0 (0.0%) |
| 6:00 AM to 6:29 AM | 0 (0.0%) | 0 (0.0%) |
| 6:30 AM to 6:59 AM | 17 (10.7%) | 0 (0.0%) |
| 7:00 AM to 7:29 AM | 0 (0.0%) | 0 (0.0%) |
| 7:30 AM to 7:59 AM | 14 (8.8%) | 33 (35.9%) |
| 8:00 AM to 8:29 AM | 8 (5.0%) | 0 (0.0%) |
| 8:30 AM to 8:59 AM | 47 (29.6%) | 0 (0.0%) |
| 9:00 AM to 9:59 AM | 0 (0.0%) | 48 (52.2%) |
| 10:00 AM to 10:59 AM | 0 (0.0%) | 11 (12.0%) |
| 11:00 AM to 11:59 AM | 0 (0.0%) | 0 (0.0%) |
| 12:00 PM to 3:59 PM | 0 (0.0%) | 0 (0.0%) |
| 4:00 PM to 11:59 PM | 0 (0.0%) | 0 (0.0%) |
| Total | 159 (100.0%) | 92 (100.0%) |
Housing Occupancy in Los Alamos
Occupancy by Ownership in Los Alamos
Of the total 424 dwellings in Los Alamos, owner-occupied units account for 343 (80.9%), while renter-occupied units make up 81 (19.1%).
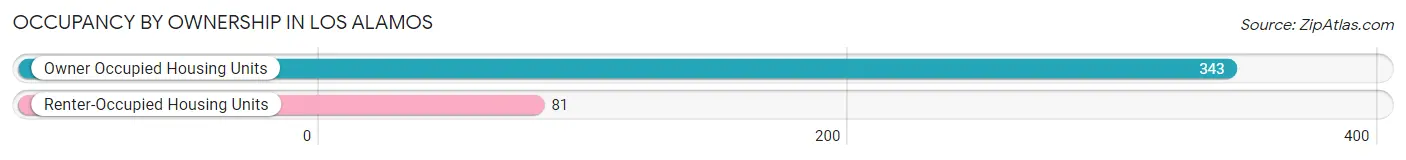
| Occupancy | # Housing Units | % Housing Units |
| Owner Occupied Housing Units | 343 | 80.9% |
| Renter-Occupied Housing Units | 81 | 19.1% |
| Total Occupied Housing Units | 424 | 100.0% |
Occupancy by Household Size in Los Alamos
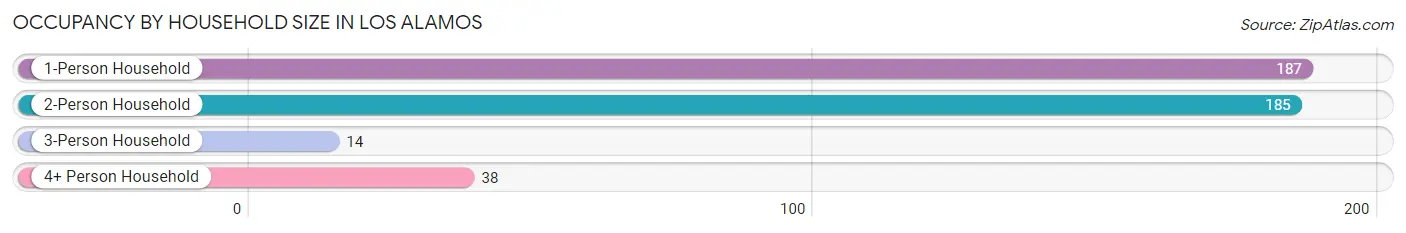
| Household Size | # Housing Units | % Housing Units |
| 1-Person Household | 187 | 44.1% |
| 2-Person Household | 185 | 43.6% |
| 3-Person Household | 14 | 3.3% |
| 4+ Person Household | 38 | 9.0% |
| Total Housing Units | 424 | 100.0% |
Occupancy by Ownership by Household Size in Los Alamos
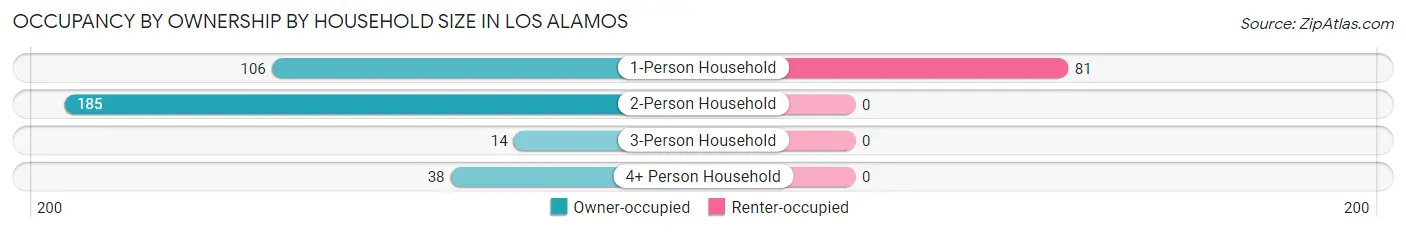
| Household Size | Owner-occupied | Renter-occupied |
| 1-Person Household | 106 (56.7%) | 81 (43.3%) |
| 2-Person Household | 185 (100.0%) | 0 (0.0%) |
| 3-Person Household | 14 (100.0%) | 0 (0.0%) |
| 4+ Person Household | 38 (100.0%) | 0 (0.0%) |
| Total Housing Units | 343 (80.9%) | 81 (19.1%) |
Occupancy by Educational Attainment in Los Alamos
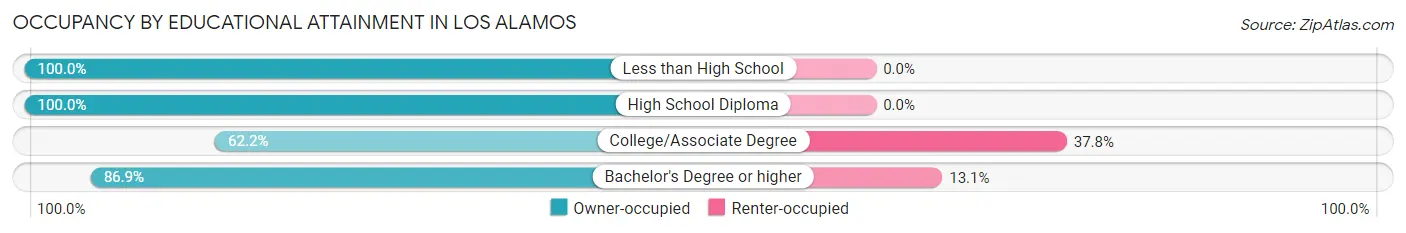
| Household Size | Owner-occupied | Renter-occupied |
| Less than High School | 72 (100.0%) | 0 (0.0%) |
| High School Diploma | 58 (100.0%) | 0 (0.0%) |
| College/Associate Degree | 107 (62.2%) | 65 (37.8%) |
| Bachelor's Degree or higher | 106 (86.9%) | 16 (13.1%) |
Occupancy by Age of Householder in Los Alamos
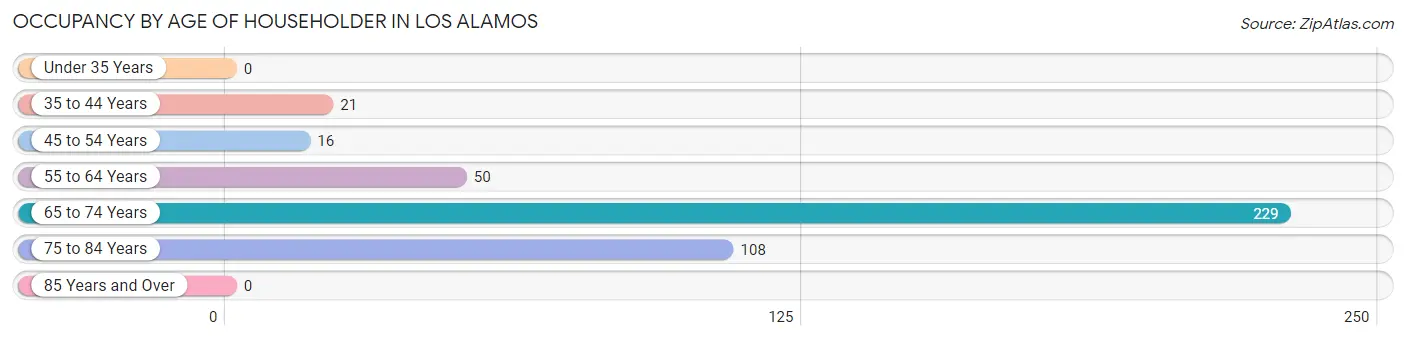
| Age Bracket | # Households | % Households |
| Under 35 Years | 0 | 0.0% |
| 35 to 44 Years | 21 | 5.0% |
| 45 to 54 Years | 16 | 3.8% |
| 55 to 64 Years | 50 | 11.8% |
| 65 to 74 Years | 229 | 54.0% |
| 75 to 84 Years | 108 | 25.5% |
| 85 Years and Over | 0 | 0.0% |
| Total | 424 | 100.0% |
Housing Finances in Los Alamos
Median Income by Occupancy in Los Alamos
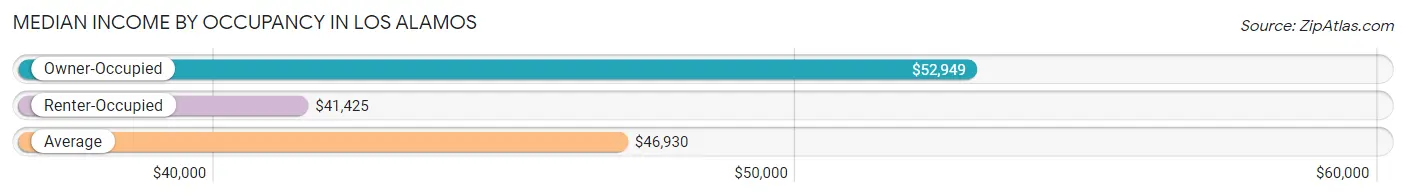
| Occupancy Type | # Households | Median Income |
| Owner-Occupied | 343 (80.9%) | $52,949 |
| Renter-Occupied | 81 (19.1%) | $41,425 |
| Average | 424 (100.0%) | $46,930 |
Occupancy by Householder Income Bracket in Los Alamos
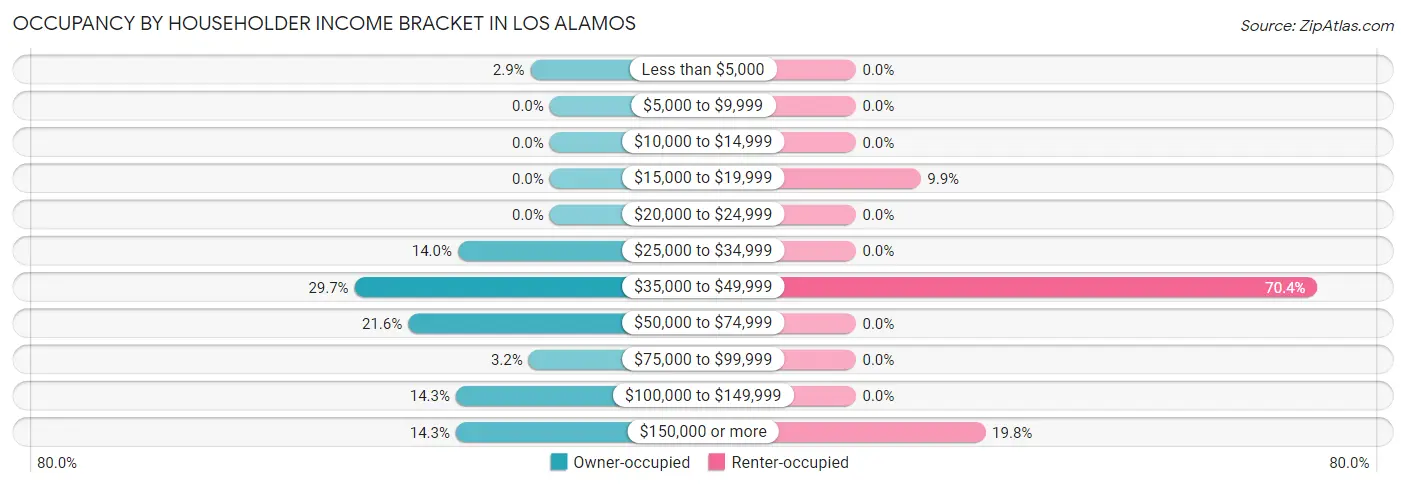
| Income Bracket | Owner-occupied | Renter-occupied |
| Less than $5,000 | 10 (2.9%) | 0 (0.0%) |
| $5,000 to $9,999 | 0 (0.0%) | 0 (0.0%) |
| $10,000 to $14,999 | 0 (0.0%) | 0 (0.0%) |
| $15,000 to $19,999 | 0 (0.0%) | 8 (9.9%) |
| $20,000 to $24,999 | 0 (0.0%) | 0 (0.0%) |
| $25,000 to $34,999 | 48 (14.0%) | 0 (0.0%) |
| $35,000 to $49,999 | 102 (29.7%) | 57 (70.4%) |
| $50,000 to $74,999 | 74 (21.6%) | 0 (0.0%) |
| $75,000 to $99,999 | 11 (3.2%) | 0 (0.0%) |
| $100,000 to $149,999 | 49 (14.3%) | 0 (0.0%) |
| $150,000 or more | 49 (14.3%) | 16 (19.8%) |
| Total | 343 (100.0%) | 81 (100.0%) |
Monthly Housing Cost Tiers in Los Alamos
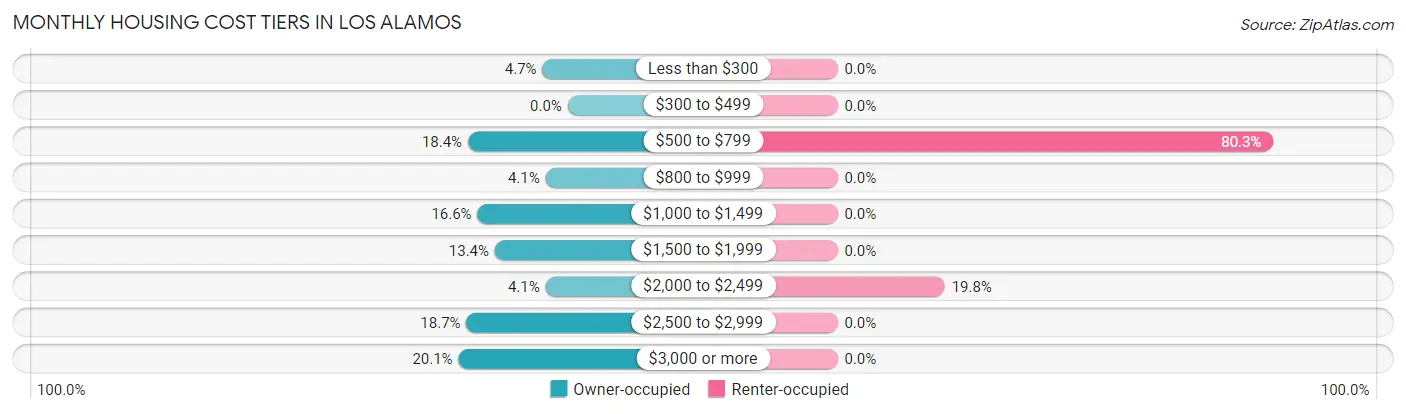
| Monthly Cost | Owner-occupied | Renter-occupied |
| Less than $300 | 16 (4.7%) | 0 (0.0%) |
| $300 to $499 | 0 (0.0%) | 0 (0.0%) |
| $500 to $799 | 63 (18.4%) | 65 (80.2%) |
| $800 to $999 | 14 (4.1%) | 0 (0.0%) |
| $1,000 to $1,499 | 57 (16.6%) | 0 (0.0%) |
| $1,500 to $1,999 | 46 (13.4%) | 0 (0.0%) |
| $2,000 to $2,499 | 14 (4.1%) | 16 (19.8%) |
| $2,500 to $2,999 | 64 (18.7%) | 0 (0.0%) |
| $3,000 or more | 69 (20.1%) | 0 (0.0%) |
| Total | 343 (100.0%) | 81 (100.0%) |
Physical Housing Characteristics in Los Alamos
Housing Structures in Los Alamos
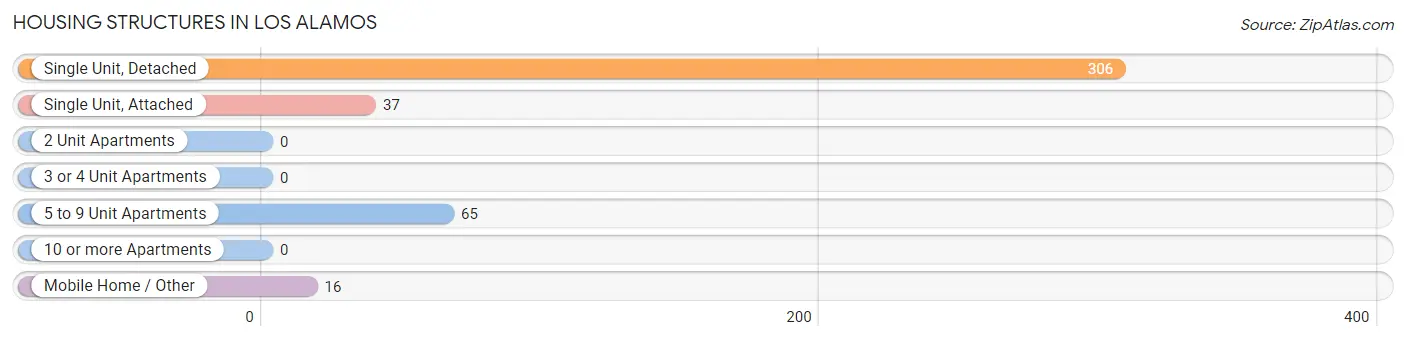
| Structure Type | # Housing Units | % Housing Units |
| Single Unit, Detached | 306 | 72.2% |
| Single Unit, Attached | 37 | 8.7% |
| 2 Unit Apartments | 0 | 0.0% |
| 3 or 4 Unit Apartments | 0 | 0.0% |
| 5 to 9 Unit Apartments | 65 | 15.3% |
| 10 or more Apartments | 0 | 0.0% |
| Mobile Home / Other | 16 | 3.8% |
| Total | 424 | 100.0% |
Housing Structures by Occupancy in Los Alamos
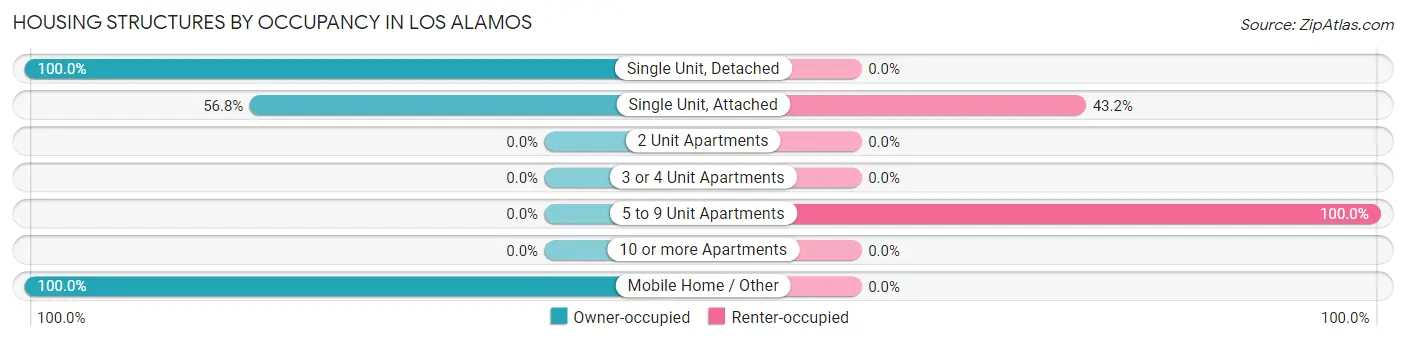
| Structure Type | Owner-occupied | Renter-occupied |
| Single Unit, Detached | 306 (100.0%) | 0 (0.0%) |
| Single Unit, Attached | 21 (56.8%) | 16 (43.2%) |
| 2 Unit Apartments | 0 (0.0%) | 0 (0.0%) |
| 3 or 4 Unit Apartments | 0 (0.0%) | 0 (0.0%) |
| 5 to 9 Unit Apartments | 0 (0.0%) | 65 (100.0%) |
| 10 or more Apartments | 0 (0.0%) | 0 (0.0%) |
| Mobile Home / Other | 16 (100.0%) | 0 (0.0%) |
| Total | 343 (80.9%) | 81 (19.1%) |
Housing Structures by Number of Rooms in Los Alamos
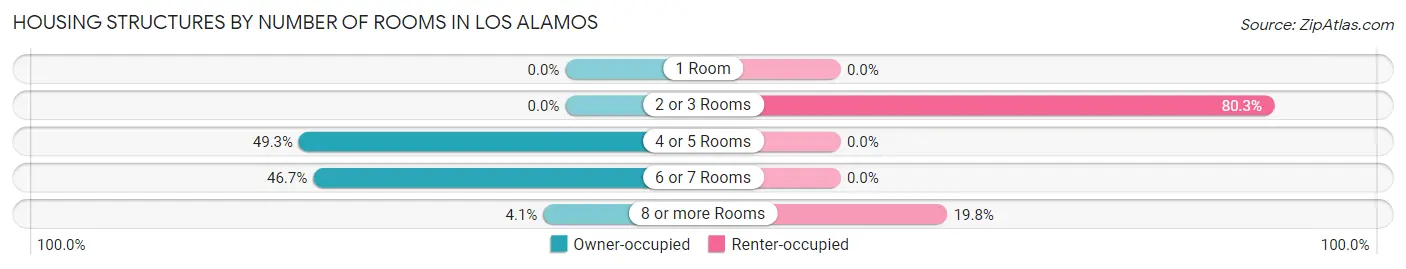
| Number of Rooms | Owner-occupied | Renter-occupied |
| 1 Room | 0 (0.0%) | 0 (0.0%) |
| 2 or 3 Rooms | 0 (0.0%) | 65 (80.2%) |
| 4 or 5 Rooms | 169 (49.3%) | 0 (0.0%) |
| 6 or 7 Rooms | 160 (46.7%) | 0 (0.0%) |
| 8 or more Rooms | 14 (4.1%) | 16 (19.8%) |
| Total | 343 (100.0%) | 81 (100.0%) |
Housing Structure by Heating Type in Los Alamos
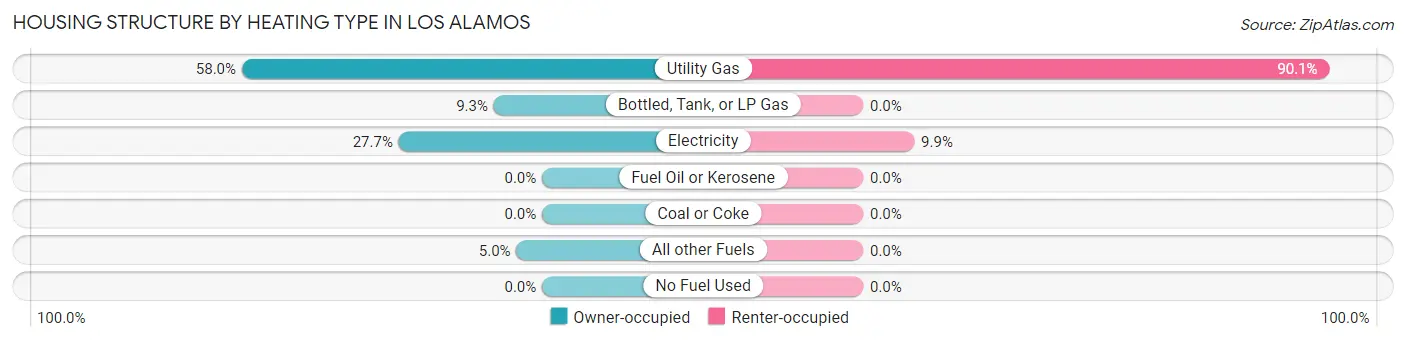
| Heating Type | Owner-occupied | Renter-occupied |
| Utility Gas | 199 (58.0%) | 73 (90.1%) |
| Bottled, Tank, or LP Gas | 32 (9.3%) | 0 (0.0%) |
| Electricity | 95 (27.7%) | 8 (9.9%) |
| Fuel Oil or Kerosene | 0 (0.0%) | 0 (0.0%) |
| Coal or Coke | 0 (0.0%) | 0 (0.0%) |
| All other Fuels | 17 (5.0%) | 0 (0.0%) |
| No Fuel Used | 0 (0.0%) | 0 (0.0%) |
| Total | 343 (100.0%) | 81 (100.0%) |
Household Vehicle Usage in Los Alamos
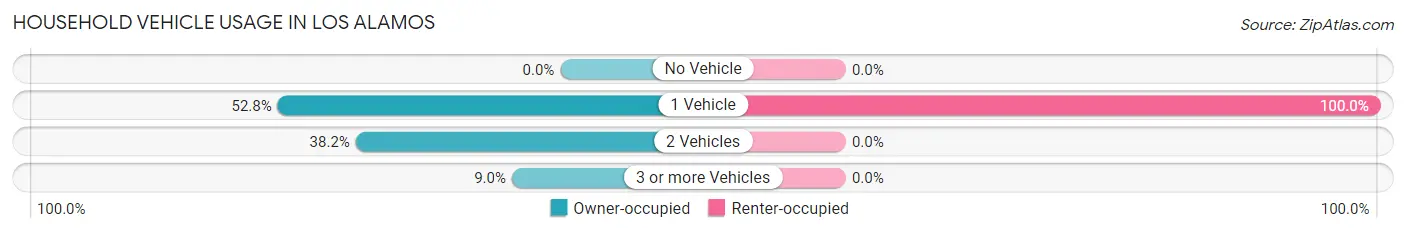
| Vehicles per Household | Owner-occupied | Renter-occupied |
| No Vehicle | 0 (0.0%) | 0 (0.0%) |
| 1 Vehicle | 181 (52.8%) | 81 (100.0%) |
| 2 Vehicles | 131 (38.2%) | 0 (0.0%) |
| 3 or more Vehicles | 31 (9.0%) | 0 (0.0%) |
| Total | 343 (100.0%) | 81 (100.0%) |
Real Estate & Mortgages in Los Alamos
Real Estate and Mortgage Overview in Los Alamos
| Characteristic | Without Mortgage | With Mortgage |
| Housing Units | 150 | 193 |
| Median Property Value | $507,900 | $766,200 |
| Median Household Income | $47,149 | $35 |
| Monthly Housing Costs | $760 | $69 |
| Real Estate Taxes | $3,123 | $0 |
Property Value by Mortgage Status in Los Alamos
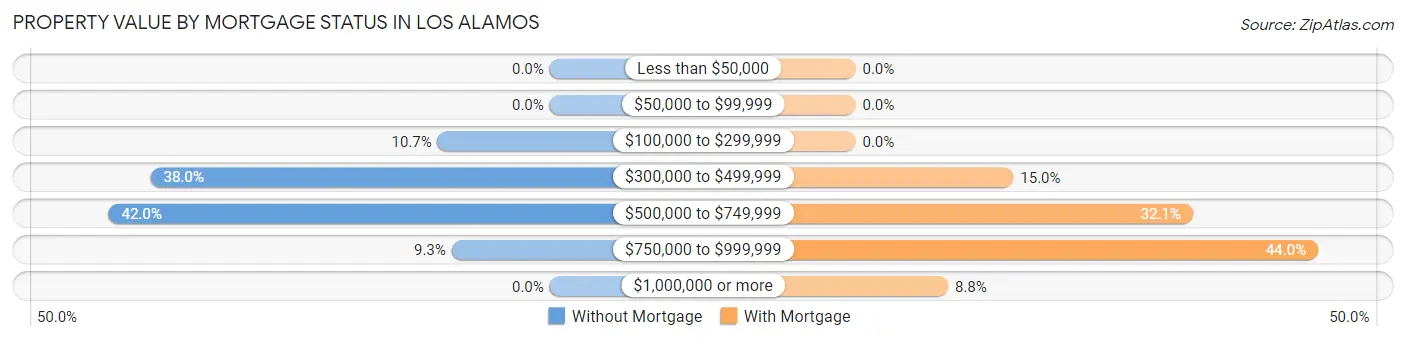
| Property Value | Without Mortgage | With Mortgage |
| Less than $50,000 | 0 (0.0%) | 0 (0.0%) |
| $50,000 to $99,999 | 0 (0.0%) | 0 (0.0%) |
| $100,000 to $299,999 | 16 (10.7%) | 0 (0.0%) |
| $300,000 to $499,999 | 57 (38.0%) | 29 (15.0%) |
| $500,000 to $749,999 | 63 (42.0%) | 62 (32.1%) |
| $750,000 to $999,999 | 14 (9.3%) | 85 (44.0%) |
| $1,000,000 or more | 0 (0.0%) | 17 (8.8%) |
| Total | 150 (100.0%) | 193 (100.0%) |
Household Income by Mortgage Status in Los Alamos
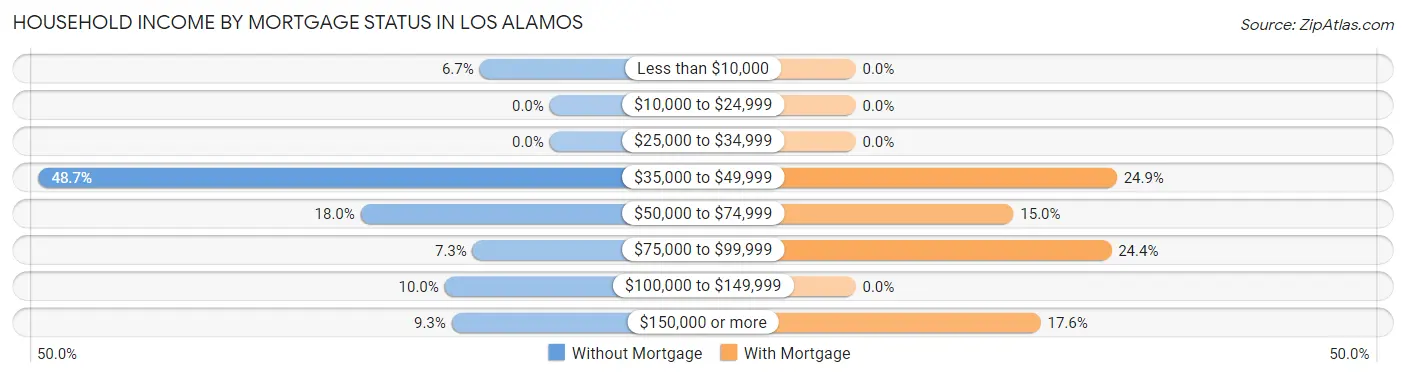
| Household Income | Without Mortgage | With Mortgage |
| Less than $10,000 | 10 (6.7%) | 0 (0.0%) |
| $10,000 to $24,999 | 0 (0.0%) | 0 (0.0%) |
| $25,000 to $34,999 | 0 (0.0%) | 0 (0.0%) |
| $35,000 to $49,999 | 73 (48.7%) | 48 (24.9%) |
| $50,000 to $74,999 | 27 (18.0%) | 29 (15.0%) |
| $75,000 to $99,999 | 11 (7.3%) | 47 (24.3%) |
| $100,000 to $149,999 | 15 (10.0%) | 0 (0.0%) |
| $150,000 or more | 14 (9.3%) | 34 (17.6%) |
| Total | 150 (100.0%) | 193 (100.0%) |
Property Value to Household Income Ratio in Los Alamos
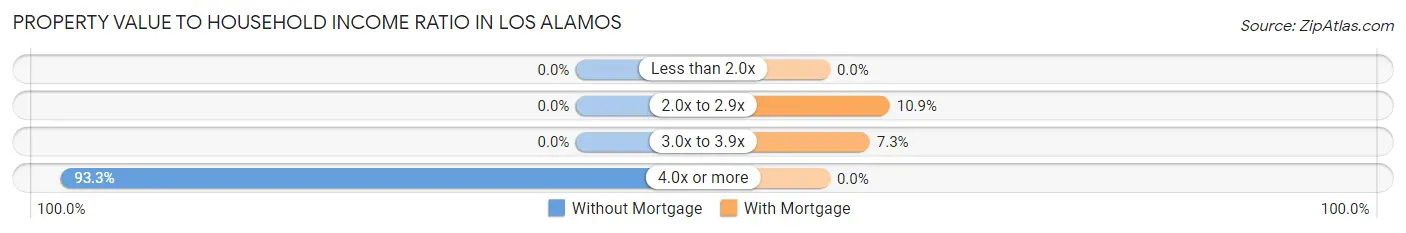
| Value-to-Income Ratio | Without Mortgage | With Mortgage |
| Less than 2.0x | 0 (0.0%) | 0 (0.0%) |
| 2.0x to 2.9x | 0 (0.0%) | 21 (10.9%) |
| 3.0x to 3.9x | 0 (0.0%) | 14 (7.2%) |
| 4.0x or more | 140 (93.3%) | 0 (0.0%) |
| Total | 150 (100.0%) | 193 (100.0%) |
Real Estate Taxes by Mortgage Status in Los Alamos
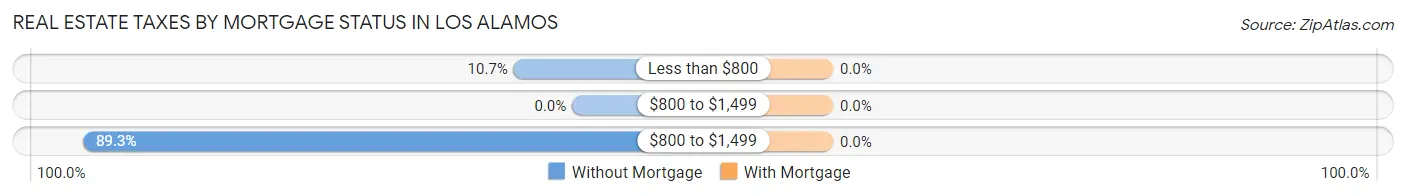
| Property Taxes | Without Mortgage | With Mortgage |
| Less than $800 | 16 (10.7%) | 0 (0.0%) |
| $800 to $1,499 | 0 (0.0%) | 0 (0.0%) |
| $800 to $1,499 | 134 (89.3%) | 0 (0.0%) |
| Total | 150 (100.0%) | 193 (100.0%) |
Health & Disability in Los Alamos
Health Insurance Coverage by Age in Los Alamos
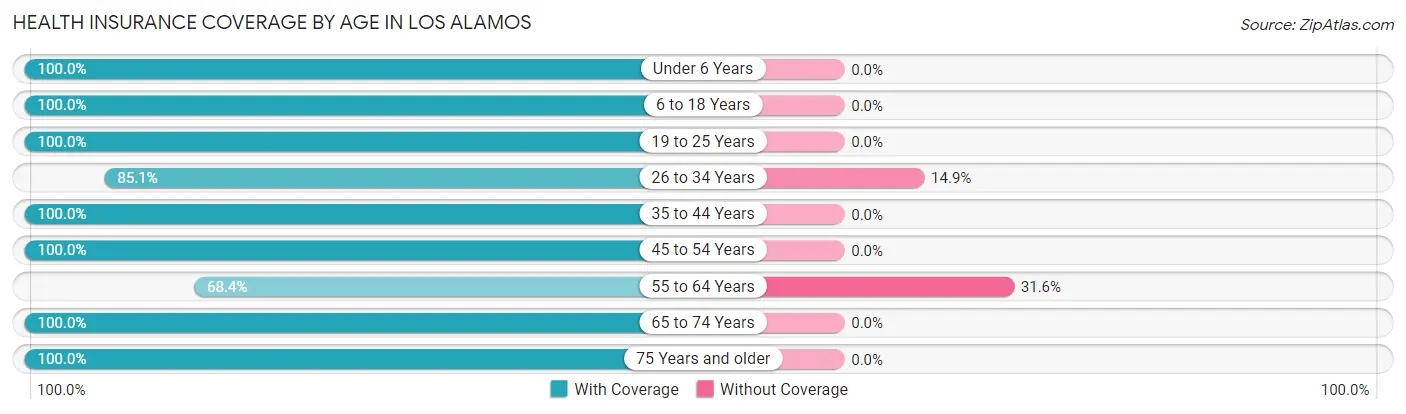
| Age Bracket | With Coverage | Without Coverage |
| Under 6 Years | 48 (100.0%) | 0 (0.0%) |
| 6 to 18 Years | 42 (100.0%) | 0 (0.0%) |
| 19 to 25 Years | 31 (100.0%) | 0 (0.0%) |
| 26 to 34 Years | 40 (85.1%) | 7 (14.9%) |
| 35 to 44 Years | 48 (100.0%) | 0 (0.0%) |
| 45 to 54 Years | 56 (100.0%) | 0 (0.0%) |
| 55 to 64 Years | 80 (68.4%) | 37 (31.6%) |
| 65 to 74 Years | 282 (100.0%) | 0 (0.0%) |
| 75 Years and older | 163 (100.0%) | 0 (0.0%) |
| Total | 790 (94.7%) | 44 (5.3%) |
Health Insurance Coverage by Citizenship Status in Los Alamos
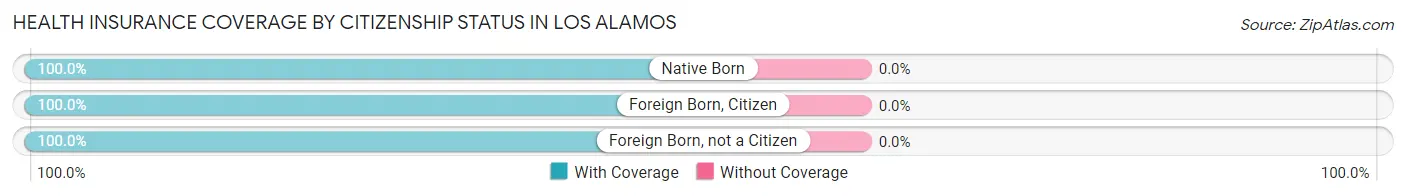
| Citizenship Status | With Coverage | Without Coverage |
| Native Born | 48 (100.0%) | 0 (0.0%) |
| Foreign Born, Citizen | 42 (100.0%) | 0 (0.0%) |
| Foreign Born, not a Citizen | 31 (100.0%) | 0 (0.0%) |
Health Insurance Coverage by Household Income in Los Alamos
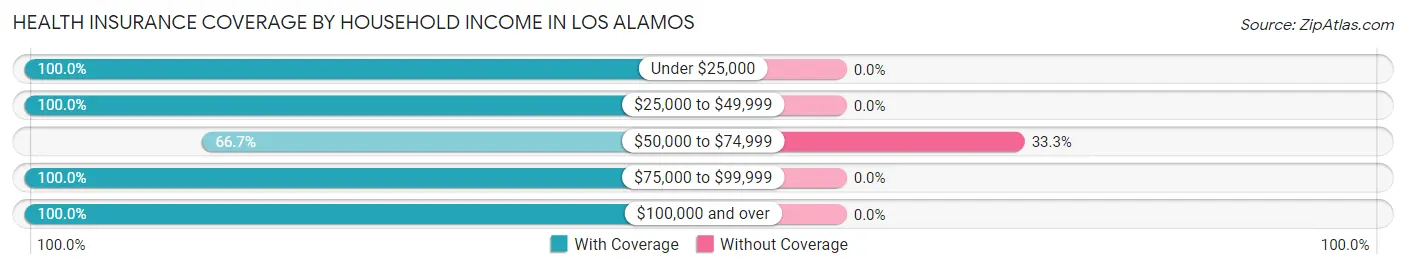
| Household Income | With Coverage | Without Coverage |
| Under $25,000 | 18 (100.0%) | 0 (0.0%) |
| $25,000 to $49,999 | 323 (100.0%) | 0 (0.0%) |
| $50,000 to $74,999 | 74 (66.7%) | 37 (33.3%) |
| $75,000 to $99,999 | 11 (100.0%) | 0 (0.0%) |
| $100,000 and over | 345 (100.0%) | 0 (0.0%) |
Public vs Private Health Insurance Coverage by Age in Los Alamos
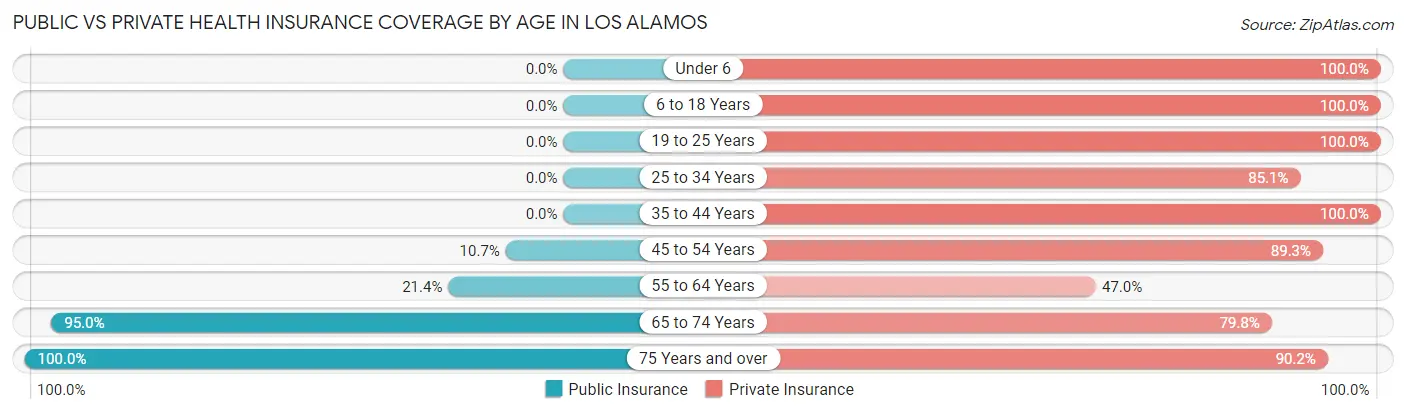
| Age Bracket | Public Insurance | Private Insurance |
| Under 6 | 0 (0.0%) | 48 (100.0%) |
| 6 to 18 Years | 0 (0.0%) | 42 (100.0%) |
| 19 to 25 Years | 0 (0.0%) | 31 (100.0%) |
| 25 to 34 Years | 0 (0.0%) | 40 (85.1%) |
| 35 to 44 Years | 0 (0.0%) | 48 (100.0%) |
| 45 to 54 Years | 6 (10.7%) | 50 (89.3%) |
| 55 to 64 Years | 25 (21.4%) | 55 (47.0%) |
| 65 to 74 Years | 268 (95.0%) | 225 (79.8%) |
| 75 Years and over | 163 (100.0%) | 147 (90.2%) |
| Total | 462 (55.4%) | 686 (82.3%) |
Disability Status by Sex by Age in Los Alamos
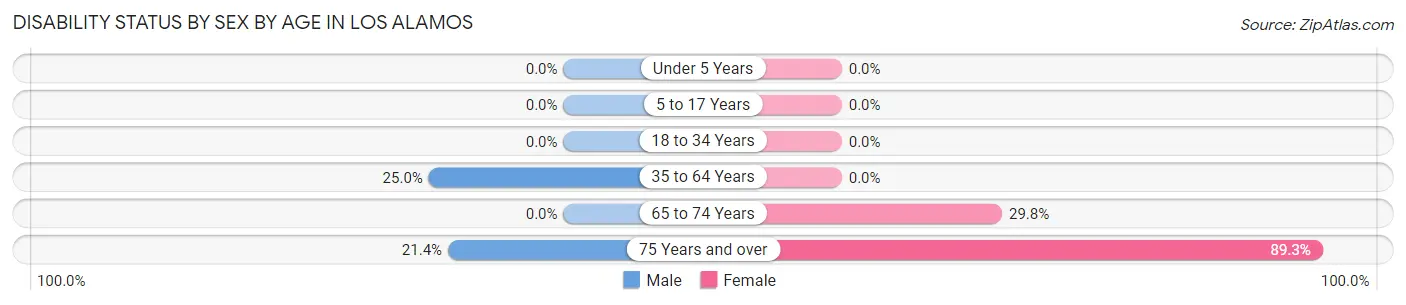
| Age Bracket | Male | Female |
| Under 5 Years | 0 (0.0%) | 0 (0.0%) |
| 5 to 17 Years | 0 (0.0%) | 0 (0.0%) |
| 18 to 34 Years | 0 (0.0%) | 0 (0.0%) |
| 35 to 64 Years | 20 (25.0%) | 0 (0.0%) |
| 65 to 74 Years | 0 (0.0%) | 47 (29.7%) |
| 75 Years and over | 15 (21.4%) | 83 (89.2%) |
Disability Class by Sex by Age in Los Alamos
Disability Class: Hearing Difficulty
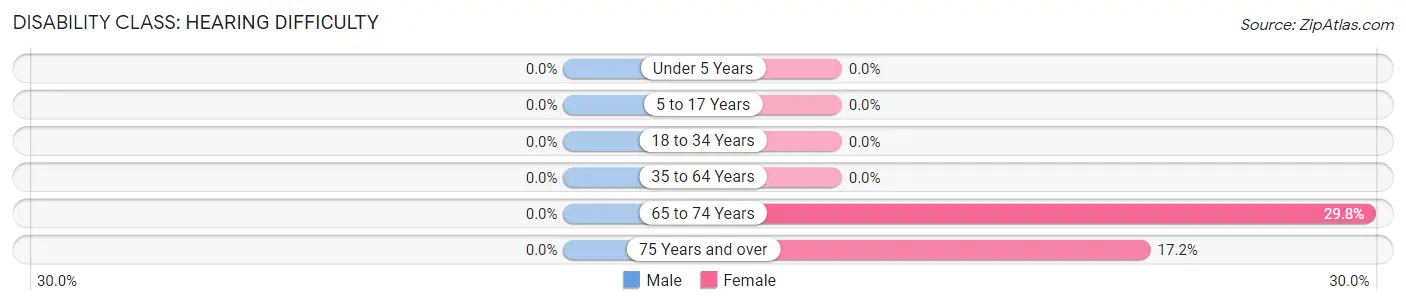
| Age Bracket | Male | Female |
| Under 5 Years | 0 (0.0%) | 0 (0.0%) |
| 5 to 17 Years | 0 (0.0%) | 0 (0.0%) |
| 18 to 34 Years | 0 (0.0%) | 0 (0.0%) |
| 35 to 64 Years | 0 (0.0%) | 0 (0.0%) |
| 65 to 74 Years | 0 (0.0%) | 47 (29.7%) |
| 75 Years and over | 0 (0.0%) | 16 (17.2%) |
Disability Class: Vision Difficulty
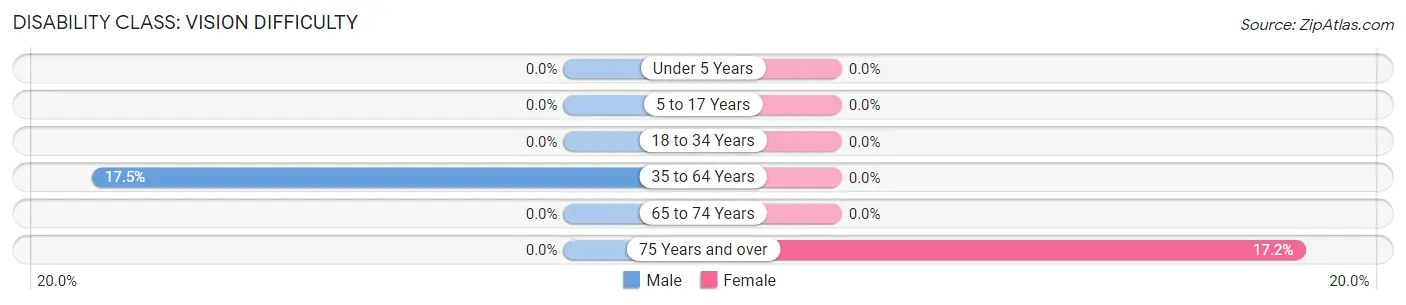
| Age Bracket | Male | Female |
| Under 5 Years | 0 (0.0%) | 0 (0.0%) |
| 5 to 17 Years | 0 (0.0%) | 0 (0.0%) |
| 18 to 34 Years | 0 (0.0%) | 0 (0.0%) |
| 35 to 64 Years | 14 (17.5%) | 0 (0.0%) |
| 65 to 74 Years | 0 (0.0%) | 0 (0.0%) |
| 75 Years and over | 0 (0.0%) | 16 (17.2%) |
Disability Class: Cognitive Difficulty
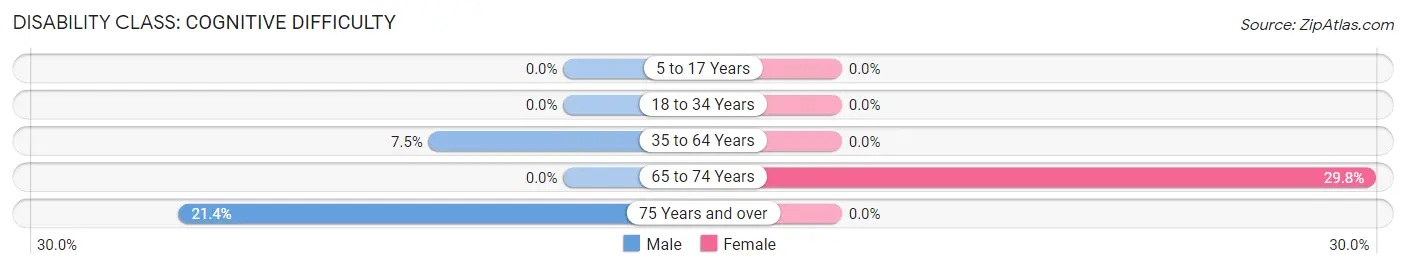
| Age Bracket | Male | Female |
| 5 to 17 Years | 0 (0.0%) | 0 (0.0%) |
| 18 to 34 Years | 0 (0.0%) | 0 (0.0%) |
| 35 to 64 Years | 6 (7.5%) | 0 (0.0%) |
| 65 to 74 Years | 0 (0.0%) | 47 (29.7%) |
| 75 Years and over | 15 (21.4%) | 0 (0.0%) |
Disability Class: Ambulatory Difficulty
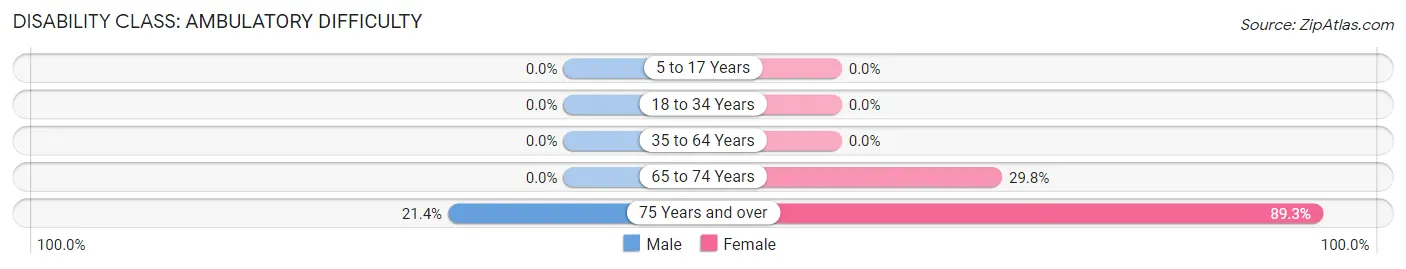
| Age Bracket | Male | Female |
| 5 to 17 Years | 0 (0.0%) | 0 (0.0%) |
| 18 to 34 Years | 0 (0.0%) | 0 (0.0%) |
| 35 to 64 Years | 0 (0.0%) | 0 (0.0%) |
| 65 to 74 Years | 0 (0.0%) | 47 (29.7%) |
| 75 Years and over | 15 (21.4%) | 83 (89.2%) |
Disability Class: Self-Care Difficulty
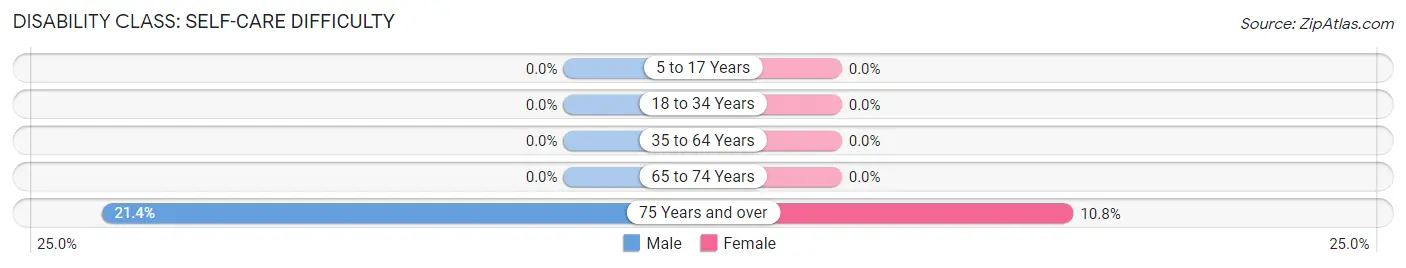
| Age Bracket | Male | Female |
| 5 to 17 Years | 0 (0.0%) | 0 (0.0%) |
| 18 to 34 Years | 0 (0.0%) | 0 (0.0%) |
| 35 to 64 Years | 0 (0.0%) | 0 (0.0%) |
| 65 to 74 Years | 0 (0.0%) | 0 (0.0%) |
| 75 Years and over | 15 (21.4%) | 10 (10.7%) |
Technology Access in Los Alamos
Computing Device Access in Los Alamos
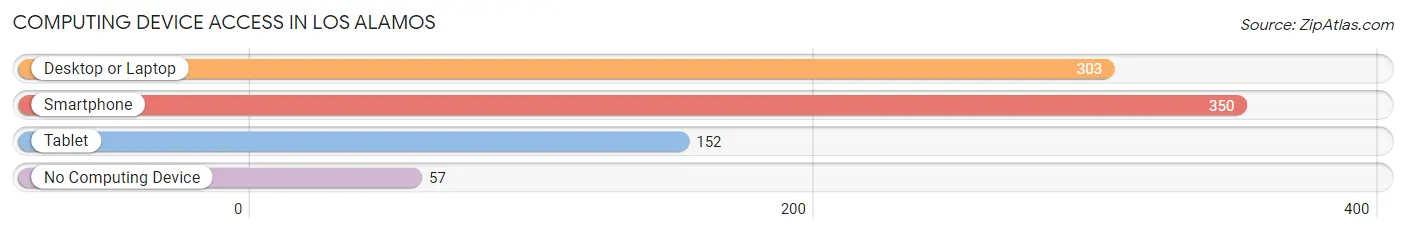
| Device Type | # Households | % Households |
| Desktop or Laptop | 303 | 71.5% |
| Smartphone | 350 | 82.6% |
| Tablet | 152 | 35.8% |
| No Computing Device | 57 | 13.4% |
| Total | 424 | 100.0% |
Internet Access in Los Alamos
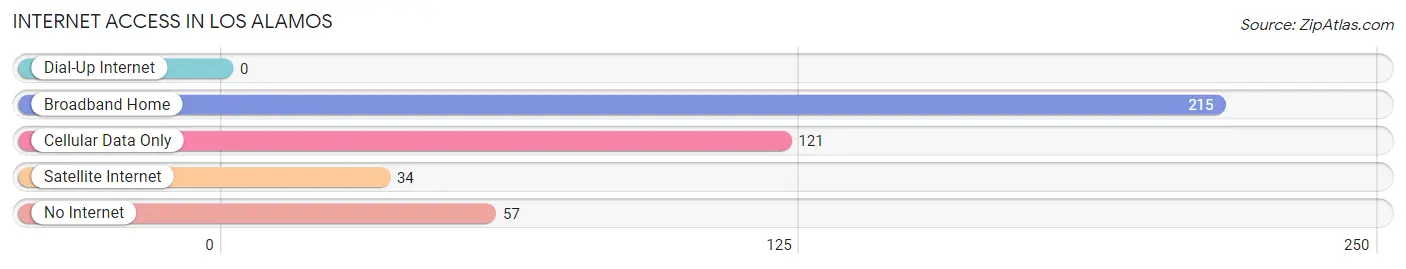
| Internet Type | # Households | % Households |
| Dial-Up Internet | 0 | 0.0% |
| Broadband Home | 215 | 50.7% |
| Cellular Data Only | 121 | 28.5% |
| Satellite Internet | 34 | 8.0% |
| No Internet | 57 | 13.4% |
| Total | 424 | 100.0% |
Los Alamos Summary
Los Alamos is a small town located in Santa Barbara County, California. It is situated in the foothills of the Santa Ynez Mountains, about 10 miles east of Santa Barbara. The town has a population of about 2,000 people and is known for its rural charm and scenic beauty.
History
Los Alamos was founded in 1876 by a group of settlers from the nearby town of Santa Barbara. The settlers were looking for a place to settle and farm, and they chose the area because of its fertile soil and abundant water supply. The town was originally called "La Cañada de los Alamos," which translates to "the canyon of the cottonwoods." The name was later shortened to Los Alamos.
The town grew slowly over the years, and by the early 1900s, it had become a popular tourist destination. The town was known for its hot springs, which were believed to have healing properties. In the 1920s, the town was home to a number of resorts, including the Los Alamos Hotel and the Los Alamos Inn.
In the 1940s, the town was chosen as the site of the top-secret Los Alamos National Laboratory, which was established to develop the atomic bomb. The laboratory brought a large influx of scientists and engineers to the area, and the town's population grew rapidly.
Geography
Los Alamos is located in the foothills of the Santa Ynez Mountains, about 10 miles east of Santa Barbara. The town is situated at an elevation of about 1,000 feet, and the surrounding area is characterized by rolling hills and oak-studded valleys. The town is located in a Mediterranean climate zone, with mild winters and hot, dry summers.
Economy
The economy of Los Alamos is largely based on tourism and agriculture. The town is home to several wineries, and it is a popular destination for wine tasting and other activities. The town is also home to a number of small businesses, including restaurants, shops, and galleries.
The Los Alamos National Laboratory is the largest employer in the area, and it provides jobs for many of the town's residents. The laboratory is a major contributor to the local economy, and it is responsible for much of the town's growth and development.
Demographics
As of the 2010 census, the population of Los Alamos was 2,037. The town is predominantly white, with about 75% of the population identifying as Caucasian. The town also has a significant Hispanic population, with about 20% of the population identifying as Hispanic or Latino. The median household income in Los Alamos is $63,000, and the median home value is $541,000.
Common Questions
What is Per Capita Income in Los Alamos?
Per Capita income in Los Alamos is $47,661.
What is the Median Household income in Los Alamos?
Median Household Income in Los Alamos is $46,930.
What is Inequality or Gini Index in Los Alamos?
Inequality or Gini Index in Los Alamos is 0.48.
What is the Total Population of Los Alamos?
Total Population of Los Alamos is 834.
What is the Total Male Population of Los Alamos?
Total Male Population of Los Alamos is 319.
What is the Total Female Population of Los Alamos?
Total Female Population of Los Alamos is 515.
What is the Ratio of Males per 100 Females in Los Alamos?
There are 61.94 Males per 100 Females in Los Alamos.
What is the Ratio of Females per 100 Males in Los Alamos?
There are 161.44 Females per 100 Males in Los Alamos.
What is the Median Population Age in Los Alamos?
Median Population Age in Los Alamos is 68.3 Years.
What is the Average Family Size in Los Alamos
Average Family Size in Los Alamos is 2.6 People.
What is the Average Household Size in Los Alamos
Average Household Size in Los Alamos is 1.9 People.
How Large is the Labor Force in Los Alamos?
There are 431 People in the Labor Forcein in Los Alamos.
What is the Percentage of People in the Labor Force in Los Alamos?
56.6% of People are in the Labor Force in Los Alamos.
What is the Unemployment Rate in Los Alamos?
Unemployment Rate in Los Alamos is 6.7%.