Agua Dulce, CA Map & Demographics
Agua Dulce Map
Agua Dulce Overview
$51,906
PER CAPITA INCOME
$128,958
AVG FAMILY INCOME
$121,250
AVG HOUSEHOLD INCOME
63.3%
WAGE / INCOME GAP [ % ]
36.7¢/ $1
WAGE / INCOME GAP [ $ ]
0.38
INEQUALITY / GINI INDEX
3,161
TOTAL POPULATION
1,696
MALE POPULATION
1,465
FEMALE POPULATION
115.77
MALES / 100 FEMALES
86.38
FEMALES / 100 MALES
53.4
MEDIAN AGE
3.1
AVG FAMILY SIZE
2.8
AVG HOUSEHOLD SIZE
1,631
LABOR FORCE [ PEOPLE ]
60.0%
PERCENT IN LABOR FORCE
3.9%
UNEMPLOYMENT RATE
Agua Dulce Area Codes
Income in Agua Dulce
Income Overview in Agua Dulce
Per Capita Income in Agua Dulce is $51,906, while median incomes of families and households are $128,958 and $121,250 respectively.
| Characteristic | Number | Measure |
| Per Capita Income | 3,161 | $51,906 |
| Median Family Income | 867 | $128,958 |
| Mean Family Income | 867 | $154,463 |
| Median Household Income | 1,143 | $121,250 |
| Mean Household Income | 1,143 | $137,685 |
| Income Deficit | 867 | $0 |
| Wage / Income Gap (%) | 3,161 | 63.27% |
| Wage / Income Gap ($) | 3,161 | 36.73¢ per $1 |
| Gini / Inequality Index | 3,161 | 0.38 |
Earnings by Sex in Agua Dulce
Average Earnings in Agua Dulce are $59,705, $78,693 for men and $28,906 for women, a difference of 63.3%.
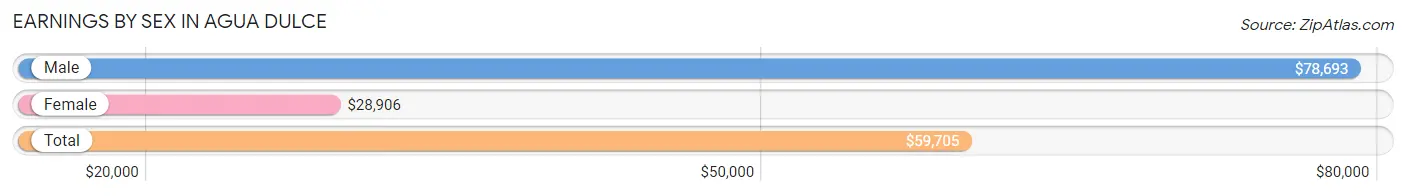
| Sex | Number | Average Earnings |
| Male | 956 (54.7%) | $78,693 |
| Female | 793 (45.3%) | $28,906 |
| Total | 1,749 (100.0%) | $59,705 |
Earnings by Sex by Income Bracket in Agua Dulce
The most common earnings brackets in Agua Dulce are $100,000+ for men (300 | 31.4%) and $100,000+ for women (181 | 22.8%).
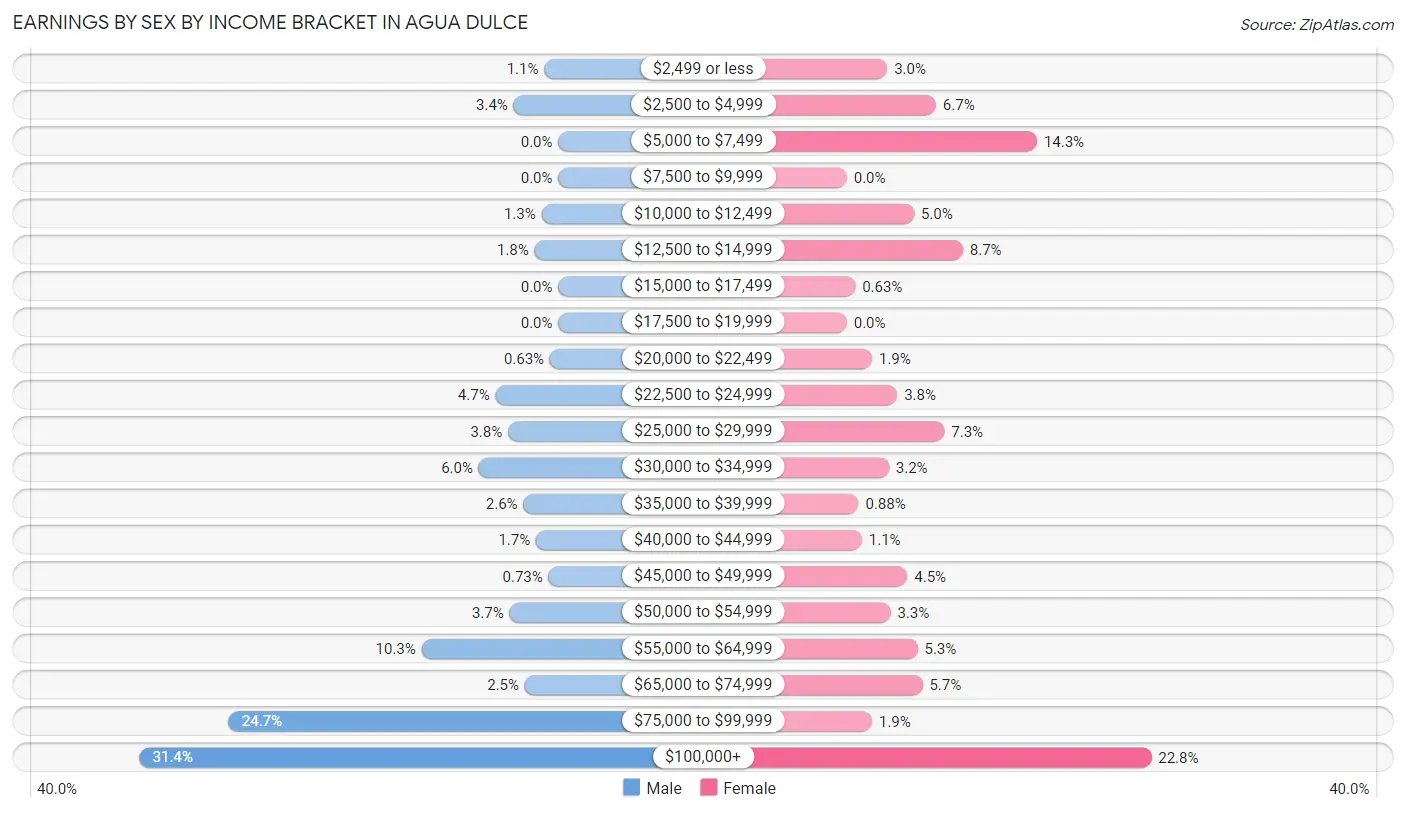
| Income | Male | Female |
| $2,499 or less | 10 (1.1%) | 24 (3.0%) |
| $2,500 to $4,999 | 32 (3.4%) | 53 (6.7%) |
| $5,000 to $7,499 | 0 (0.0%) | 113 (14.2%) |
| $7,500 to $9,999 | 0 (0.0%) | 0 (0.0%) |
| $10,000 to $12,499 | 12 (1.3%) | 40 (5.0%) |
| $12,500 to $14,999 | 17 (1.8%) | 69 (8.7%) |
| $15,000 to $17,499 | 0 (0.0%) | 5 (0.6%) |
| $17,500 to $19,999 | 0 (0.0%) | 0 (0.0%) |
| $20,000 to $22,499 | 6 (0.6%) | 15 (1.9%) |
| $22,500 to $24,999 | 45 (4.7%) | 30 (3.8%) |
| $25,000 to $29,999 | 36 (3.8%) | 58 (7.3%) |
| $30,000 to $34,999 | 57 (6.0%) | 25 (3.2%) |
| $35,000 to $39,999 | 25 (2.6%) | 7 (0.9%) |
| $40,000 to $44,999 | 16 (1.7%) | 9 (1.1%) |
| $45,000 to $49,999 | 7 (0.7%) | 36 (4.5%) |
| $50,000 to $54,999 | 35 (3.7%) | 26 (3.3%) |
| $55,000 to $64,999 | 98 (10.2%) | 42 (5.3%) |
| $65,000 to $74,999 | 24 (2.5%) | 45 (5.7%) |
| $75,000 to $99,999 | 236 (24.7%) | 15 (1.9%) |
| $100,000+ | 300 (31.4%) | 181 (22.8%) |
| Total | 956 (100.0%) | 793 (100.0%) |
Earnings by Sex by Educational Attainment in Agua Dulce
Average earnings in Agua Dulce are $79,148 for men and $34,350 for women, a difference of 56.6%. Men with an educational attainment of graduate degree enjoy the highest average annual earnings of $111,970, while those with less than high school education earn the least with $76,172. Women with an educational attainment of graduate degree earn the most with the average annual earnings of $70,000, while those with college or associate's degree education have the smallest earnings of $29,010.
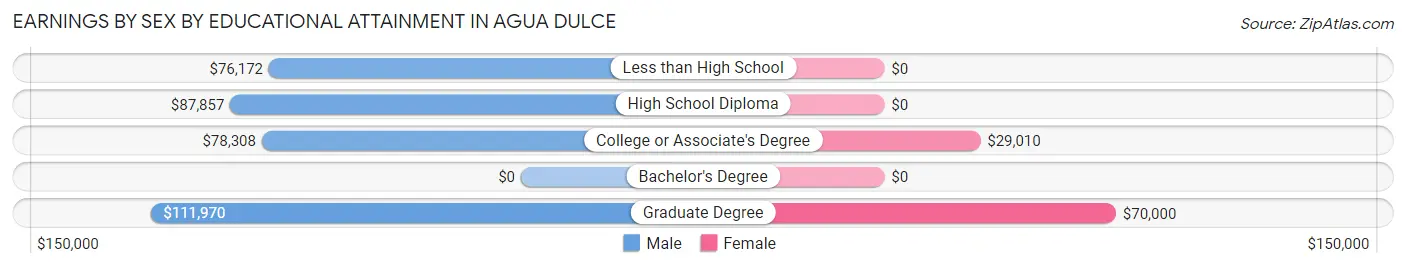
| Educational Attainment | Male Income | Female Income |
| Less than High School | $76,172 | $0 |
| High School Diploma | $87,857 | $0 |
| College or Associate's Degree | $78,308 | $29,010 |
| Bachelor's Degree | - | - |
| Graduate Degree | $111,970 | $70,000 |
| Total | $79,148 | $34,350 |
Family Income in Agua Dulce
Family Income Brackets in Agua Dulce
According to the Agua Dulce family income data, there are 275 families falling into the $100,000 to $149,999 income range, which is the most common income bracket and makes up 31.7% of all families.
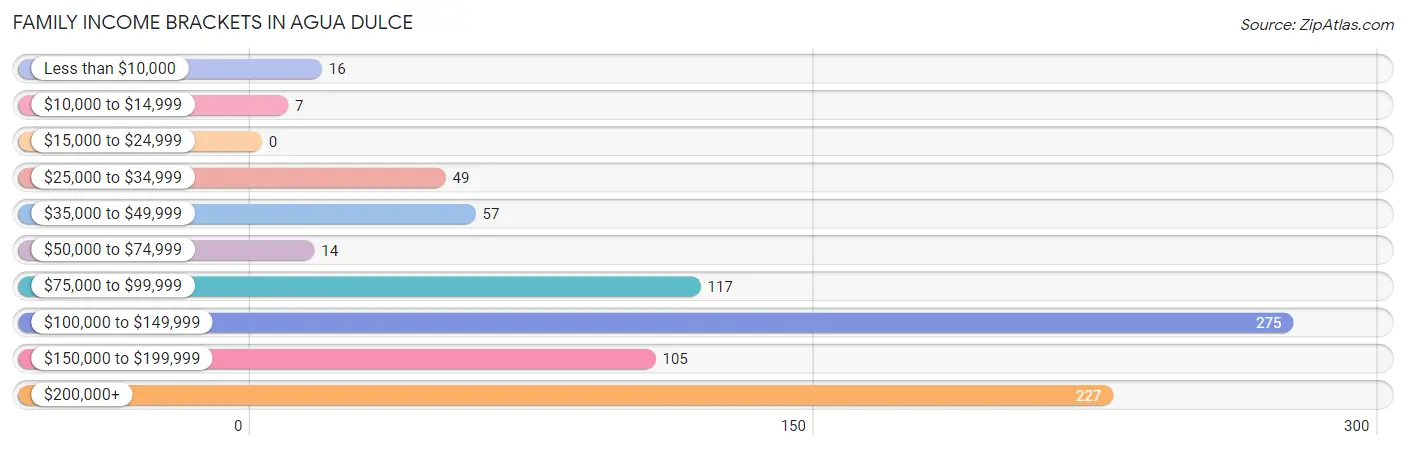
| Income Bracket | # Families | % Families |
| Less than $10,000 | 16 | 1.8% |
| $10,000 to $14,999 | 7 | 0.8% |
| $15,000 to $24,999 | 0 | 0.0% |
| $25,000 to $34,999 | 49 | 5.7% |
| $35,000 to $49,999 | 57 | 6.6% |
| $50,000 to $74,999 | 14 | 1.6% |
| $75,000 to $99,999 | 117 | 13.5% |
| $100,000 to $149,999 | 275 | 31.7% |
| $150,000 to $199,999 | 105 | 12.1% |
| $200,000+ | 227 | 26.2% |
Family Income by Famaliy Size in Agua Dulce
4-person families (143 | 16.5%) account for the highest median family income in Agua Dulce with $146,563 per family, while 2-person families (451 | 52.0%) have the highest median income of $71,294 per family member.
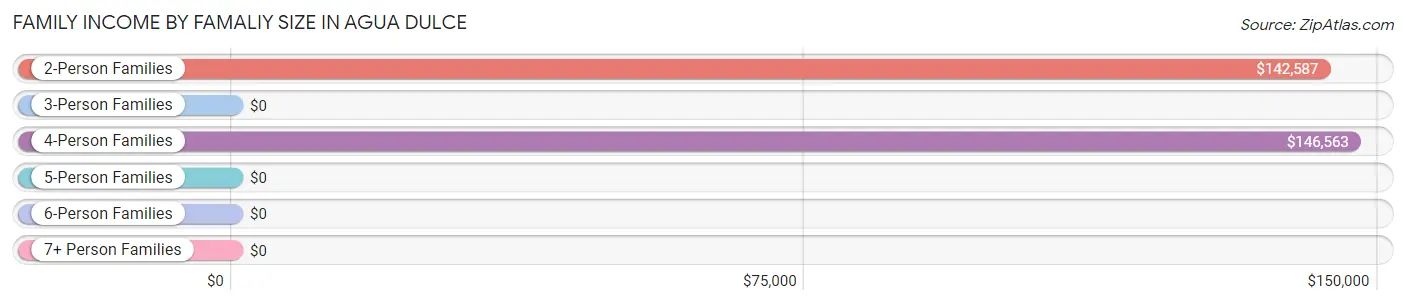
| Income Bracket | # Families | Median Income |
| 2-Person Families | 451 (52.0%) | $142,587 |
| 3-Person Families | 181 (20.9%) | $0 |
| 4-Person Families | 143 (16.5%) | $146,563 |
| 5-Person Families | 39 (4.5%) | $0 |
| 6-Person Families | 24 (2.8%) | $0 |
| 7+ Person Families | 29 (3.3%) | $0 |
| Total | 867 (100.0%) | $128,958 |
Family Income by Number of Earners in Agua Dulce
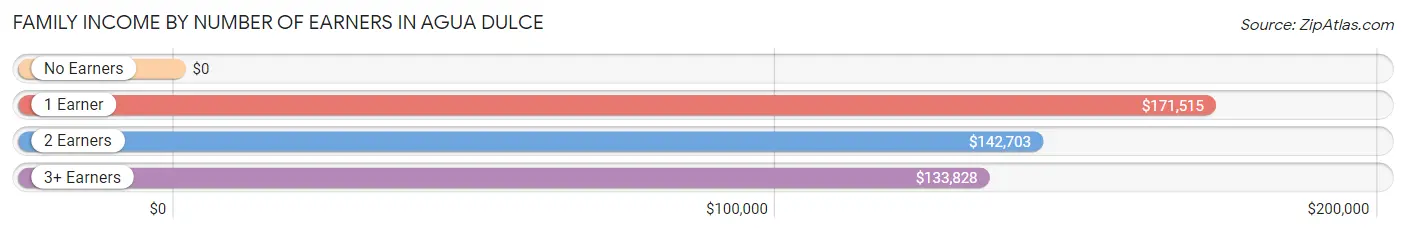
| Number of Earners | # Families | Median Income |
| No Earners | 125 (14.4%) | $0 |
| 1 Earner | 150 (17.3%) | $171,515 |
| 2 Earners | 433 (49.9%) | $142,703 |
| 3+ Earners | 159 (18.3%) | $133,828 |
| Total | 867 (100.0%) | $128,958 |
Household Income in Agua Dulce
Household Income Brackets in Agua Dulce
With 311 households falling in the category, the $100,000 to $149,999 income range is the most frequent in Agua Dulce, accounting for 27.2% of all households. In contrast, only 21 households (1.8%) fall into the less than $10,000 income bracket, making it the least populous group.
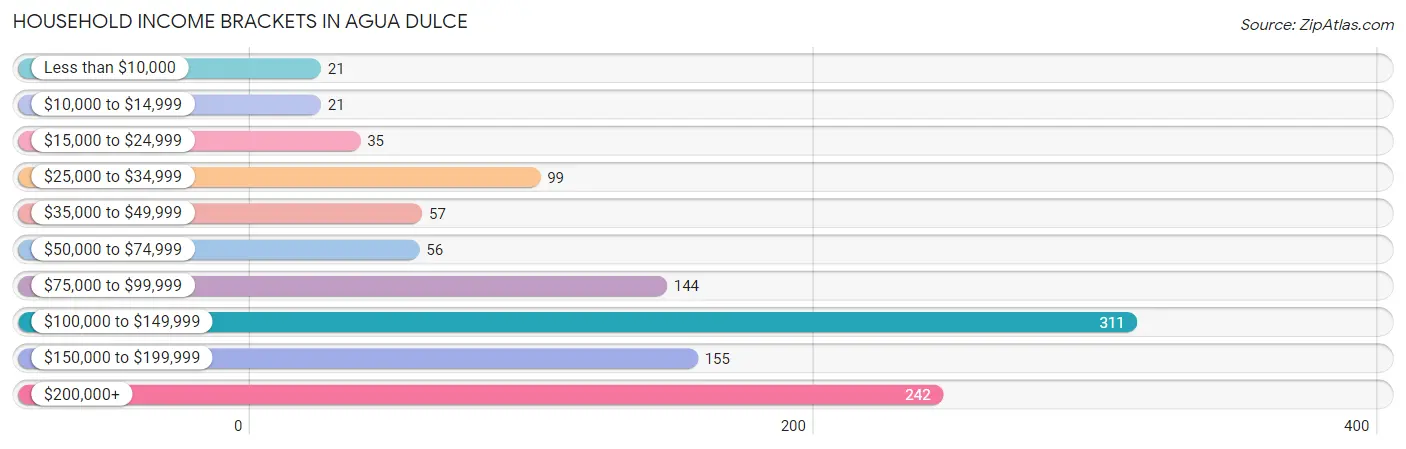
| Income Bracket | # Households | % Households |
| Less than $10,000 | 21 | 1.8% |
| $10,000 to $14,999 | 21 | 1.8% |
| $15,000 to $24,999 | 35 | 3.1% |
| $25,000 to $34,999 | 99 | 8.7% |
| $35,000 to $49,999 | 57 | 5.0% |
| $50,000 to $74,999 | 56 | 4.9% |
| $75,000 to $99,999 | 144 | 12.6% |
| $100,000 to $149,999 | 311 | 27.2% |
| $150,000 to $199,999 | 155 | 13.6% |
| $200,000+ | 242 | 21.2% |
Household Income by Householder Age in Agua Dulce
The median household income in Agua Dulce is $121,250, with the highest median household income of $145,313 found in the 45 to 64 years age bracket for the primary householder. A total of 519 households (45.4%) fall into this category. Meanwhile, the 15 to 24 years age bracket for the primary householder has the lowest median household income of $0, with 7 households (0.6%) in this group.
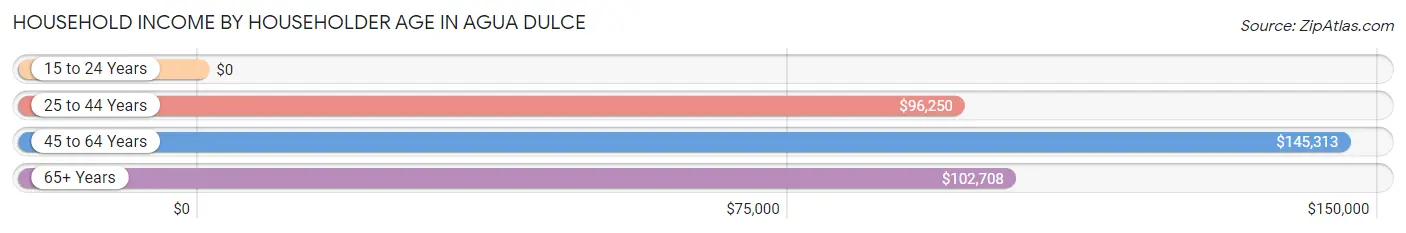
| Income Bracket | # Households | Median Income |
| 15 to 24 Years | 7 (0.6%) | $0 |
| 25 to 44 Years | 186 (16.3%) | $96,250 |
| 45 to 64 Years | 519 (45.4%) | $145,313 |
| 65+ Years | 431 (37.7%) | $102,708 |
| Total | 1,143 (100.0%) | $121,250 |
Poverty in Agua Dulce
Income Below Poverty by Sex and Age in Agua Dulce
With 5.1% poverty level for males and 17.0% for females among the residents of Agua Dulce, 25 to 34 year old males and 18 to 24 year old females are the most vulnerable to poverty, with 31 males (17.1%) and 61 females (64.2%) in their respective age groups living below the poverty level.
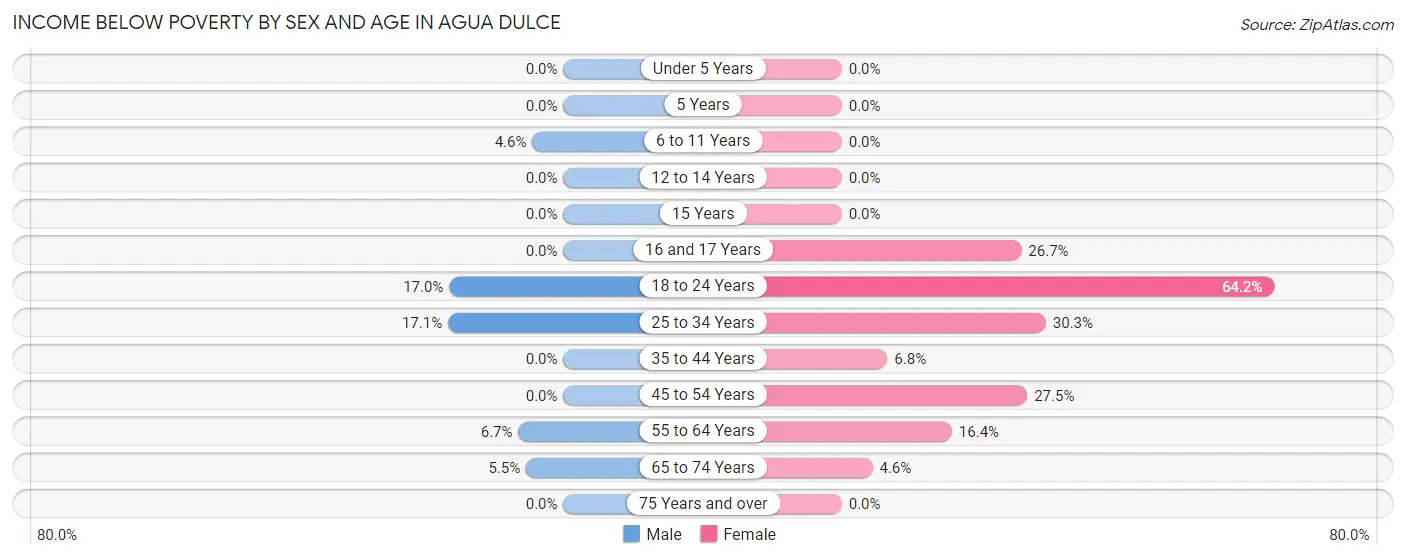
| Age Bracket | Male | Female |
| Under 5 Years | 0 (0.0%) | 0 (0.0%) |
| 5 Years | 0 (0.0%) | 0 (0.0%) |
| 6 to 11 Years | 7 (4.6%) | 0 (0.0%) |
| 12 to 14 Years | 0 (0.0%) | 0 (0.0%) |
| 15 Years | 0 (0.0%) | 0 (0.0%) |
| 16 and 17 Years | 0 (0.0%) | 8 (26.7%) |
| 18 to 24 Years | 10 (17.0%) | 61 (64.2%) |
| 25 to 34 Years | 31 (17.1%) | 50 (30.3%) |
| 35 to 44 Years | 0 (0.0%) | 9 (6.8%) |
| 45 to 54 Years | 0 (0.0%) | 46 (27.5%) |
| 55 to 64 Years | 25 (6.7%) | 68 (16.4%) |
| 65 to 74 Years | 13 (5.5%) | 7 (4.5%) |
| 75 Years and over | 0 (0.0%) | 0 (0.0%) |
| Total | 86 (5.1%) | 249 (17.0%) |
Income Above Poverty by Sex and Age in Agua Dulce
According to the poverty statistics in Agua Dulce, males aged under 5 years and females aged under 5 years are the age groups that are most secure financially, with 100.0% of males and 100.0% of females in these age groups living above the poverty line.
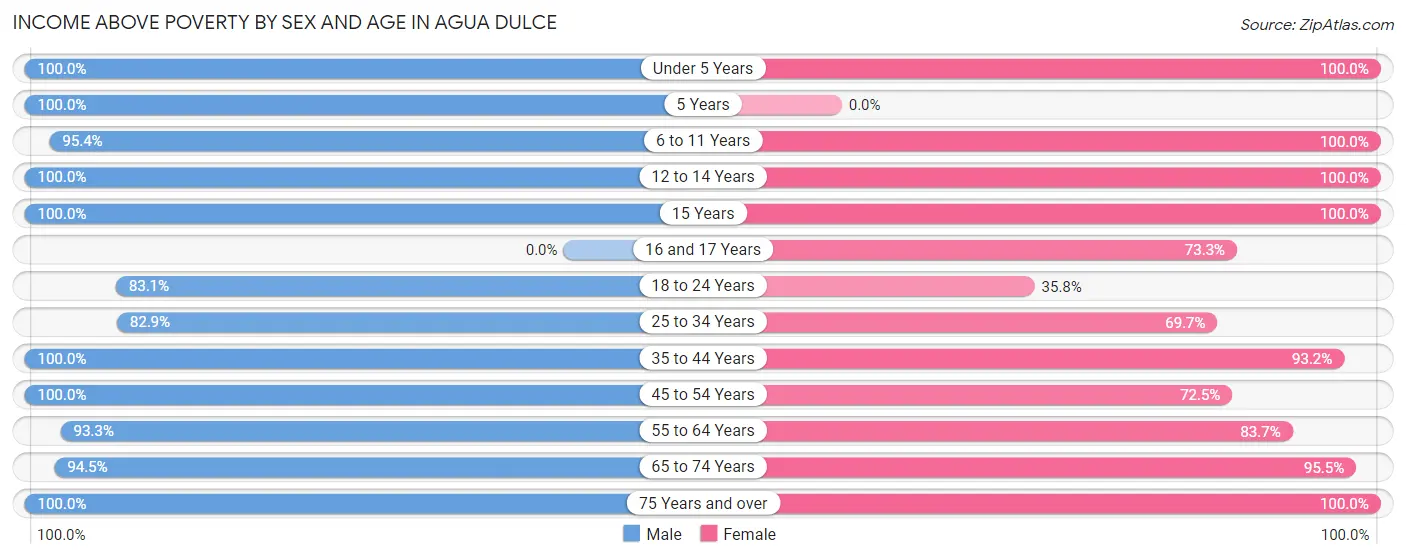
| Age Bracket | Male | Female |
| Under 5 Years | 54 (100.0%) | 69 (100.0%) |
| 5 Years | 8 (100.0%) | 0 (0.0%) |
| 6 to 11 Years | 145 (95.4%) | 28 (100.0%) |
| 12 to 14 Years | 35 (100.0%) | 57 (100.0%) |
| 15 Years | 24 (100.0%) | 9 (100.0%) |
| 16 and 17 Years | 0 (0.0%) | 22 (73.3%) |
| 18 to 24 Years | 49 (83.1%) | 34 (35.8%) |
| 25 to 34 Years | 150 (82.9%) | 115 (69.7%) |
| 35 to 44 Years | 214 (100.0%) | 124 (93.2%) |
| 45 to 54 Years | 159 (100.0%) | 121 (72.5%) |
| 55 to 64 Years | 349 (93.3%) | 348 (83.7%) |
| 65 to 74 Years | 222 (94.5%) | 147 (95.5%) |
| 75 Years and over | 194 (100.0%) | 142 (100.0%) |
| Total | 1,603 (94.9%) | 1,216 (83.0%) |
Income Below Poverty Among Married-Couple Families in Agua Dulce
The poverty statistics for married-couple families in Agua Dulce show that 3.9% or 30 of the total 771 families live below the poverty line. Families with no children have the highest poverty rate of 5.2%, comprising of 30 families. On the other hand, families with 1 or 2 children have the lowest poverty rate of 0.0%, which includes 0 families.
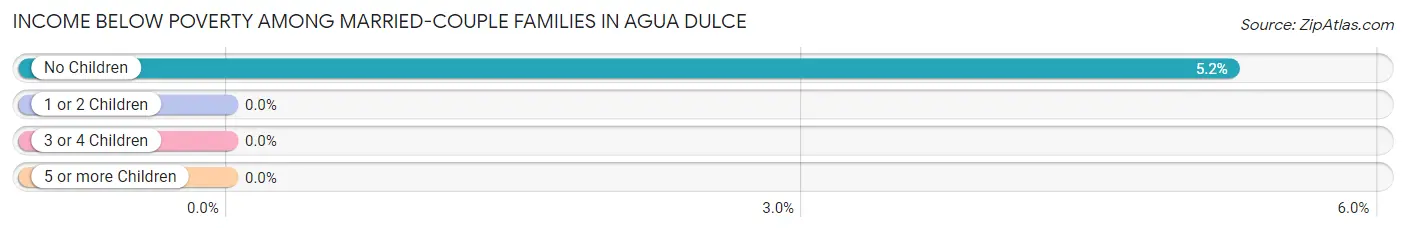
| Children | Above Poverty | Below Poverty |
| No Children | 544 (94.8%) | 30 (5.2%) |
| 1 or 2 Children | 157 (100.0%) | 0 (0.0%) |
| 3 or 4 Children | 24 (100.0%) | 0 (0.0%) |
| 5 or more Children | 16 (100.0%) | 0 (0.0%) |
| Total | 741 (96.1%) | 30 (3.9%) |
Income Below Poverty Among Single-Parent Households in Agua Dulce
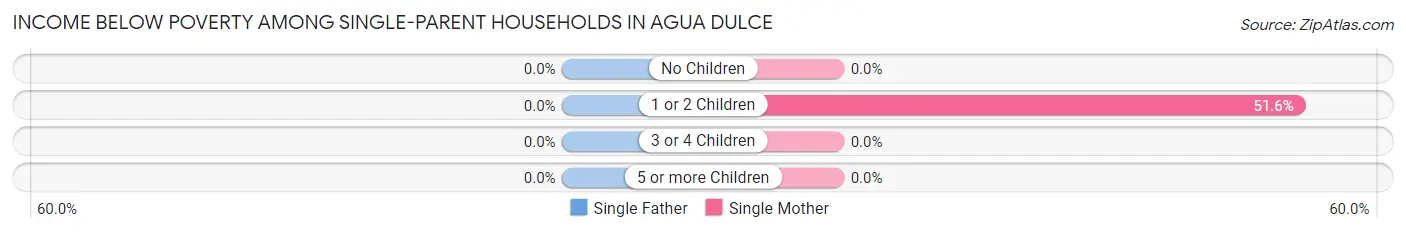
| Children | Single Father | Single Mother |
| No Children | 0 (0.0%) | 0 (0.0%) |
| 1 or 2 Children | 0 (0.0%) | 16 (51.6%) |
| 3 or 4 Children | 0 (0.0%) | 0 (0.0%) |
| 5 or more Children | 0 (0.0%) | 0 (0.0%) |
| Total | 0 (0.0%) | 16 (38.1%) |
Income Below Poverty Among Married-Couple vs Single-Parent Households in Agua Dulce
The poverty data for Agua Dulce shows that 30 of the married-couple family households (3.9%) and 16 of the single-parent households (16.7%) are living below the poverty level. Within the married-couple family households, those with no children have the highest poverty rate, with 30 households (5.2%) falling below the poverty line. Among the single-parent households, those with 1 or 2 children have the highest poverty rate, with 16 household (29.6%) living below poverty.
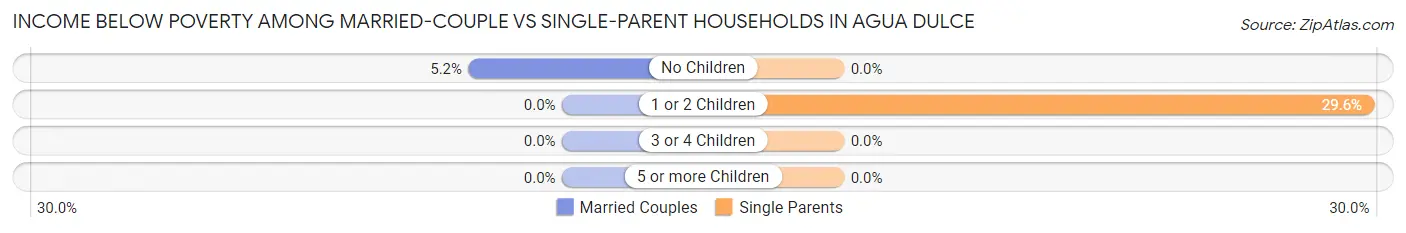
| Children | Married-Couple Families | Single-Parent Households |
| No Children | 30 (5.2%) | 0 (0.0%) |
| 1 or 2 Children | 0 (0.0%) | 16 (29.6%) |
| 3 or 4 Children | 0 (0.0%) | 0 (0.0%) |
| 5 or more Children | 0 (0.0%) | 0 (0.0%) |
| Total | 30 (3.9%) | 16 (16.7%) |
Race in Agua Dulce
The most populous races in Agua Dulce are White / Caucasian (2,058 | 65.1%), Hispanic or Latino (999 | 31.6%), and Some other Race (494 | 15.6%).
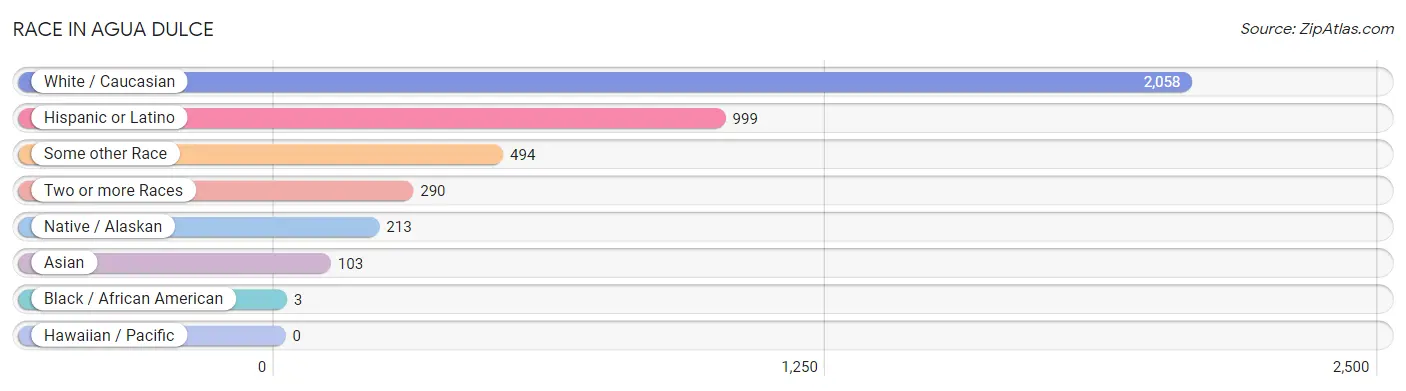
| Race | # Population | % Population |
| Asian | 103 | 3.3% |
| Black / African American | 3 | 0.1% |
| Hawaiian / Pacific | 0 | 0.0% |
| Hispanic or Latino | 999 | 31.6% |
| Native / Alaskan | 213 | 6.7% |
| White / Caucasian | 2,058 | 65.1% |
| Two or more Races | 290 | 9.2% |
| Some other Race | 494 | 15.6% |
| Total | 3,161 | 100.0% |
Ancestry in Agua Dulce
The most populous ancestries reported in Agua Dulce are Mexican (818 | 25.9%), Irish (394 | 12.5%), English (379 | 12.0%), Italian (317 | 10.0%), and German (282 | 8.9%), together accounting for 69.3% of all Agua Dulce residents.
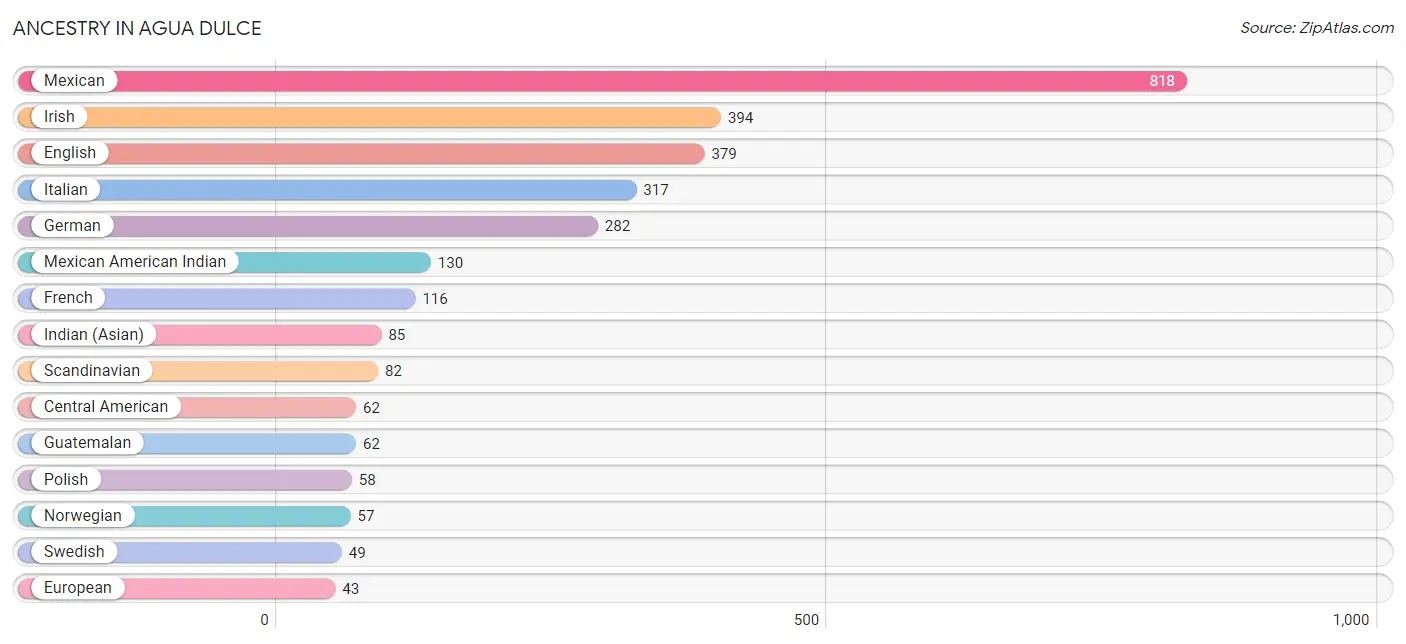
| Ancestry | # Population | % Population |
| African | 3 | 0.1% |
| American | 29 | 0.9% |
| Armenian | 19 | 0.6% |
| Austrian | 32 | 1.0% |
| Bhutanese | 21 | 0.7% |
| Central American | 62 | 2.0% |
| Cherokee | 9 | 0.3% |
| Colombian | 28 | 0.9% |
| Cuban | 5 | 0.2% |
| Czech | 6 | 0.2% |
| Czechoslovakian | 3 | 0.1% |
| Danish | 6 | 0.2% |
| Dutch | 22 | 0.7% |
| Eastern European | 31 | 1.0% |
| English | 379 | 12.0% |
| European | 43 | 1.4% |
| Finnish | 7 | 0.2% |
| French | 116 | 3.7% |
| German | 282 | 8.9% |
| Guatemalan | 62 | 2.0% |
| Indian (Asian) | 85 | 2.7% |
| Irish | 394 | 12.5% |
| Italian | 317 | 10.0% |
| Korean | 27 | 0.9% |
| Latvian | 6 | 0.2% |
| Mexican | 818 | 25.9% |
| Mexican American Indian | 130 | 4.1% |
| Norwegian | 57 | 1.8% |
| Polish | 58 | 1.8% |
| Portuguese | 5 | 0.2% |
| Russian | 11 | 0.4% |
| Scandinavian | 82 | 2.6% |
| Scottish | 12 | 0.4% |
| Slavic | 25 | 0.8% |
| South American | 28 | 0.9% |
| Spaniard | 35 | 1.1% |
| Spanish | 31 | 1.0% |
| Subsaharan African | 3 | 0.1% |
| Swedish | 49 | 1.5% |
| Welsh | 19 | 0.6% | View All 40 Rows |
Immigrants in Agua Dulce
The most numerous immigrant groups reported in Agua Dulce came from Central America (384 | 12.1%), Latin America (384 | 12.1%), Mexico (368 | 11.6%), Asia (98 | 3.1%), and South Central Asia (57 | 1.8%), together accounting for 40.8% of all Agua Dulce residents.
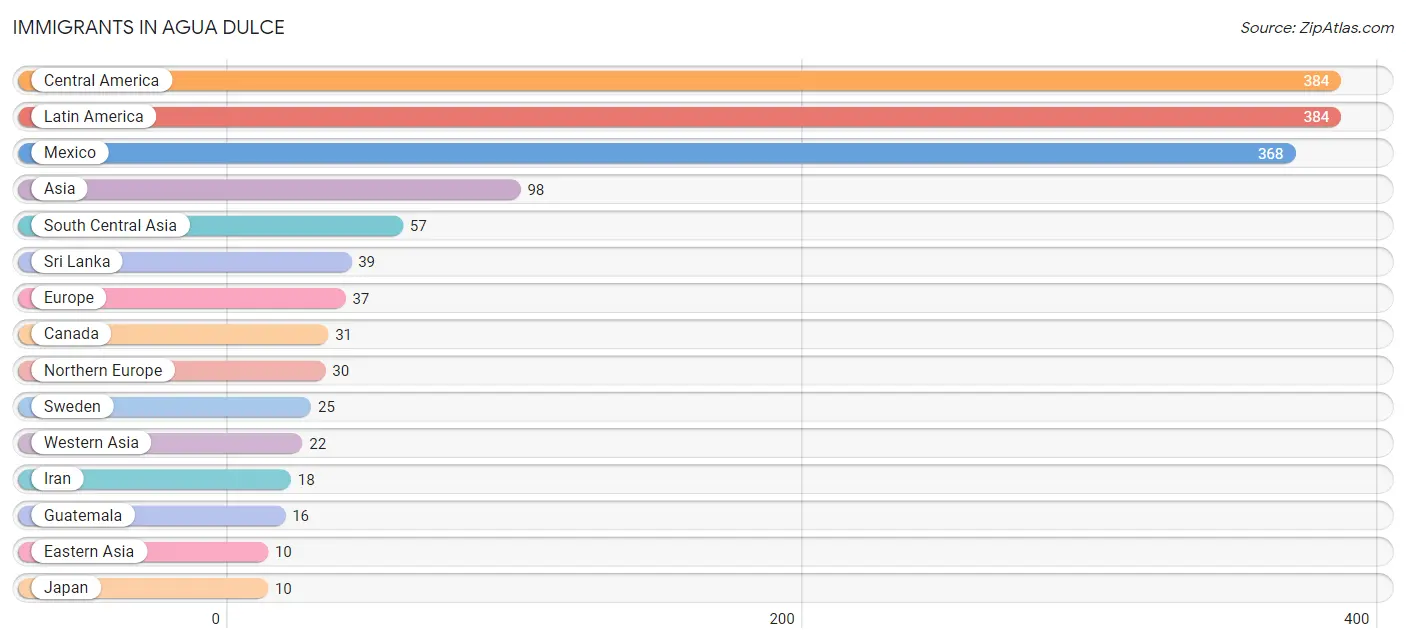
| Immigration Origin | # Population | % Population |
| Asia | 98 | 3.1% |
| Canada | 31 | 1.0% |
| Central America | 384 | 12.1% |
| Eastern Asia | 10 | 0.3% |
| Europe | 37 | 1.2% |
| Guatemala | 16 | 0.5% |
| Iran | 18 | 0.6% |
| Italy | 7 | 0.2% |
| Japan | 10 | 0.3% |
| Latin America | 384 | 12.1% |
| Mexico | 368 | 11.6% |
| Northern Europe | 30 | 0.9% |
| South Central Asia | 57 | 1.8% |
| South Eastern Asia | 9 | 0.3% |
| Southern Europe | 7 | 0.2% |
| Sri Lanka | 39 | 1.2% |
| Sweden | 25 | 0.8% |
| Thailand | 9 | 0.3% |
| Western Asia | 22 | 0.7% | View All 19 Rows |
Sex and Age in Agua Dulce
Sex and Age in Agua Dulce
The most populous age groups in Agua Dulce are 60 to 64 Years (240 | 14.1%) for men and 60 to 64 Years (252 | 17.2%) for women.
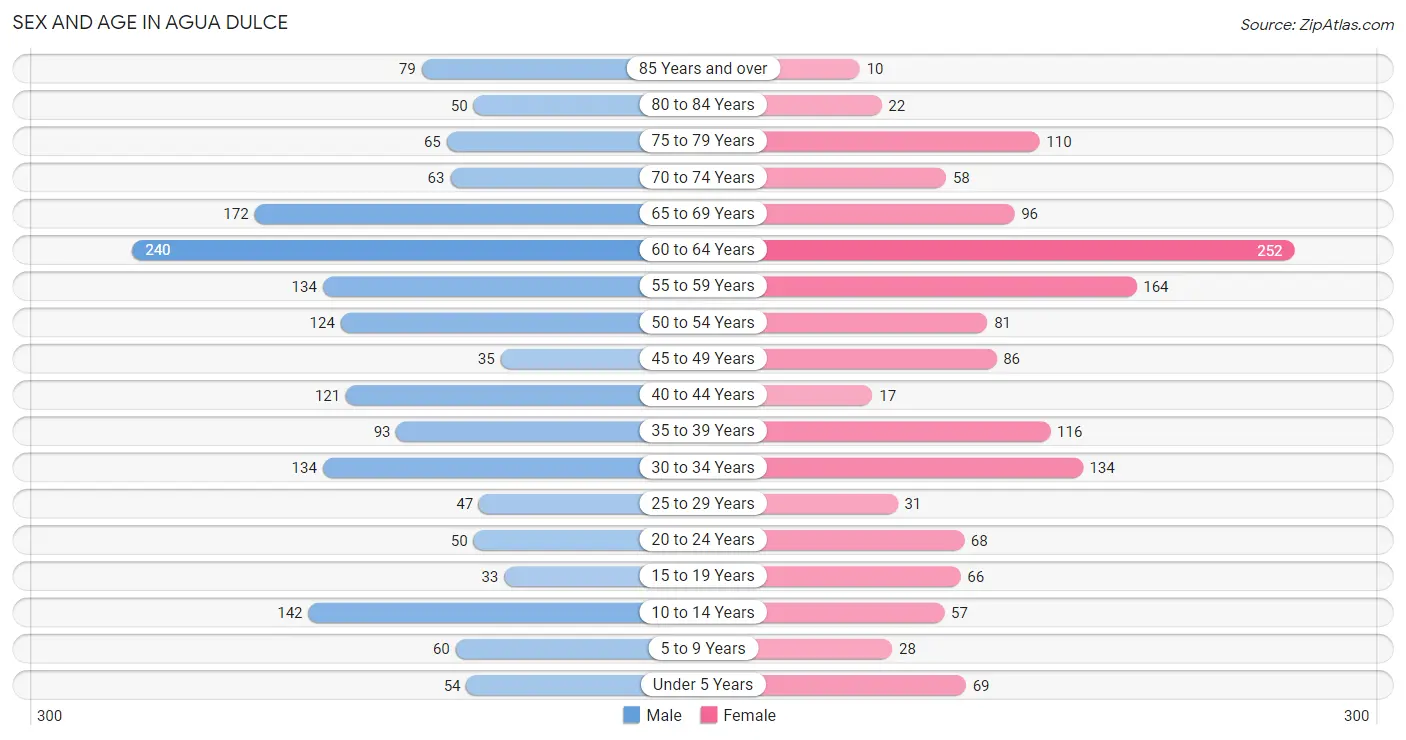
| Age Bracket | Male | Female |
| Under 5 Years | 54 (3.2%) | 69 (4.7%) |
| 5 to 9 Years | 60 (3.5%) | 28 (1.9%) |
| 10 to 14 Years | 142 (8.4%) | 57 (3.9%) |
| 15 to 19 Years | 33 (1.9%) | 66 (4.5%) |
| 20 to 24 Years | 50 (2.9%) | 68 (4.6%) |
| 25 to 29 Years | 47 (2.8%) | 31 (2.1%) |
| 30 to 34 Years | 134 (7.9%) | 134 (9.1%) |
| 35 to 39 Years | 93 (5.5%) | 116 (7.9%) |
| 40 to 44 Years | 121 (7.1%) | 17 (1.2%) |
| 45 to 49 Years | 35 (2.1%) | 86 (5.9%) |
| 50 to 54 Years | 124 (7.3%) | 81 (5.5%) |
| 55 to 59 Years | 134 (7.9%) | 164 (11.2%) |
| 60 to 64 Years | 240 (14.1%) | 252 (17.2%) |
| 65 to 69 Years | 172 (10.1%) | 96 (6.6%) |
| 70 to 74 Years | 63 (3.7%) | 58 (4.0%) |
| 75 to 79 Years | 65 (3.8%) | 110 (7.5%) |
| 80 to 84 Years | 50 (2.9%) | 22 (1.5%) |
| 85 Years and over | 79 (4.7%) | 10 (0.7%) |
| Total | 1,696 (100.0%) | 1,465 (100.0%) |
Families and Households in Agua Dulce
Median Family Size in Agua Dulce
The median family size in Agua Dulce is 3.15 persons per family, with single female/mother families (42 | 4.8%) accounting for the largest median family size of 3.33 persons per family. On the other hand, single male/father families (54 | 6.2%) represent the smallest median family size with 2.69 persons per family.
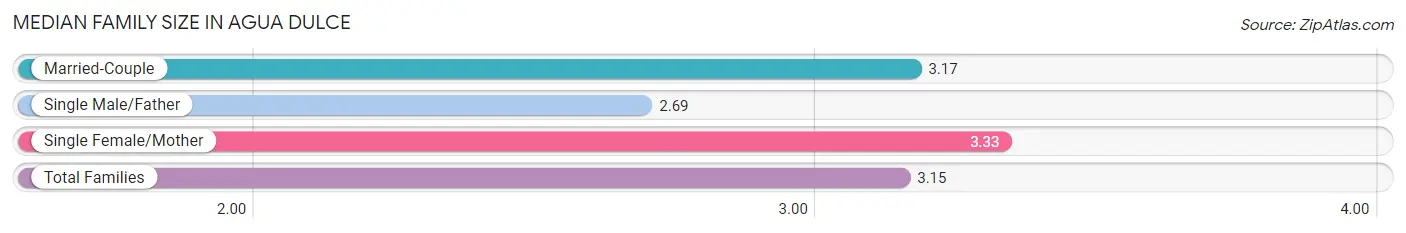
| Family Type | # Families | Family Size |
| Married-Couple | 771 (88.9%) | 3.17 |
| Single Male/Father | 54 (6.2%) | 2.69 |
| Single Female/Mother | 42 (4.8%) | 3.33 |
| Total Families | 867 (100.0%) | 3.15 |
Median Household Size in Agua Dulce
The median household size in Agua Dulce is 2.76 persons per household, with single male/father households (54 | 4.7%) accounting for the largest median household size of 3.93 persons per household. non-family households (276 | 24.1%) represent the smallest median household size with 1.13 persons per household.
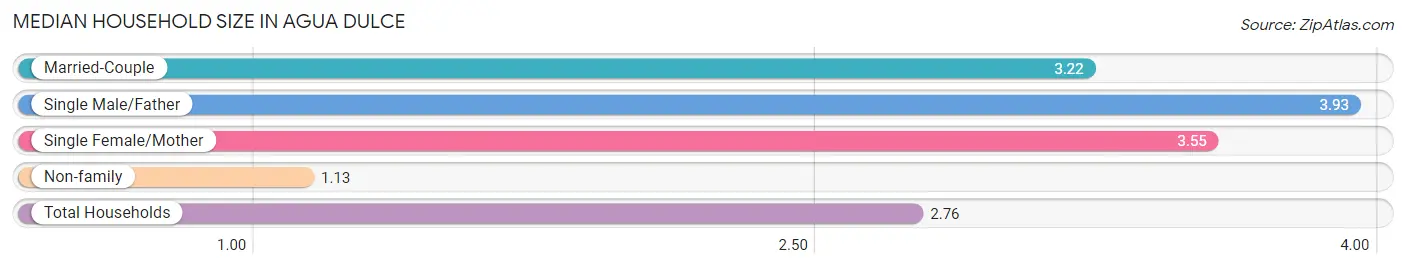
| Household Type | # Households | Household Size |
| Married-Couple | 771 (67.4%) | 3.22 |
| Single Male/Father | 54 (4.7%) | 3.93 |
| Single Female/Mother | 42 (3.7%) | 3.55 |
| Non-family | 276 (24.1%) | 1.13 |
| Total Households | 1,143 (100.0%) | 2.76 |
Household Size by Marriage Status in Agua Dulce
Out of a total of 1,143 households in Agua Dulce, 867 (75.8%) are family households, while 276 (24.1%) are nonfamily households. The most numerous type of family households are 2-person households, comprising 408, and the most common type of nonfamily households are 1-person households, comprising 240.
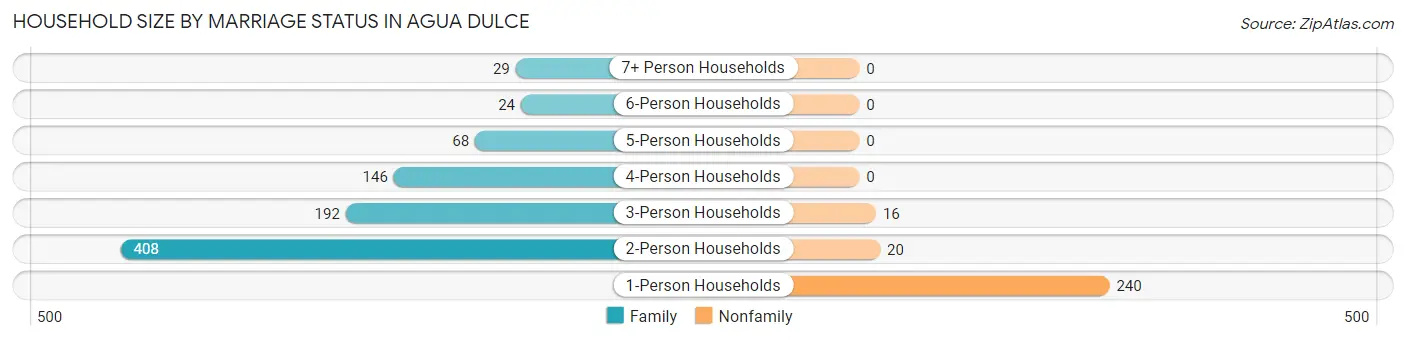
| Household Size | Family Households | Nonfamily Households |
| 1-Person Households | - | 240 (21.0%) |
| 2-Person Households | 408 (35.7%) | 20 (1.8%) |
| 3-Person Households | 192 (16.8%) | 16 (1.4%) |
| 4-Person Households | 146 (12.8%) | 0 (0.0%) |
| 5-Person Households | 68 (5.9%) | 0 (0.0%) |
| 6-Person Households | 24 (2.1%) | 0 (0.0%) |
| 7+ Person Households | 29 (2.5%) | 0 (0.0%) |
| Total | 867 (75.8%) | 276 (24.1%) |
Female Fertility in Agua Dulce
Fertility by Age in Agua Dulce
Average fertility rate in Agua Dulce is 88.0 births per 1,000 women. Women in the age bracket of 20 to 34 years have the highest fertility rate with 159.0 births per 1,000 women. Women in the age bracket of 20 to 34 years acount for 80.4% of all women with births.
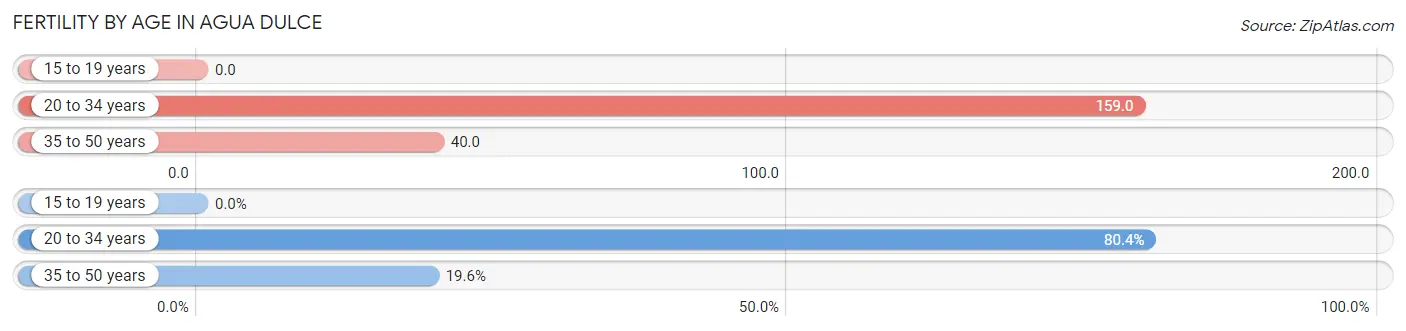
| Age Bracket | Women with Births | Births / 1,000 Women |
| 15 to 19 years | 0 (0.0%) | 0.0 |
| 20 to 34 years | 37 (80.4%) | 159.0 |
| 35 to 50 years | 9 (19.6%) | 40.0 |
| Total | 46 (100.0%) | 88.0 |
Fertility by Age by Marriage Status in Agua Dulce
80.4% of women with births (46) in Agua Dulce are married. The highest percentage of unmarried women with births falls into 35 to 50 years age bracket with 100.0% of them unmarried at the time of birth, while the lowest percentage of unmarried women with births belong to 20 to 34 years age bracket with 0.0% of them unmarried.
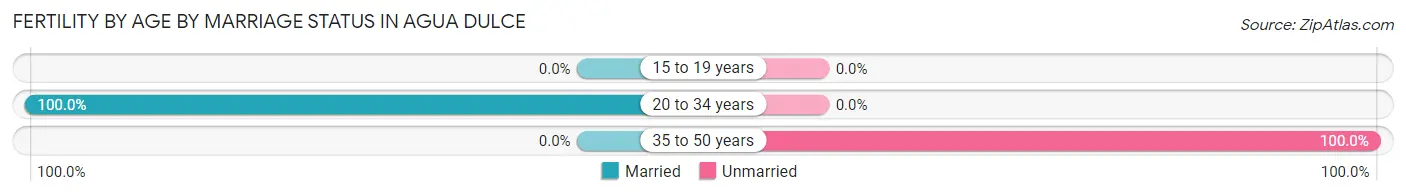
| Age Bracket | Married | Unmarried |
| 15 to 19 years | 0 (0.0%) | 0 (0.0%) |
| 20 to 34 years | 37 (100.0%) | 0 (0.0%) |
| 35 to 50 years | 0 (0.0%) | 9 (100.0%) |
| Total | 37 (80.4%) | 9 (19.6%) |
Fertility by Education in Agua Dulce
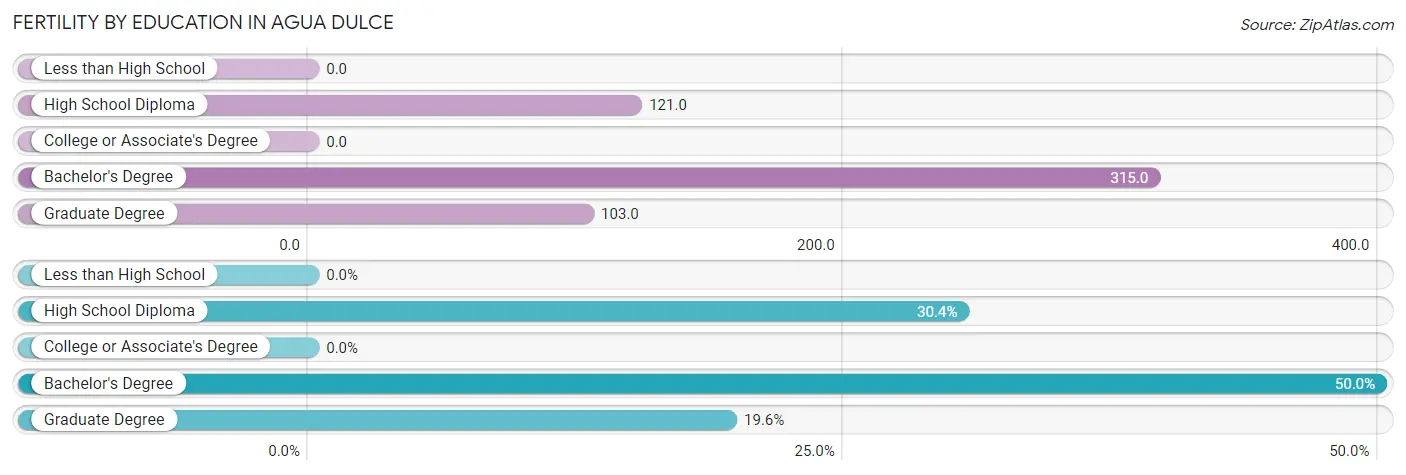
| Educational Attainment | Women with Births | Births / 1,000 Women |
| Less than High School | 0 (0.0%) | 0.0 |
| High School Diploma | 14 (30.4%) | 121.0 |
| College or Associate's Degree | 0 (0.0%) | 0.0 |
| Bachelor's Degree | 23 (50.0%) | 315.0 |
| Graduate Degree | 9 (19.6%) | 103.0 |
| Total | 46 (100.0%) | 88.0 |
Fertility by Education by Marriage Status in Agua Dulce
19.6% of women with births in Agua Dulce are unmarried. Women with the educational attainment of high school diploma are most likely to be married with 100.0% of them married at childbirth, while women with the educational attainment of graduate degree are least likely to be married with 100.0% of them unmarried at childbirth.
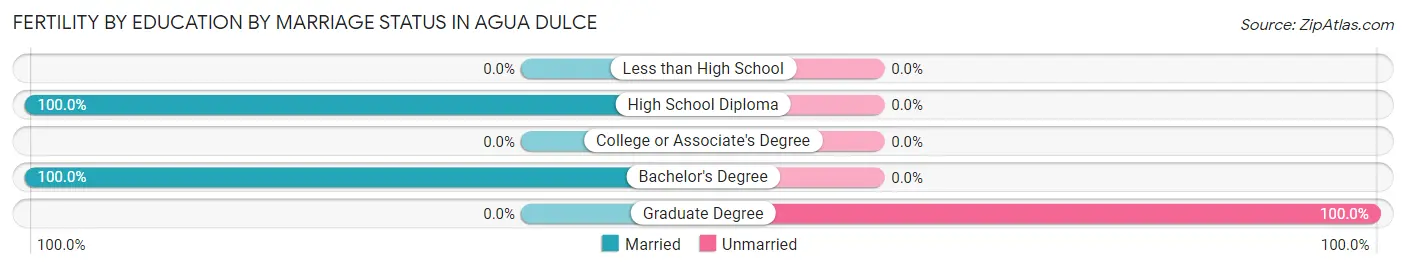
| Educational Attainment | Married | Unmarried |
| Less than High School | 0 (0.0%) | 0 (0.0%) |
| High School Diploma | 14 (100.0%) | 0 (0.0%) |
| College or Associate's Degree | 0 (0.0%) | 0 (0.0%) |
| Bachelor's Degree | 23 (100.0%) | 0 (0.0%) |
| Graduate Degree | 0 (0.0%) | 9 (100.0%) |
| Total | 37 (80.4%) | 9 (19.6%) |
Employment Characteristics in Agua Dulce
Employment by Class of Employer in Agua Dulce
Among the 1,524 employed individuals in Agua Dulce, private company employees (795 | 52.2%), self-employed (not incorporated) (235 | 15.4%), and self-employed (incorporated) (167 | 11.0%) make up the most common classes of employment.
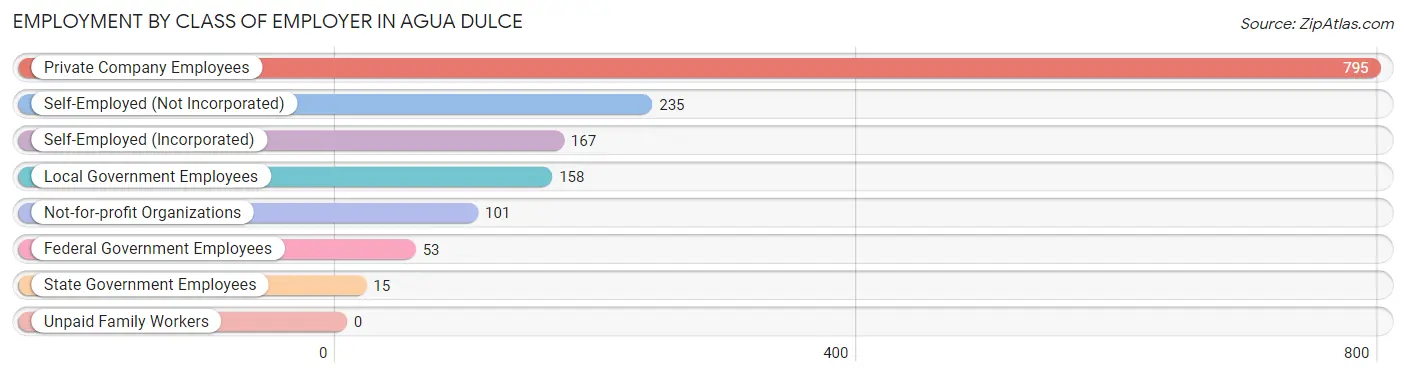
| Employer Class | # Employees | % Employees |
| Private Company Employees | 795 | 52.2% |
| Self-Employed (Incorporated) | 167 | 11.0% |
| Self-Employed (Not Incorporated) | 235 | 15.4% |
| Not-for-profit Organizations | 101 | 6.6% |
| Local Government Employees | 158 | 10.4% |
| State Government Employees | 15 | 1.0% |
| Federal Government Employees | 53 | 3.5% |
| Unpaid Family Workers | 0 | 0.0% |
| Total | 1,524 | 100.0% |
Employment Status by Age in Agua Dulce
According to the labor force statistics for Agua Dulce, out of the total population over 16 years of age (2,718), 60.0% or 1,631 individuals are in the labor force, with 3.9% or 64 of them unemployed. The age group with the highest labor force participation rate is 25 to 29 years, with 100.0% or 78 individuals in the labor force. Within the labor force, the 16 to 19 years age range has the highest percentage of unemployed individuals, with 100.0% or 12 of them being unemployed.
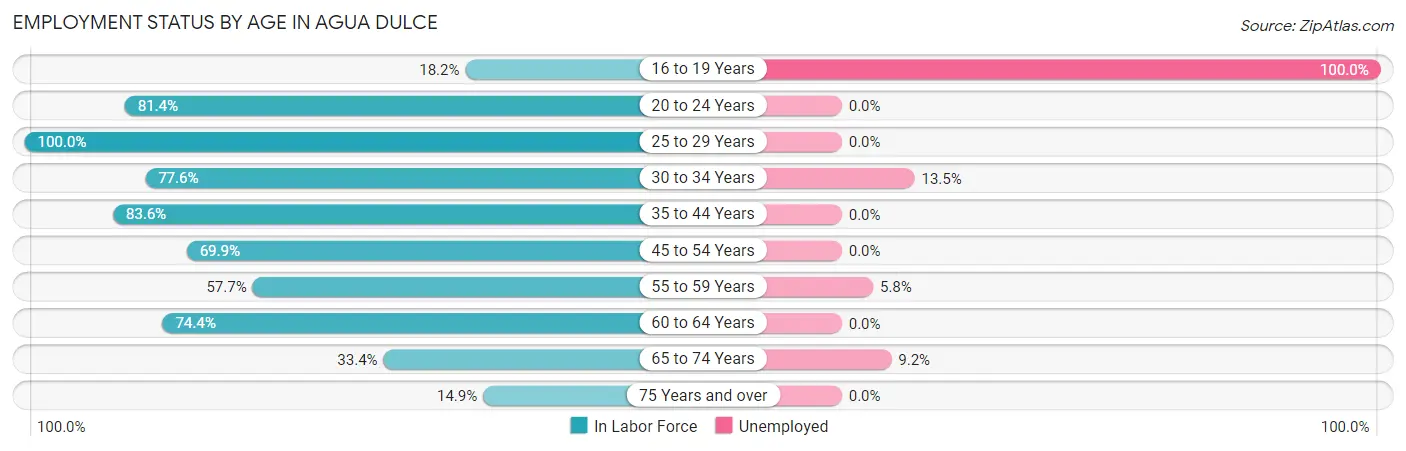
| Age Bracket | In Labor Force | Unemployed |
| 16 to 19 Years | 12 (18.2%) | 12 (100.0%) |
| 20 to 24 Years | 96 (81.4%) | 0 (0.0%) |
| 25 to 29 Years | 78 (100.0%) | 0 (0.0%) |
| 30 to 34 Years | 208 (77.6%) | 28 (13.5%) |
| 35 to 44 Years | 290 (83.6%) | 0 (0.0%) |
| 45 to 54 Years | 228 (69.9%) | 0 (0.0%) |
| 55 to 59 Years | 172 (57.7%) | 10 (5.8%) |
| 60 to 64 Years | 366 (74.4%) | 0 (0.0%) |
| 65 to 74 Years | 130 (33.4%) | 12 (9.2%) |
| 75 Years and over | 50 (14.9%) | 0 (0.0%) |
| Total | 1,631 (60.0%) | 64 (3.9%) |
Employment Status by Educational Attainment in Agua Dulce
According to labor force statistics for Agua Dulce, 74.2% of individuals (1,342) out of the total population between 25 and 64 years of age (1,809) are in the labor force, with 2.9% or 39 of them being unemployed. The group with the highest labor force participation rate are those with the educational attainment of bachelor's degree or higher, with 90.9% or 348 individuals in the labor force. Within the labor force, individuals with bachelor's degree or higher education have the highest percentage of unemployment, with 8.0% or 28 of them being unemployed.
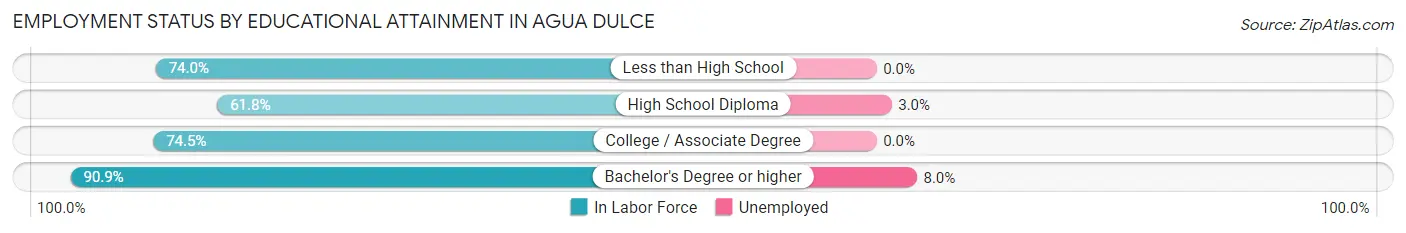
| Educational Attainment | In Labor Force | Unemployed |
| Less than High School | 145 (74.0%) | 0 (0.0%) |
| High School Diploma | 329 (61.8%) | 16 (3.0%) |
| College / Associate Degree | 520 (74.5%) | 0 (0.0%) |
| Bachelor's Degree or higher | 348 (90.9%) | 31 (8.0%) |
| Total | 1,342 (74.2%) | 52 (2.9%) |
Employment Occupations by Sex in Agua Dulce
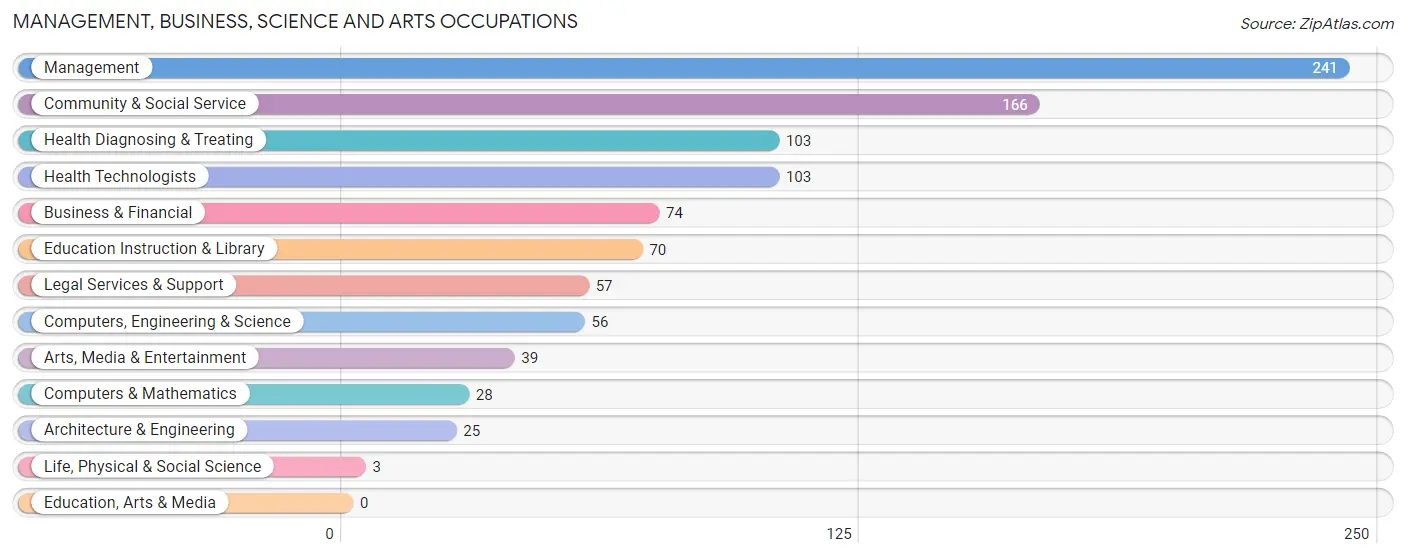
Management, Business, Science and Arts Occupations
The most common Management, Business, Science and Arts occupations in Agua Dulce are Management (241 | 15.6%), Community & Social Service (166 | 10.8%), Health Diagnosing & Treating (103 | 6.7%), Health Technologists (103 | 6.7%), and Business & Financial (74 | 4.8%).
Management, Business, Science and Arts Occupations by Sex
Within the Management, Business, Science and Arts occupations in Agua Dulce, the most male-oriented occupations are Arts, Media & Entertainment (82.1%), Community & Social Service (63.2%), and Legal Services & Support (63.2%), while the most female-oriented occupations are Life, Physical & Social Science (100.0%), Business & Financial (81.1%), and Architecture & Engineering (72.0%).
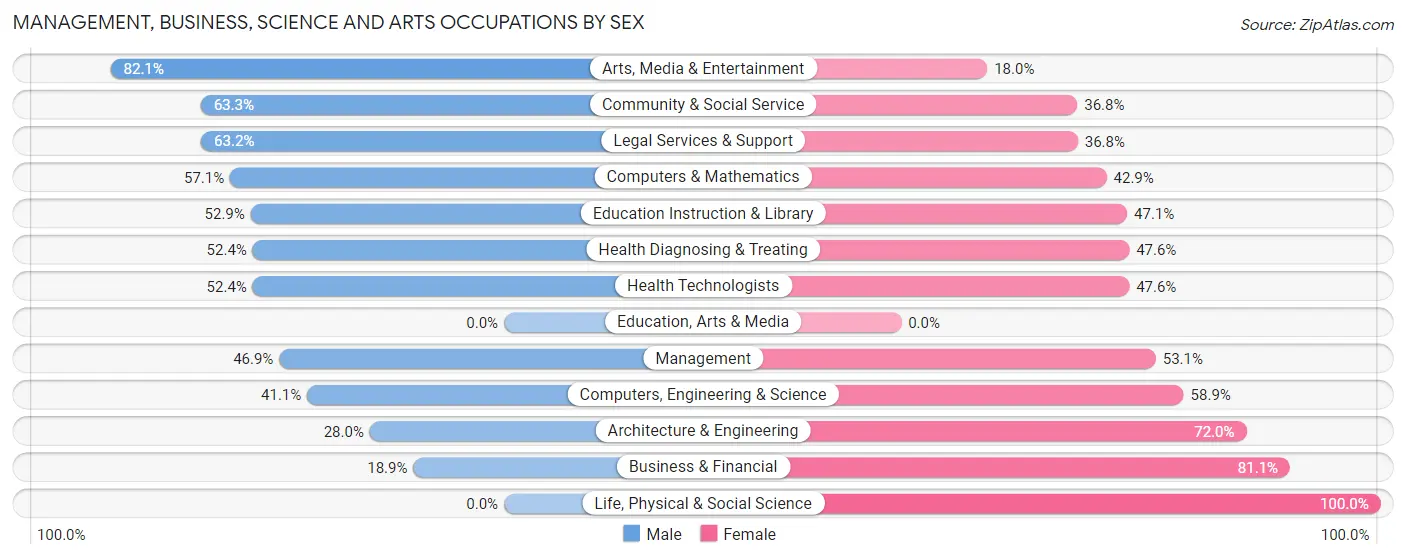
| Occupation | Male | Female |
| Management | 113 (46.9%) | 128 (53.1%) |
| Business & Financial | 14 (18.9%) | 60 (81.1%) |
| Computers, Engineering & Science | 23 (41.1%) | 33 (58.9%) |
| Computers & Mathematics | 16 (57.1%) | 12 (42.9%) |
| Architecture & Engineering | 7 (28.0%) | 18 (72.0%) |
| Life, Physical & Social Science | 0 (0.0%) | 3 (100.0%) |
| Community & Social Service | 105 (63.2%) | 61 (36.7%) |
| Education, Arts & Media | 0 (0.0%) | 0 (0.0%) |
| Legal Services & Support | 36 (63.2%) | 21 (36.8%) |
| Education Instruction & Library | 37 (52.9%) | 33 (47.1%) |
| Arts, Media & Entertainment | 32 (82.1%) | 7 (17.9%) |
| Health Diagnosing & Treating | 54 (52.4%) | 49 (47.6%) |
| Health Technologists | 54 (52.4%) | 49 (47.6%) |
| Total (Category) | 309 (48.3%) | 331 (51.7%) |
| Total (Overall) | 872 (56.6%) | 670 (43.4%) |
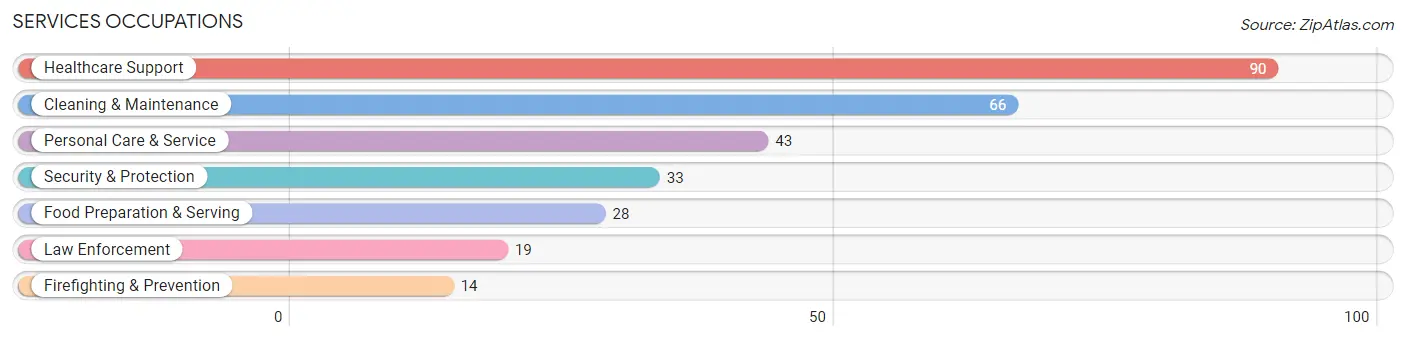
Services Occupations
The most common Services occupations in Agua Dulce are Healthcare Support (90 | 5.8%), Cleaning & Maintenance (66 | 4.3%), Personal Care & Service (43 | 2.8%), Security & Protection (33 | 2.1%), and Food Preparation & Serving (28 | 1.8%).
Services Occupations by Sex
Within the Services occupations in Agua Dulce, the most male-oriented occupations are Security & Protection (100.0%), Firefighting & Prevention (100.0%), and Law Enforcement (100.0%), while the most female-oriented occupations are Healthcare Support (90.0%), Cleaning & Maintenance (39.4%), and Personal Care & Service (30.2%).
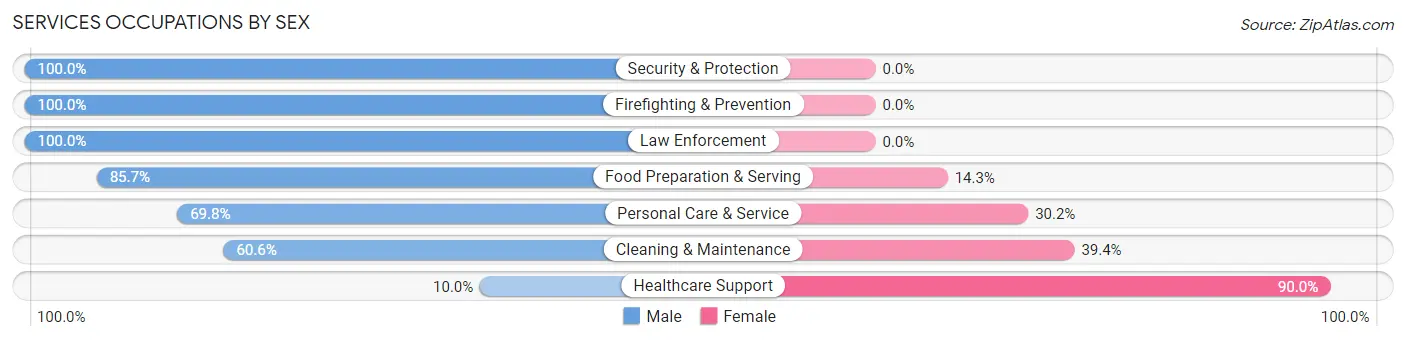
| Occupation | Male | Female |
| Healthcare Support | 9 (10.0%) | 81 (90.0%) |
| Security & Protection | 33 (100.0%) | 0 (0.0%) |
| Firefighting & Prevention | 14 (100.0%) | 0 (0.0%) |
| Law Enforcement | 19 (100.0%) | 0 (0.0%) |
| Food Preparation & Serving | 24 (85.7%) | 4 (14.3%) |
| Cleaning & Maintenance | 40 (60.6%) | 26 (39.4%) |
| Personal Care & Service | 30 (69.8%) | 13 (30.2%) |
| Total (Category) | 136 (52.3%) | 124 (47.7%) |
| Total (Overall) | 872 (56.6%) | 670 (43.4%) |
Sales and Office Occupations
The most common Sales and Office occupations in Agua Dulce are Sales & Related (256 | 16.6%), and Office & Administration (101 | 6.6%).

Sales and Office Occupations by Sex

| Occupation | Male | Female |
| Sales & Related | 204 (79.7%) | 52 (20.3%) |
| Office & Administration | 8 (7.9%) | 93 (92.1%) |
| Total (Category) | 212 (59.4%) | 145 (40.6%) |
| Total (Overall) | 872 (56.6%) | 670 (43.4%) |
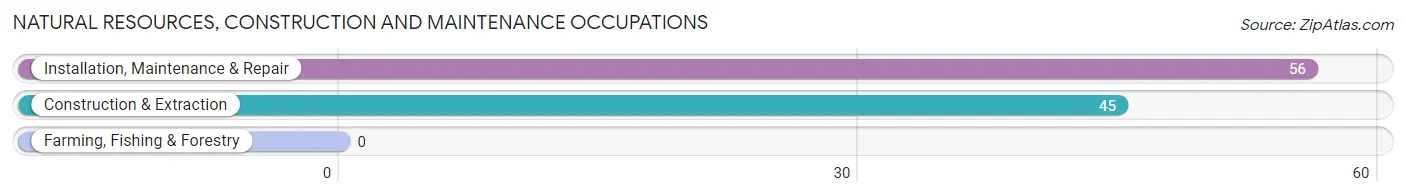
Natural Resources, Construction and Maintenance Occupations
The most common Natural Resources, Construction and Maintenance occupations in Agua Dulce are Installation, Maintenance & Repair (56 | 3.6%), and Construction & Extraction (45 | 2.9%).
Natural Resources, Construction and Maintenance Occupations by Sex
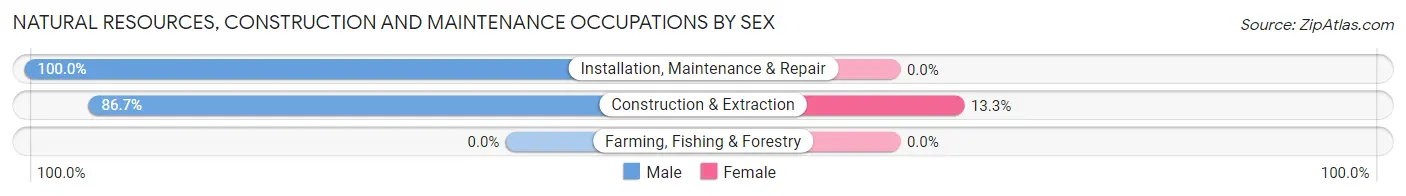
| Occupation | Male | Female |
| Farming, Fishing & Forestry | 0 (0.0%) | 0 (0.0%) |
| Construction & Extraction | 39 (86.7%) | 6 (13.3%) |
| Installation, Maintenance & Repair | 56 (100.0%) | 0 (0.0%) |
| Total (Category) | 95 (94.1%) | 6 (5.9%) |
| Total (Overall) | 872 (56.6%) | 670 (43.4%) |
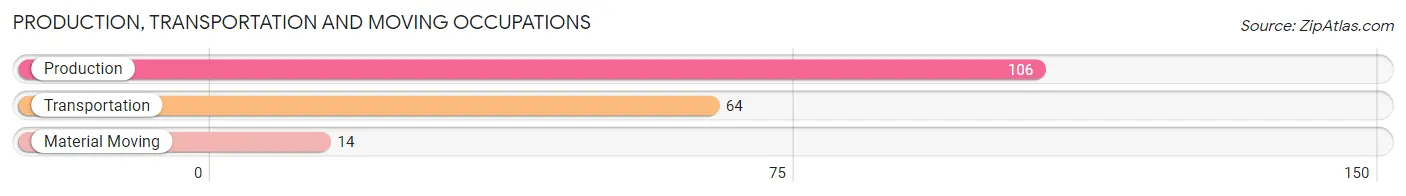
Production, Transportation and Moving Occupations
The most common Production, Transportation and Moving occupations in Agua Dulce are Production (106 | 6.9%), Transportation (64 | 4.2%), and Material Moving (14 | 0.9%).
Production, Transportation and Moving Occupations by Sex
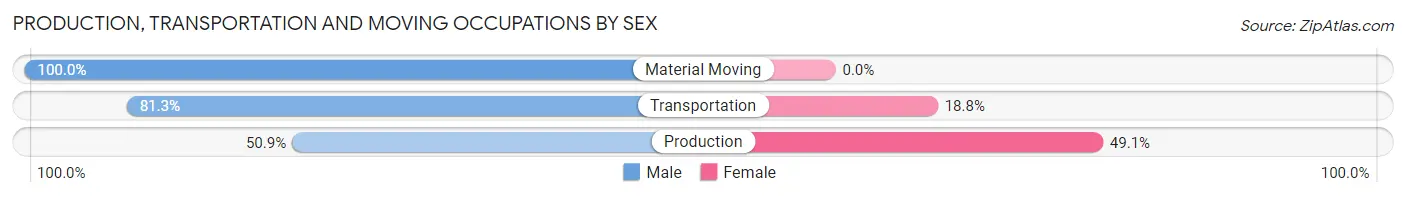
| Occupation | Male | Female |
| Production | 54 (50.9%) | 52 (49.1%) |
| Transportation | 52 (81.2%) | 12 (18.8%) |
| Material Moving | 14 (100.0%) | 0 (0.0%) |
| Total (Category) | 120 (65.2%) | 64 (34.8%) |
| Total (Overall) | 872 (56.6%) | 670 (43.4%) |
Employment Industries by Sex in Agua Dulce
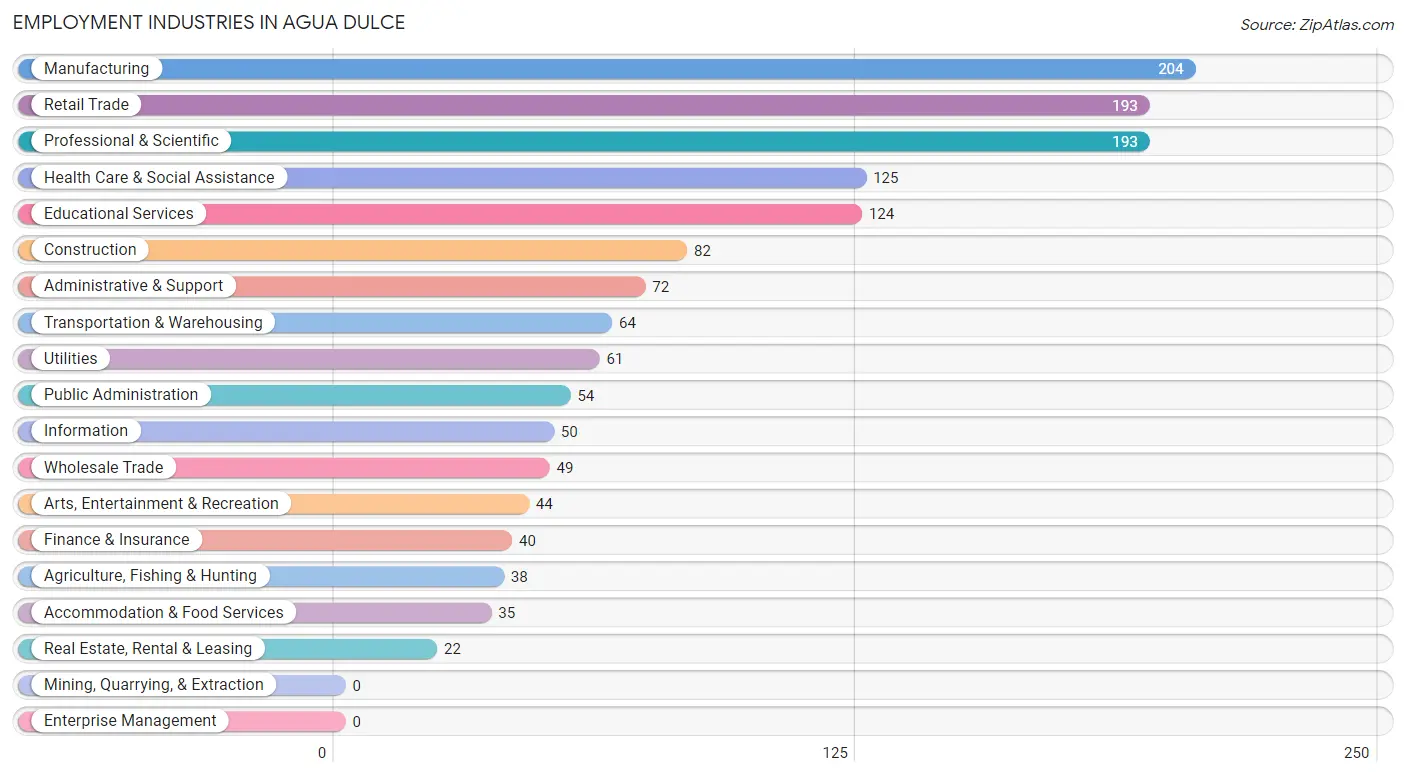
Employment Industries in Agua Dulce
The major employment industries in Agua Dulce include Manufacturing (204 | 13.2%), Retail Trade (193 | 12.5%), Professional & Scientific (193 | 12.5%), Health Care & Social Assistance (125 | 8.1%), and Educational Services (124 | 8.0%).
Employment Industries by Sex in Agua Dulce
The Agua Dulce industries that see more men than women are Wholesale Trade (100.0%), Finance & Insurance (100.0%), and Arts, Entertainment & Recreation (88.6%), whereas the industries that tend to have a higher number of women are Real Estate, Rental & Leasing (100.0%), Health Care & Social Assistance (76.0%), and Professional & Scientific (65.8%).
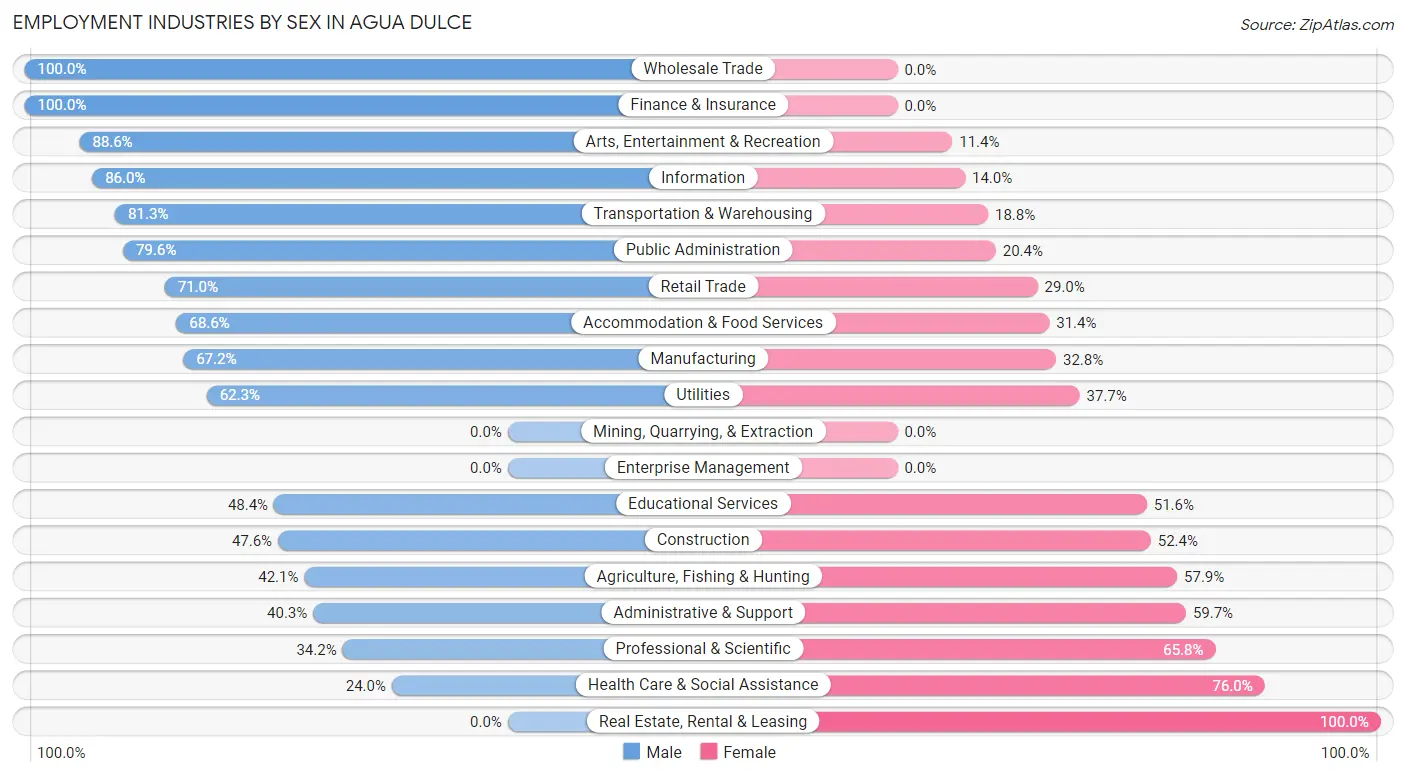
| Industry | Male | Female |
| Agriculture, Fishing & Hunting | 16 (42.1%) | 22 (57.9%) |
| Mining, Quarrying, & Extraction | 0 (0.0%) | 0 (0.0%) |
| Construction | 39 (47.6%) | 43 (52.4%) |
| Manufacturing | 137 (67.2%) | 67 (32.8%) |
| Wholesale Trade | 49 (100.0%) | 0 (0.0%) |
| Retail Trade | 137 (71.0%) | 56 (29.0%) |
| Transportation & Warehousing | 52 (81.2%) | 12 (18.8%) |
| Utilities | 38 (62.3%) | 23 (37.7%) |
| Information | 43 (86.0%) | 7 (14.0%) |
| Finance & Insurance | 40 (100.0%) | 0 (0.0%) |
| Real Estate, Rental & Leasing | 0 (0.0%) | 22 (100.0%) |
| Professional & Scientific | 66 (34.2%) | 127 (65.8%) |
| Enterprise Management | 0 (0.0%) | 0 (0.0%) |
| Administrative & Support | 29 (40.3%) | 43 (59.7%) |
| Educational Services | 60 (48.4%) | 64 (51.6%) |
| Health Care & Social Assistance | 30 (24.0%) | 95 (76.0%) |
| Arts, Entertainment & Recreation | 39 (88.6%) | 5 (11.4%) |
| Accommodation & Food Services | 24 (68.6%) | 11 (31.4%) |
| Public Administration | 43 (79.6%) | 11 (20.4%) |
| Total | 872 (56.6%) | 670 (43.4%) |
Education in Agua Dulce
School Enrollment in Agua Dulce
The most common levels of schooling among the 562 students in Agua Dulce are middle school (137 | 24.4%), college / undergraduate (124 | 22.1%), and elementary school (114 | 20.3%).
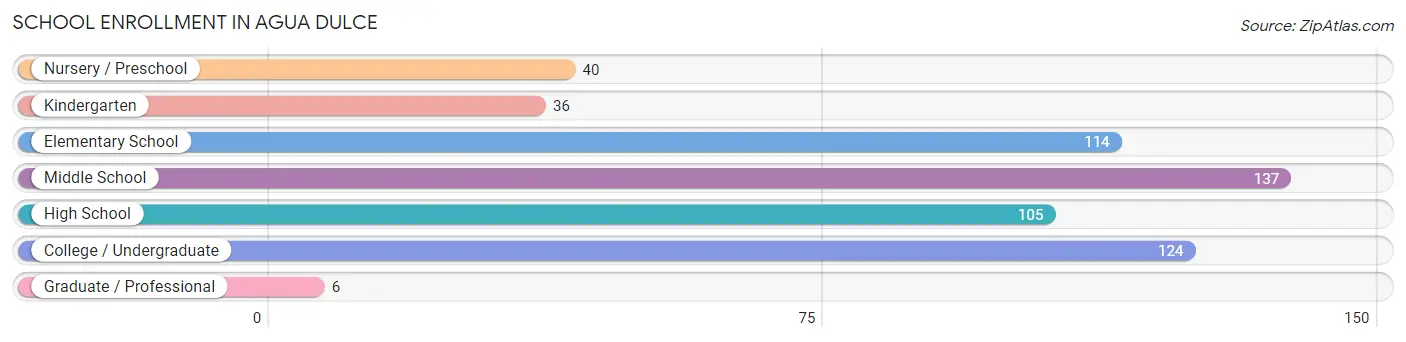
| School Level | # Students | % Students |
| Nursery / Preschool | 40 | 7.1% |
| Kindergarten | 36 | 6.4% |
| Elementary School | 114 | 20.3% |
| Middle School | 137 | 24.4% |
| High School | 105 | 18.7% |
| College / Undergraduate | 124 | 22.1% |
| Graduate / Professional | 6 | 1.1% |
| Total | 562 | 100.0% |
School Enrollment by Age by Funding Source in Agua Dulce
Out of a total of 562 students who are enrolled in schools in Agua Dulce, 122 (21.7%) attend a private institution, while the remaining 440 (78.3%) are enrolled in public schools. The age group of 35 years and over has the highest likelihood of being enrolled in private schools, with 31 (50.0% in the age bracket) enrolled. Conversely, the age group of 3 to 4 year olds has the lowest likelihood of being enrolled in a private school, with 40 (100.0% in the age bracket) attending a public institution.
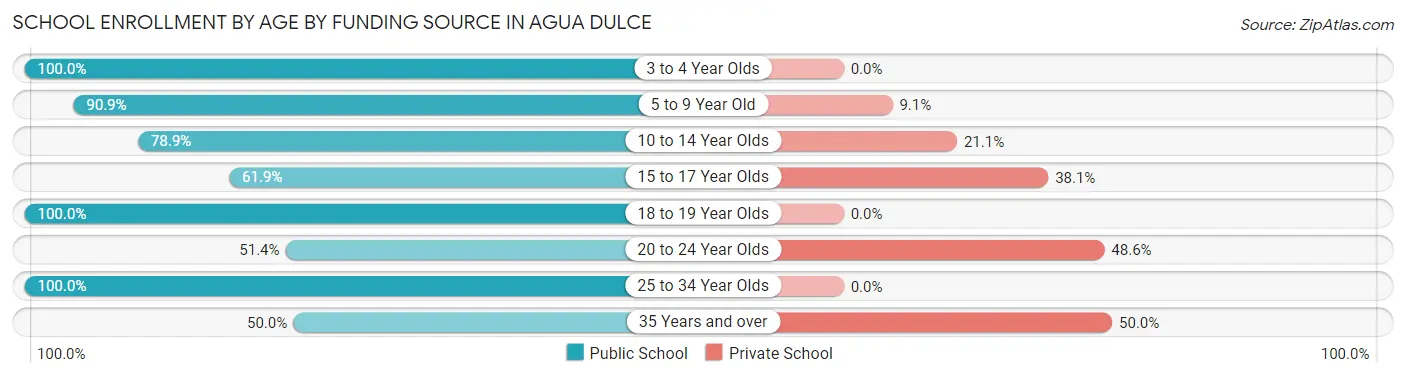
| Age Bracket | Public School | Private School |
| 3 to 4 Year Olds | 40 (100.0%) | 0 (0.0%) |
| 5 to 9 Year Old | 80 (90.9%) | 8 (9.1%) |
| 10 to 14 Year Olds | 157 (78.9%) | 42 (21.1%) |
| 15 to 17 Year Olds | 39 (61.9%) | 24 (38.1%) |
| 18 to 19 Year Olds | 21 (100.0%) | 0 (0.0%) |
| 20 to 24 Year Olds | 18 (51.4%) | 17 (48.6%) |
| 25 to 34 Year Olds | 54 (100.0%) | 0 (0.0%) |
| 35 Years and over | 31 (50.0%) | 31 (50.0%) |
| Total | 440 (78.3%) | 122 (21.7%) |
Educational Attainment by Field of Study in Agua Dulce
Science & technology (81 | 12.6%), engineering (76 | 11.8%), business (76 | 11.8%), literature & languages (68 | 10.6%), and visual & performing arts (63 | 9.8%) are the most common fields of study among 644 individuals in Agua Dulce who have obtained a bachelor's degree or higher.
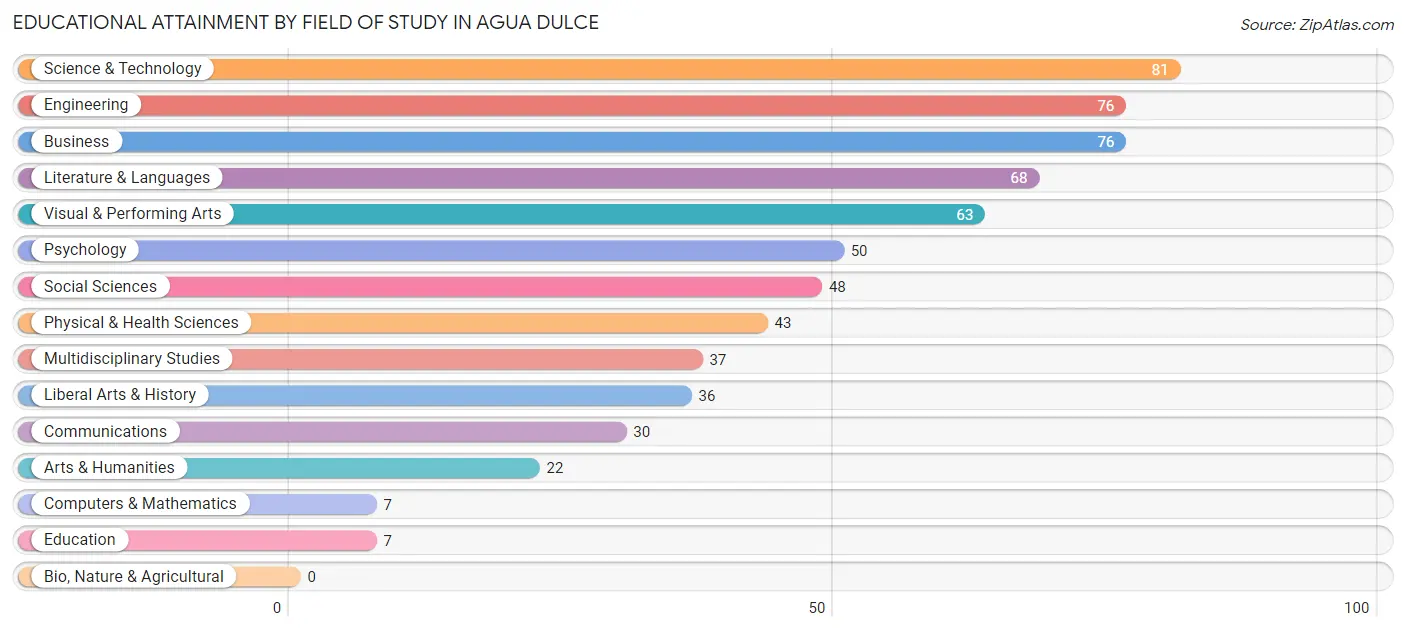
| Field of Study | # Graduates | % Graduates |
| Computers & Mathematics | 7 | 1.1% |
| Bio, Nature & Agricultural | 0 | 0.0% |
| Physical & Health Sciences | 43 | 6.7% |
| Psychology | 50 | 7.8% |
| Social Sciences | 48 | 7.4% |
| Engineering | 76 | 11.8% |
| Multidisciplinary Studies | 37 | 5.8% |
| Science & Technology | 81 | 12.6% |
| Business | 76 | 11.8% |
| Education | 7 | 1.1% |
| Literature & Languages | 68 | 10.6% |
| Liberal Arts & History | 36 | 5.6% |
| Visual & Performing Arts | 63 | 9.8% |
| Communications | 30 | 4.7% |
| Arts & Humanities | 22 | 3.4% |
| Total | 644 | 100.0% |
Transportation & Commute in Agua Dulce
Vehicle Availability by Sex in Agua Dulce
The most prevalent vehicle ownership categories in Agua Dulce are males with 3 vehicles (249, accounting for 29.2%) and females with 3 vehicles (137, making up 37.3%).
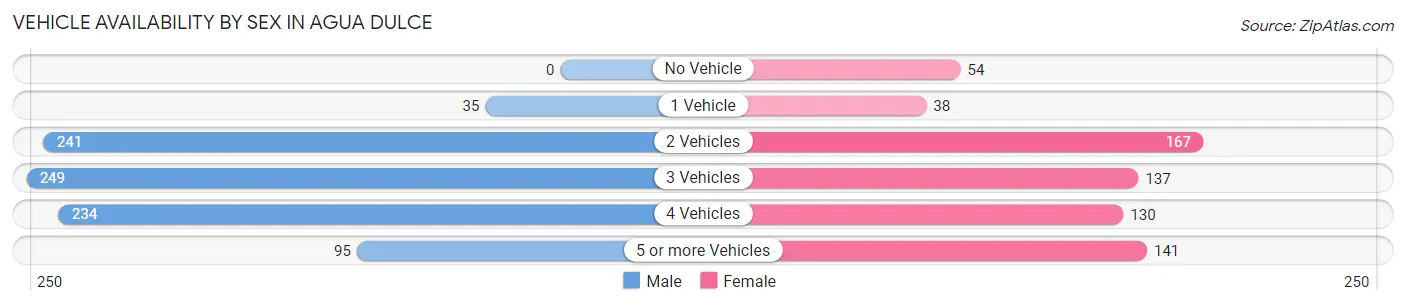
| Vehicles Available | Male | Female |
| No Vehicle | 0 (0.0%) | 54 (8.1%) |
| 1 Vehicle | 35 (4.1%) | 38 (5.7%) |
| 2 Vehicles | 241 (28.2%) | 167 (25.0%) |
| 3 Vehicles | 249 (29.2%) | 137 (20.5%) |
| 4 Vehicles | 234 (27.4%) | 130 (19.5%) |
| 5 or more Vehicles | 95 (11.1%) | 141 (21.1%) |
| Total | 854 (100.0%) | 667 (100.0%) |
Commute Time in Agua Dulce
The most frequently occuring commute durations in Agua Dulce are 30 to 34 minutes (348 commuters, 25.6%), 45 to 59 minutes (287 commuters, 21.1%), and 40 to 44 minutes (134 commuters, 9.9%).
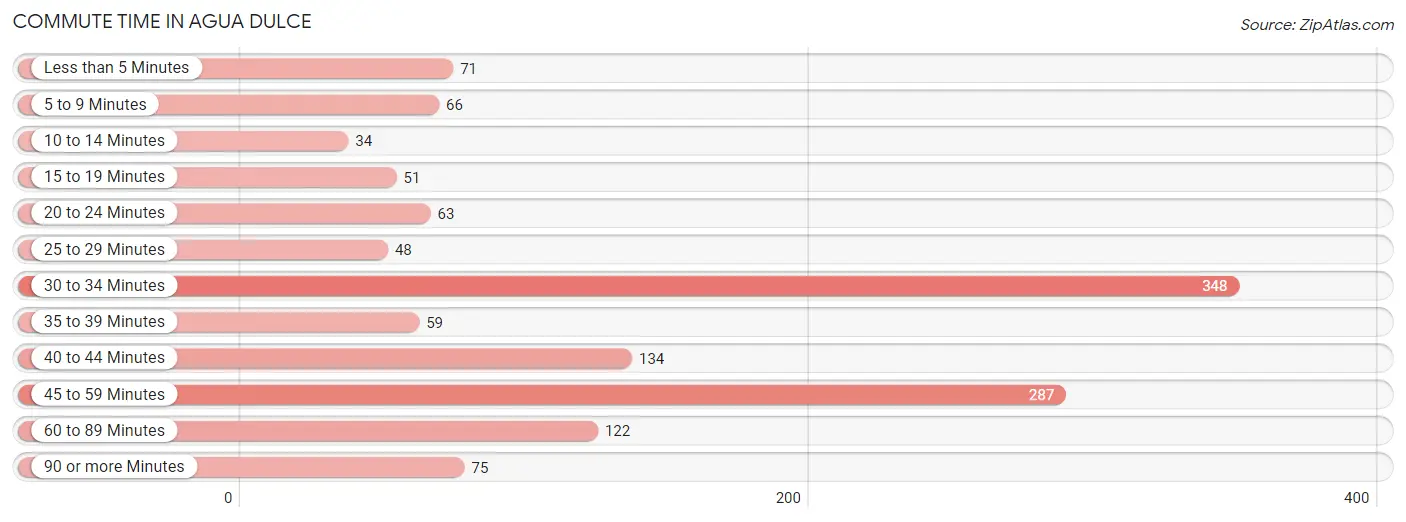
| Commute Time | # Commuters | % Commuters |
| Less than 5 Minutes | 71 | 5.2% |
| 5 to 9 Minutes | 66 | 4.9% |
| 10 to 14 Minutes | 34 | 2.5% |
| 15 to 19 Minutes | 51 | 3.8% |
| 20 to 24 Minutes | 63 | 4.6% |
| 25 to 29 Minutes | 48 | 3.5% |
| 30 to 34 Minutes | 348 | 25.6% |
| 35 to 39 Minutes | 59 | 4.3% |
| 40 to 44 Minutes | 134 | 9.9% |
| 45 to 59 Minutes | 287 | 21.1% |
| 60 to 89 Minutes | 122 | 9.0% |
| 90 or more Minutes | 75 | 5.5% |
Commute Time by Sex in Agua Dulce
The most common commute times in Agua Dulce are 45 to 59 minutes (189 commuters, 24.2%) for males and 30 to 34 minutes (195 commuters, 33.7%) for females.
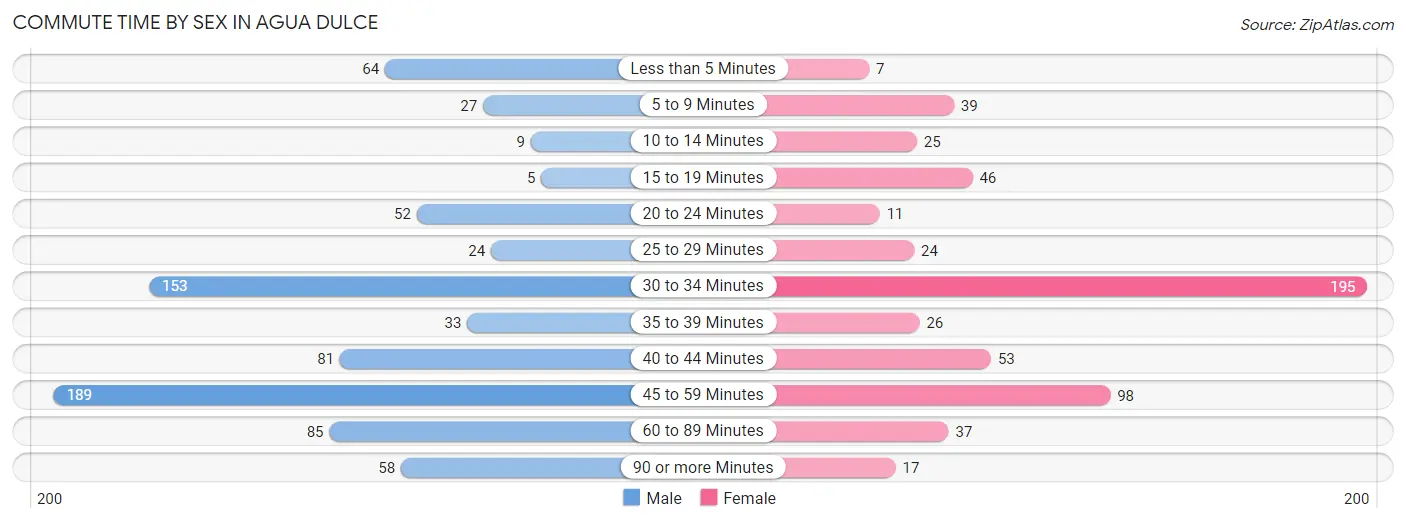
| Commute Time | Male | Female |
| Less than 5 Minutes | 64 (8.2%) | 7 (1.2%) |
| 5 to 9 Minutes | 27 (3.5%) | 39 (6.8%) |
| 10 to 14 Minutes | 9 (1.1%) | 25 (4.3%) |
| 15 to 19 Minutes | 5 (0.6%) | 46 (8.0%) |
| 20 to 24 Minutes | 52 (6.7%) | 11 (1.9%) |
| 25 to 29 Minutes | 24 (3.1%) | 24 (4.2%) |
| 30 to 34 Minutes | 153 (19.6%) | 195 (33.7%) |
| 35 to 39 Minutes | 33 (4.2%) | 26 (4.5%) |
| 40 to 44 Minutes | 81 (10.4%) | 53 (9.2%) |
| 45 to 59 Minutes | 189 (24.2%) | 98 (17.0%) |
| 60 to 89 Minutes | 85 (10.9%) | 37 (6.4%) |
| 90 or more Minutes | 58 (7.4%) | 17 (2.9%) |
Time of Departure to Work by Sex in Agua Dulce
The most frequent times of departure to work in Agua Dulce are 8:00 AM to 8:29 AM (197, 25.3%) for males and 4:00 PM to 11:59 PM (88, 15.2%) for females.
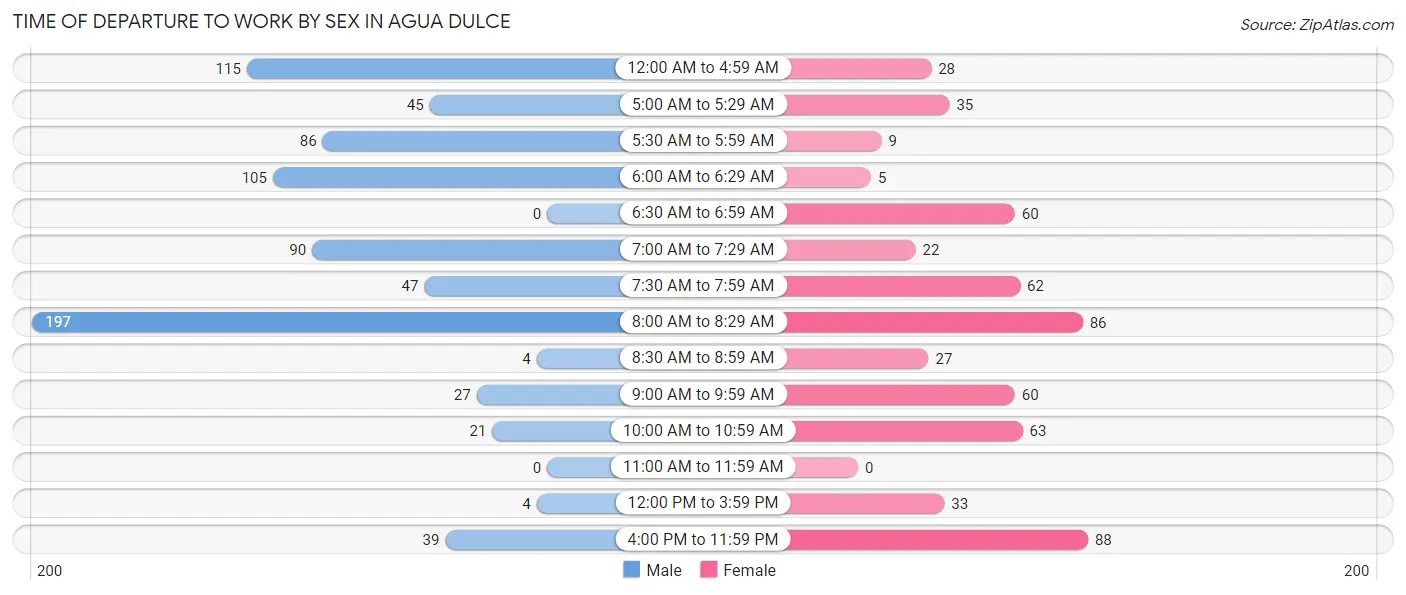
| Time of Departure | Male | Female |
| 12:00 AM to 4:59 AM | 115 (14.7%) | 28 (4.8%) |
| 5:00 AM to 5:29 AM | 45 (5.8%) | 35 (6.1%) |
| 5:30 AM to 5:59 AM | 86 (11.0%) | 9 (1.6%) |
| 6:00 AM to 6:29 AM | 105 (13.5%) | 5 (0.9%) |
| 6:30 AM to 6:59 AM | 0 (0.0%) | 60 (10.4%) |
| 7:00 AM to 7:29 AM | 90 (11.5%) | 22 (3.8%) |
| 7:30 AM to 7:59 AM | 47 (6.0%) | 62 (10.7%) |
| 8:00 AM to 8:29 AM | 197 (25.3%) | 86 (14.9%) |
| 8:30 AM to 8:59 AM | 4 (0.5%) | 27 (4.7%) |
| 9:00 AM to 9:59 AM | 27 (3.5%) | 60 (10.4%) |
| 10:00 AM to 10:59 AM | 21 (2.7%) | 63 (10.9%) |
| 11:00 AM to 11:59 AM | 0 (0.0%) | 0 (0.0%) |
| 12:00 PM to 3:59 PM | 4 (0.5%) | 33 (5.7%) |
| 4:00 PM to 11:59 PM | 39 (5.0%) | 88 (15.2%) |
| Total | 780 (100.0%) | 578 (100.0%) |
Housing Occupancy in Agua Dulce
Occupancy by Ownership in Agua Dulce
Of the total 1,143 dwellings in Agua Dulce, owner-occupied units account for 1,019 (89.1%), while renter-occupied units make up 124 (10.8%).
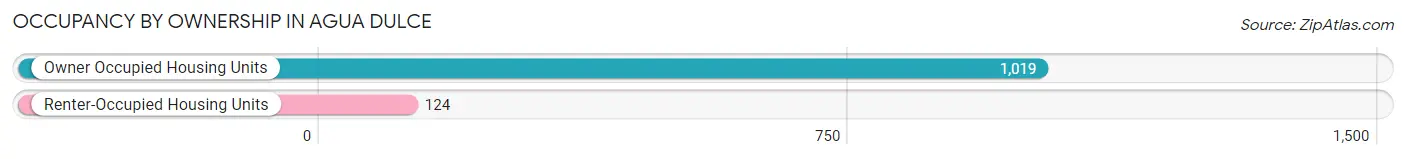
| Occupancy | # Housing Units | % Housing Units |
| Owner Occupied Housing Units | 1,019 | 89.1% |
| Renter-Occupied Housing Units | 124 | 10.8% |
| Total Occupied Housing Units | 1,143 | 100.0% |
Occupancy by Household Size in Agua Dulce
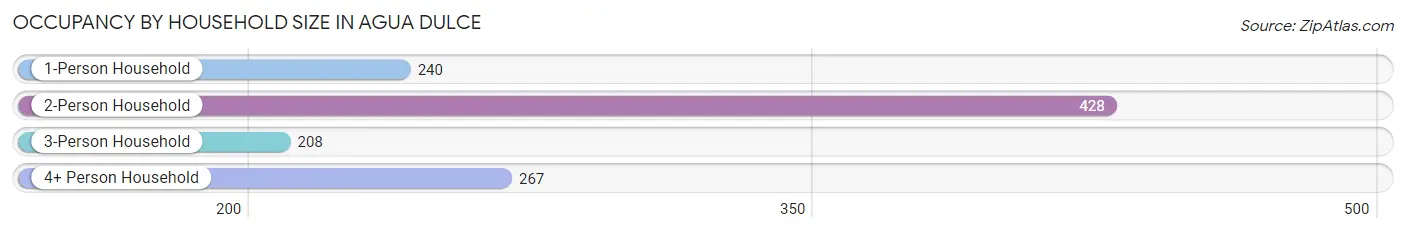
| Household Size | # Housing Units | % Housing Units |
| 1-Person Household | 240 | 21.0% |
| 2-Person Household | 428 | 37.4% |
| 3-Person Household | 208 | 18.2% |
| 4+ Person Household | 267 | 23.4% |
| Total Housing Units | 1,143 | 100.0% |
Occupancy by Ownership by Household Size in Agua Dulce
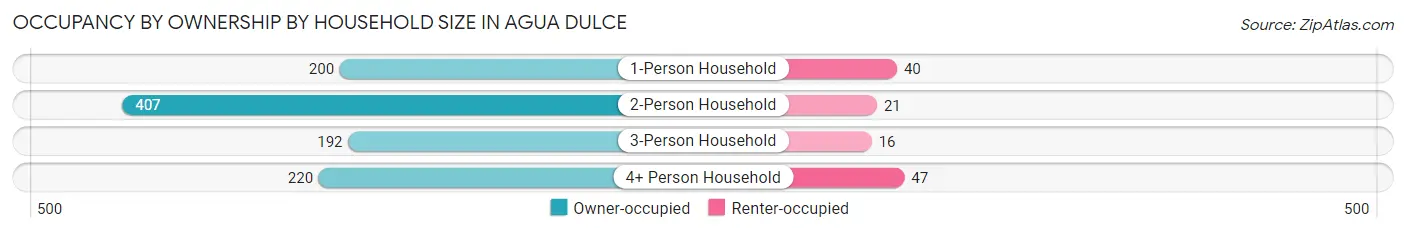
| Household Size | Owner-occupied | Renter-occupied |
| 1-Person Household | 200 (83.3%) | 40 (16.7%) |
| 2-Person Household | 407 (95.1%) | 21 (4.9%) |
| 3-Person Household | 192 (92.3%) | 16 (7.7%) |
| 4+ Person Household | 220 (82.4%) | 47 (17.6%) |
| Total Housing Units | 1,019 (89.1%) | 124 (10.8%) |
Occupancy by Educational Attainment in Agua Dulce
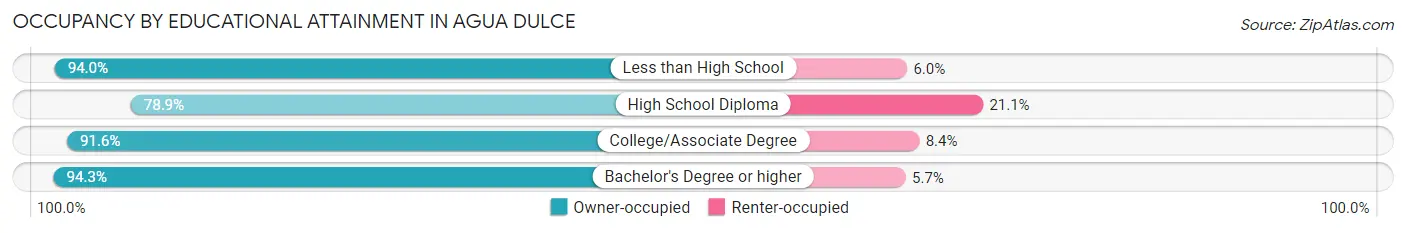
| Household Size | Owner-occupied | Renter-occupied |
| Less than High School | 141 (94.0%) | 9 (6.0%) |
| High School Diploma | 236 (78.9%) | 63 (21.1%) |
| College/Associate Degree | 412 (91.6%) | 38 (8.4%) |
| Bachelor's Degree or higher | 230 (94.3%) | 14 (5.7%) |
Occupancy by Age of Householder in Agua Dulce
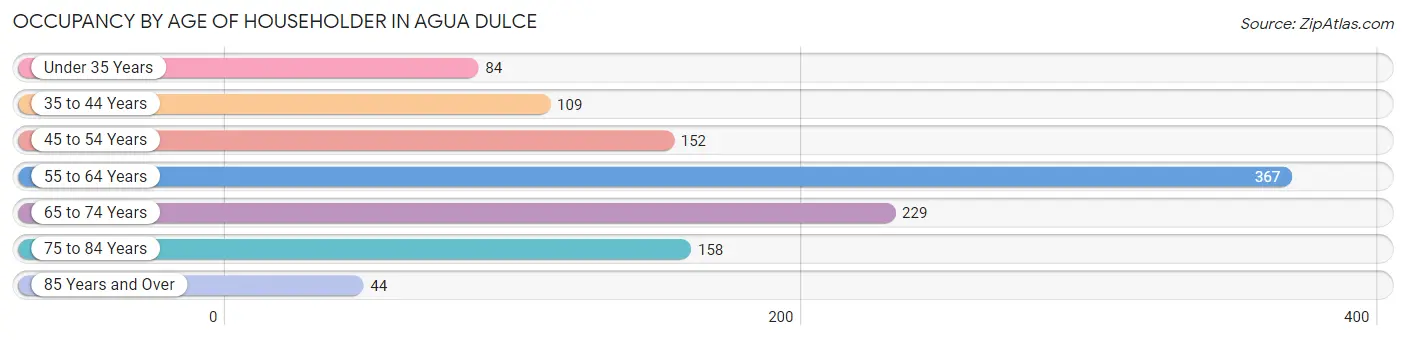
| Age Bracket | # Households | % Households |
| Under 35 Years | 84 | 7.3% |
| 35 to 44 Years | 109 | 9.5% |
| 45 to 54 Years | 152 | 13.3% |
| 55 to 64 Years | 367 | 32.1% |
| 65 to 74 Years | 229 | 20.0% |
| 75 to 84 Years | 158 | 13.8% |
| 85 Years and Over | 44 | 3.8% |
| Total | 1,143 | 100.0% |
Housing Finances in Agua Dulce
Median Income by Occupancy in Agua Dulce
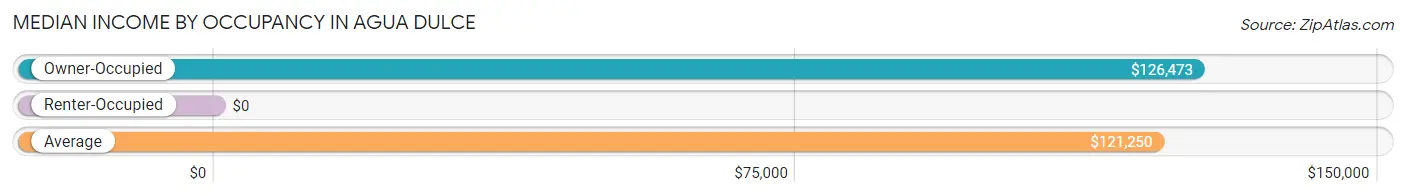
| Occupancy Type | # Households | Median Income |
| Owner-Occupied | 1,019 (89.1%) | $126,473 |
| Renter-Occupied | 124 (10.8%) | $0 |
| Average | 1,143 (100.0%) | $121,250 |
Occupancy by Householder Income Bracket in Agua Dulce
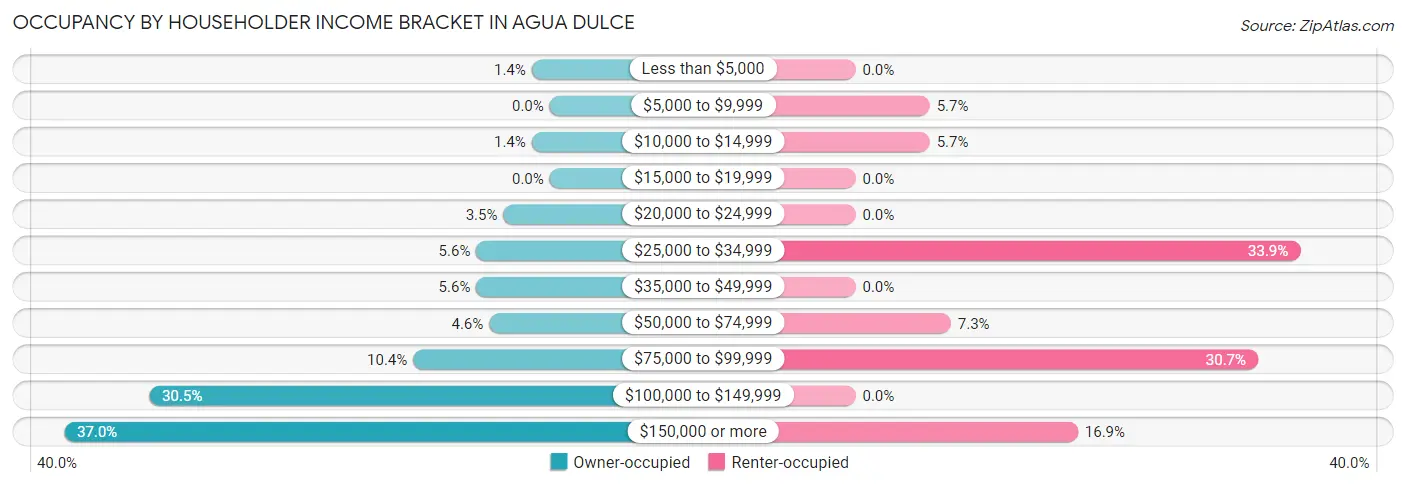
| Income Bracket | Owner-occupied | Renter-occupied |
| Less than $5,000 | 14 (1.4%) | 0 (0.0%) |
| $5,000 to $9,999 | 0 (0.0%) | 7 (5.7%) |
| $10,000 to $14,999 | 14 (1.4%) | 7 (5.7%) |
| $15,000 to $19,999 | 0 (0.0%) | 0 (0.0%) |
| $20,000 to $24,999 | 36 (3.5%) | 0 (0.0%) |
| $25,000 to $34,999 | 57 (5.6%) | 42 (33.9%) |
| $35,000 to $49,999 | 57 (5.6%) | 0 (0.0%) |
| $50,000 to $74,999 | 47 (4.6%) | 9 (7.3%) |
| $75,000 to $99,999 | 106 (10.4%) | 38 (30.6%) |
| $100,000 to $149,999 | 311 (30.5%) | 0 (0.0%) |
| $150,000 or more | 377 (37.0%) | 21 (16.9%) |
| Total | 1,019 (100.0%) | 124 (100.0%) |
Monthly Housing Cost Tiers in Agua Dulce
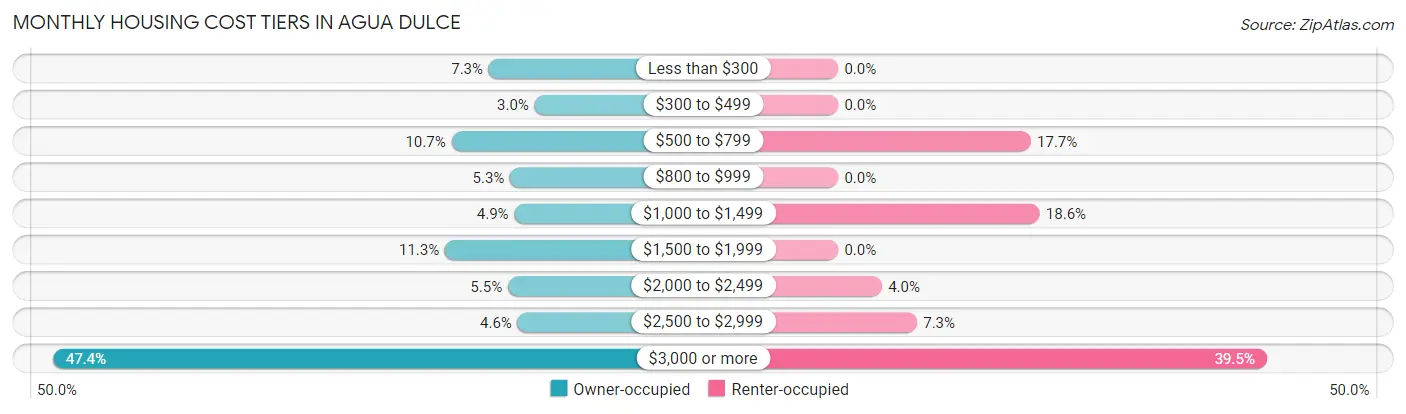
| Monthly Cost | Owner-occupied | Renter-occupied |
| Less than $300 | 74 (7.3%) | 0 (0.0%) |
| $300 to $499 | 31 (3.0%) | 0 (0.0%) |
| $500 to $799 | 109 (10.7%) | 22 (17.7%) |
| $800 to $999 | 54 (5.3%) | 0 (0.0%) |
| $1,000 to $1,499 | 50 (4.9%) | 23 (18.5%) |
| $1,500 to $1,999 | 115 (11.3%) | 0 (0.0%) |
| $2,000 to $2,499 | 56 (5.5%) | 5 (4.0%) |
| $2,500 to $2,999 | 47 (4.6%) | 9 (7.3%) |
| $3,000 or more | 483 (47.4%) | 49 (39.5%) |
| Total | 1,019 (100.0%) | 124 (100.0%) |
Physical Housing Characteristics in Agua Dulce
Housing Structures in Agua Dulce
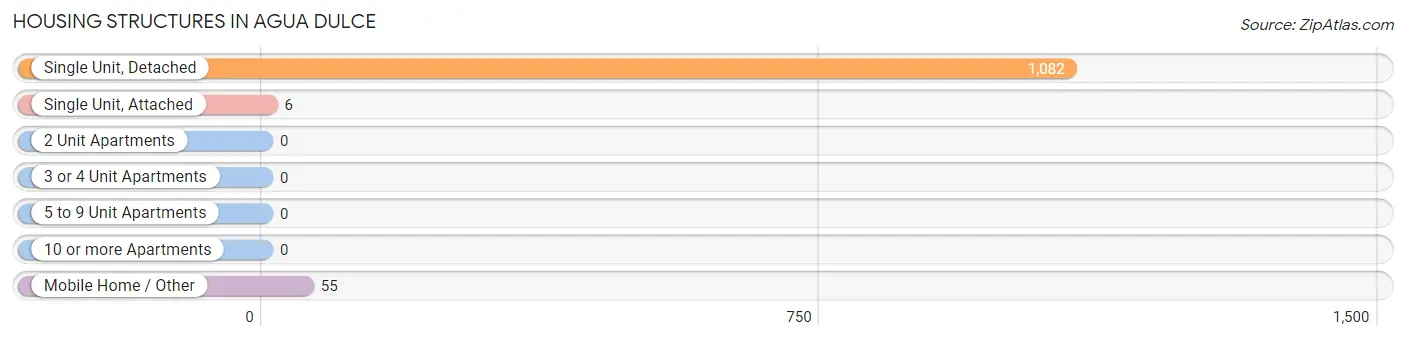
| Structure Type | # Housing Units | % Housing Units |
| Single Unit, Detached | 1,082 | 94.7% |
| Single Unit, Attached | 6 | 0.5% |
| 2 Unit Apartments | 0 | 0.0% |
| 3 or 4 Unit Apartments | 0 | 0.0% |
| 5 to 9 Unit Apartments | 0 | 0.0% |
| 10 or more Apartments | 0 | 0.0% |
| Mobile Home / Other | 55 | 4.8% |
| Total | 1,143 | 100.0% |
Housing Structures by Occupancy in Agua Dulce
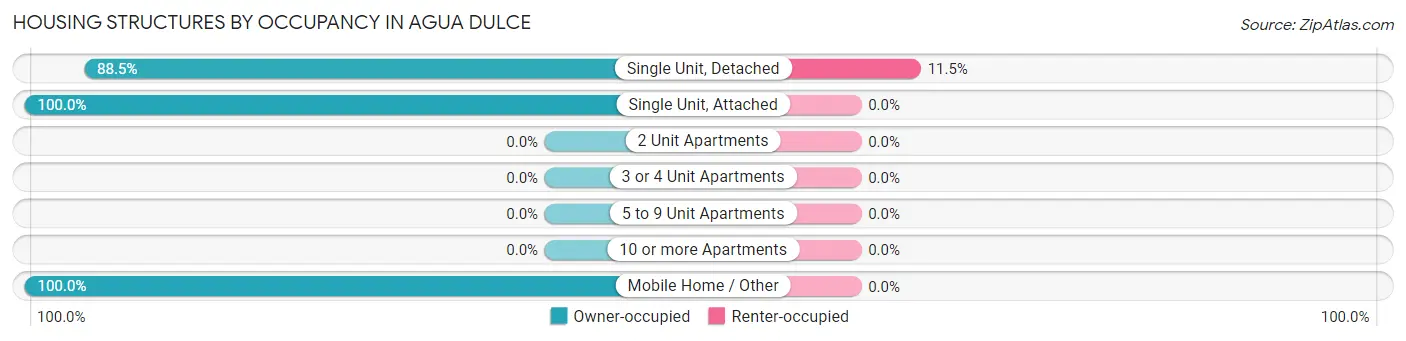
| Structure Type | Owner-occupied | Renter-occupied |
| Single Unit, Detached | 958 (88.5%) | 124 (11.5%) |
| Single Unit, Attached | 6 (100.0%) | 0 (0.0%) |
| 2 Unit Apartments | 0 (0.0%) | 0 (0.0%) |
| 3 or 4 Unit Apartments | 0 (0.0%) | 0 (0.0%) |
| 5 to 9 Unit Apartments | 0 (0.0%) | 0 (0.0%) |
| 10 or more Apartments | 0 (0.0%) | 0 (0.0%) |
| Mobile Home / Other | 55 (100.0%) | 0 (0.0%) |
| Total | 1,019 (89.1%) | 124 (10.8%) |
Housing Structures by Number of Rooms in Agua Dulce
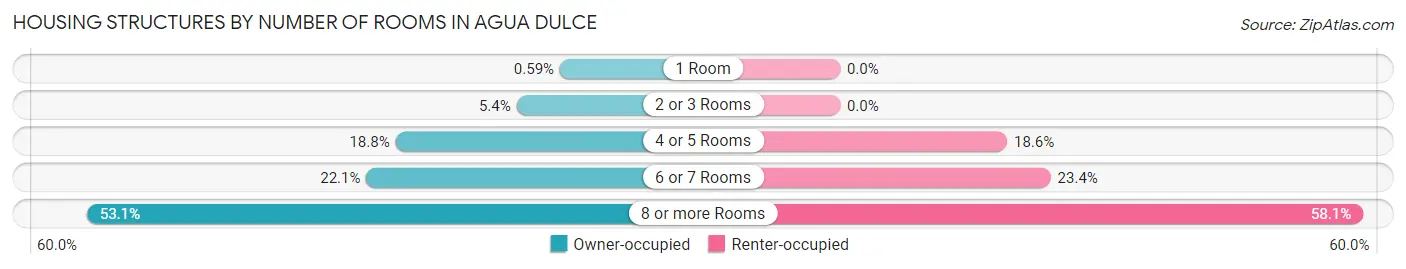
| Number of Rooms | Owner-occupied | Renter-occupied |
| 1 Room | 6 (0.6%) | 0 (0.0%) |
| 2 or 3 Rooms | 55 (5.4%) | 0 (0.0%) |
| 4 or 5 Rooms | 192 (18.8%) | 23 (18.5%) |
| 6 or 7 Rooms | 225 (22.1%) | 29 (23.4%) |
| 8 or more Rooms | 541 (53.1%) | 72 (58.1%) |
| Total | 1,019 (100.0%) | 124 (100.0%) |
Housing Structure by Heating Type in Agua Dulce
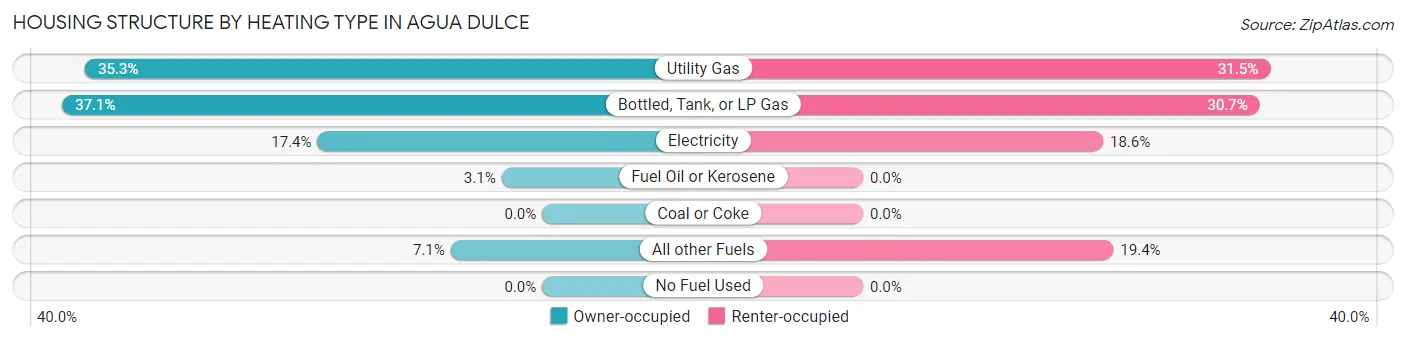
| Heating Type | Owner-occupied | Renter-occupied |
| Utility Gas | 360 (35.3%) | 39 (31.5%) |
| Bottled, Tank, or LP Gas | 378 (37.1%) | 38 (30.6%) |
| Electricity | 177 (17.4%) | 23 (18.5%) |
| Fuel Oil or Kerosene | 32 (3.1%) | 0 (0.0%) |
| Coal or Coke | 0 (0.0%) | 0 (0.0%) |
| All other Fuels | 72 (7.1%) | 24 (19.4%) |
| No Fuel Used | 0 (0.0%) | 0 (0.0%) |
| Total | 1,019 (100.0%) | 124 (100.0%) |
Household Vehicle Usage in Agua Dulce
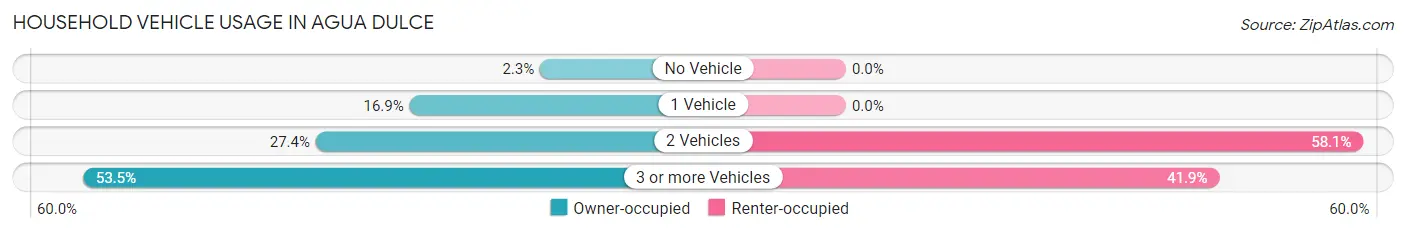
| Vehicles per Household | Owner-occupied | Renter-occupied |
| No Vehicle | 23 (2.3%) | 0 (0.0%) |
| 1 Vehicle | 172 (16.9%) | 0 (0.0%) |
| 2 Vehicles | 279 (27.4%) | 72 (58.1%) |
| 3 or more Vehicles | 545 (53.5%) | 52 (41.9%) |
| Total | 1,019 (100.0%) | 124 (100.0%) |
Real Estate & Mortgages in Agua Dulce
Real Estate and Mortgage Overview in Agua Dulce
| Characteristic | Without Mortgage | With Mortgage |
| Housing Units | 416 | 603 |
| Median Property Value | $761,100 | $917,700 |
| Median Household Income | $112,656 | $259 |
| Monthly Housing Costs | $776 | $460 |
| Real Estate Taxes | $5,696 | $0 |
Property Value by Mortgage Status in Agua Dulce
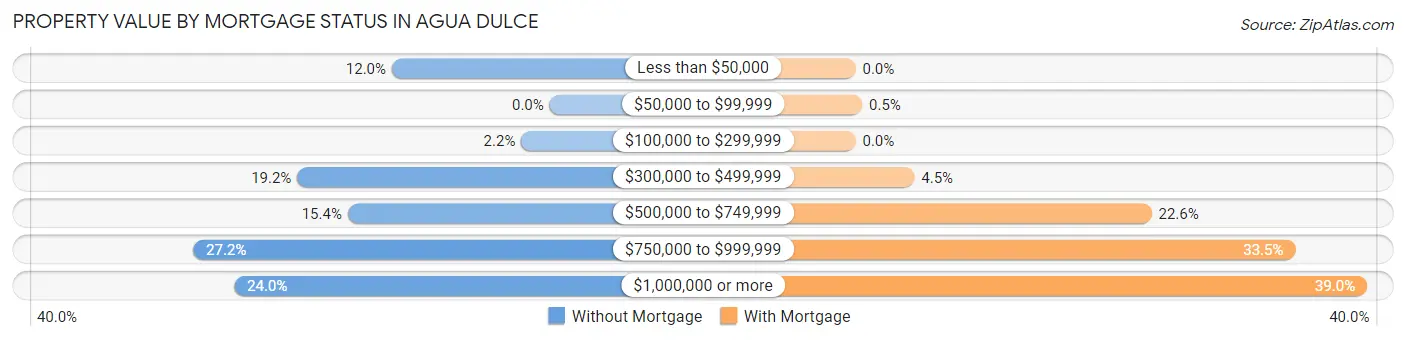
| Property Value | Without Mortgage | With Mortgage |
| Less than $50,000 | 50 (12.0%) | 0 (0.0%) |
| $50,000 to $99,999 | 0 (0.0%) | 3 (0.5%) |
| $100,000 to $299,999 | 9 (2.2%) | 0 (0.0%) |
| $300,000 to $499,999 | 80 (19.2%) | 27 (4.5%) |
| $500,000 to $749,999 | 64 (15.4%) | 136 (22.6%) |
| $750,000 to $999,999 | 113 (27.2%) | 202 (33.5%) |
| $1,000,000 or more | 100 (24.0%) | 235 (39.0%) |
| Total | 416 (100.0%) | 603 (100.0%) |
Household Income by Mortgage Status in Agua Dulce
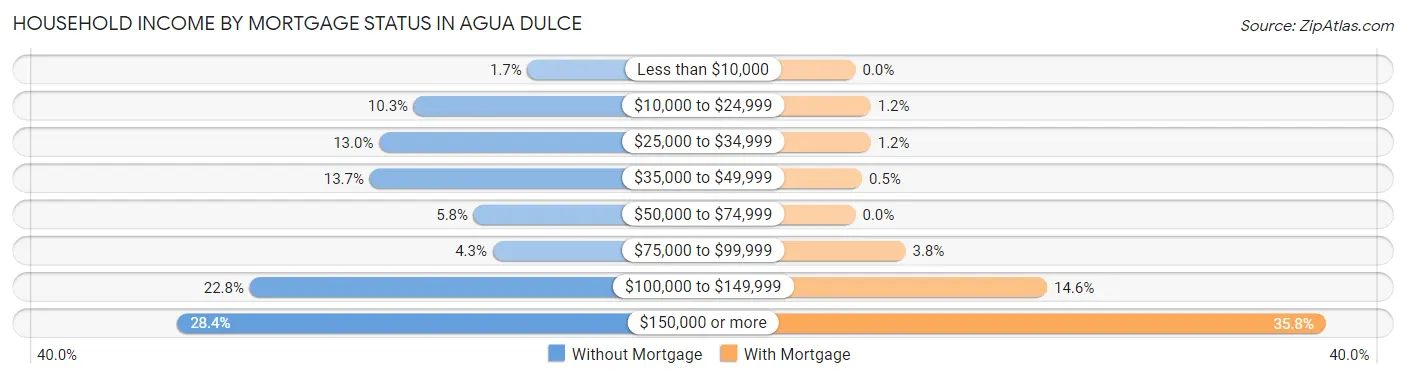
| Household Income | Without Mortgage | With Mortgage |
| Less than $10,000 | 7 (1.7%) | 0 (0.0%) |
| $10,000 to $24,999 | 43 (10.3%) | 7 (1.2%) |
| $25,000 to $34,999 | 54 (13.0%) | 7 (1.2%) |
| $35,000 to $49,999 | 57 (13.7%) | 3 (0.5%) |
| $50,000 to $74,999 | 24 (5.8%) | 0 (0.0%) |
| $75,000 to $99,999 | 18 (4.3%) | 23 (3.8%) |
| $100,000 to $149,999 | 95 (22.8%) | 88 (14.6%) |
| $150,000 or more | 118 (28.4%) | 216 (35.8%) |
| Total | 416 (100.0%) | 603 (100.0%) |
Property Value to Household Income Ratio in Agua Dulce
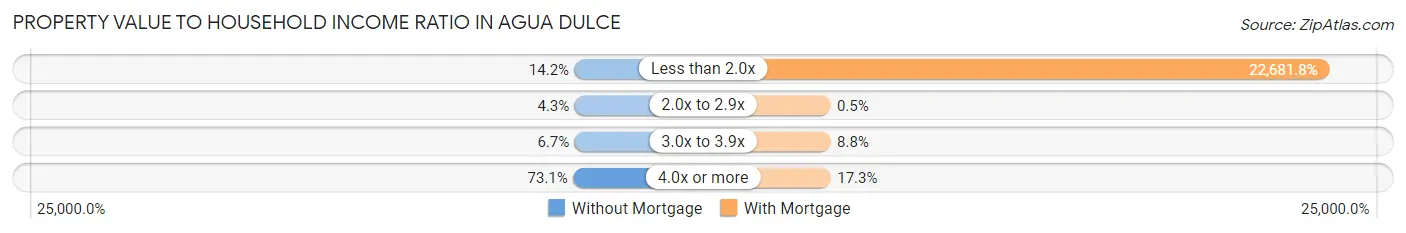
| Value-to-Income Ratio | Without Mortgage | With Mortgage |
| Less than 2.0x | 59 (14.2%) | 136,771 (22,681.8%) |
| 2.0x to 2.9x | 18 (4.3%) | 3 (0.5%) |
| 3.0x to 3.9x | 28 (6.7%) | 53 (8.8%) |
| 4.0x or more | 304 (73.1%) | 104 (17.2%) |
| Total | 416 (100.0%) | 603 (100.0%) |
Real Estate Taxes by Mortgage Status in Agua Dulce
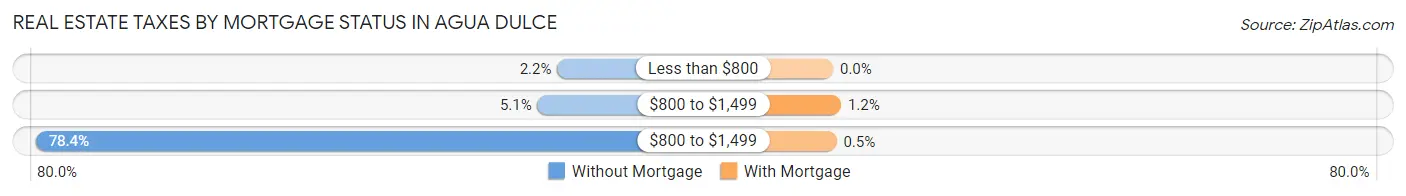
| Property Taxes | Without Mortgage | With Mortgage |
| Less than $800 | 9 (2.2%) | 0 (0.0%) |
| $800 to $1,499 | 21 (5.1%) | 7 (1.2%) |
| $800 to $1,499 | 326 (78.4%) | 3 (0.5%) |
| Total | 416 (100.0%) | 603 (100.0%) |
Health & Disability in Agua Dulce
Health Insurance Coverage by Age in Agua Dulce
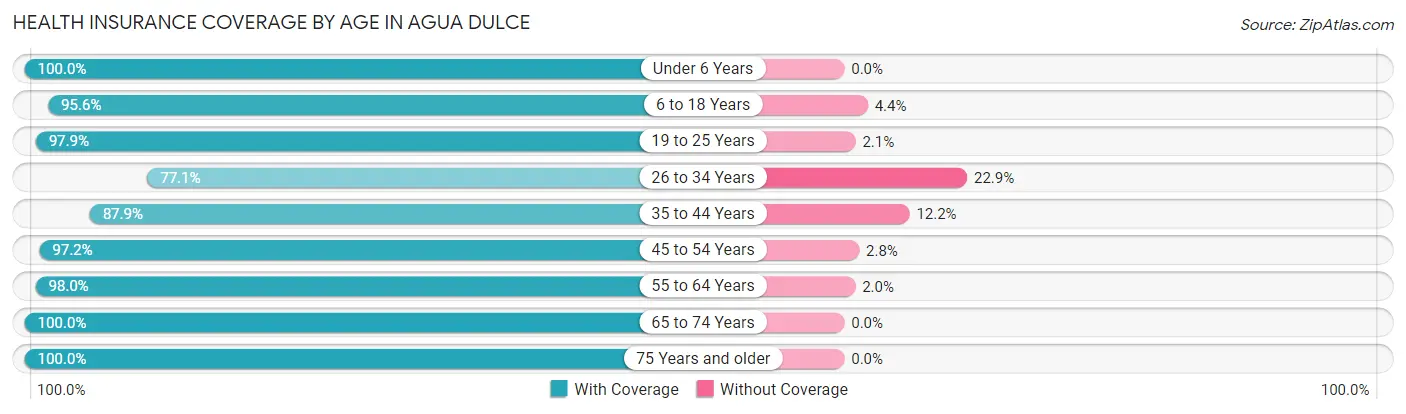
| Age Bracket | With Coverage | Without Coverage |
| Under 6 Years | 131 (100.0%) | 0 (0.0%) |
| 6 to 18 Years | 350 (95.6%) | 16 (4.4%) |
| 19 to 25 Years | 141 (97.9%) | 3 (2.1%) |
| 26 to 34 Years | 256 (77.1%) | 76 (22.9%) |
| 35 to 44 Years | 282 (87.8%) | 39 (12.1%) |
| 45 to 54 Years | 317 (97.2%) | 9 (2.8%) |
| 55 to 64 Years | 774 (98.0%) | 16 (2.0%) |
| 65 to 74 Years | 389 (100.0%) | 0 (0.0%) |
| 75 Years and older | 336 (100.0%) | 0 (0.0%) |
| Total | 2,976 (94.9%) | 159 (5.1%) |
Health Insurance Coverage by Citizenship Status in Agua Dulce
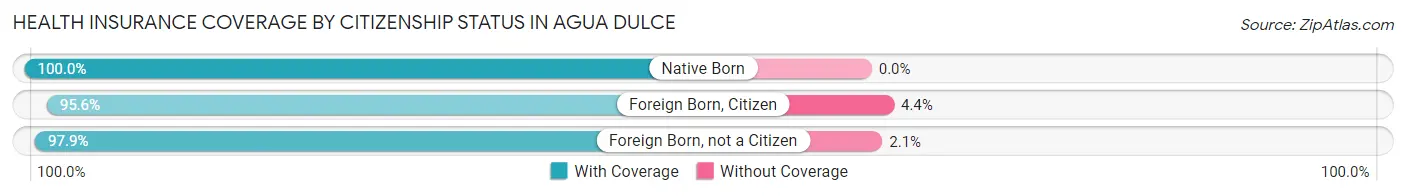
| Citizenship Status | With Coverage | Without Coverage |
| Native Born | 131 (100.0%) | 0 (0.0%) |
| Foreign Born, Citizen | 350 (95.6%) | 16 (4.4%) |
| Foreign Born, not a Citizen | 141 (97.9%) | 3 (2.1%) |
Health Insurance Coverage by Household Income in Agua Dulce
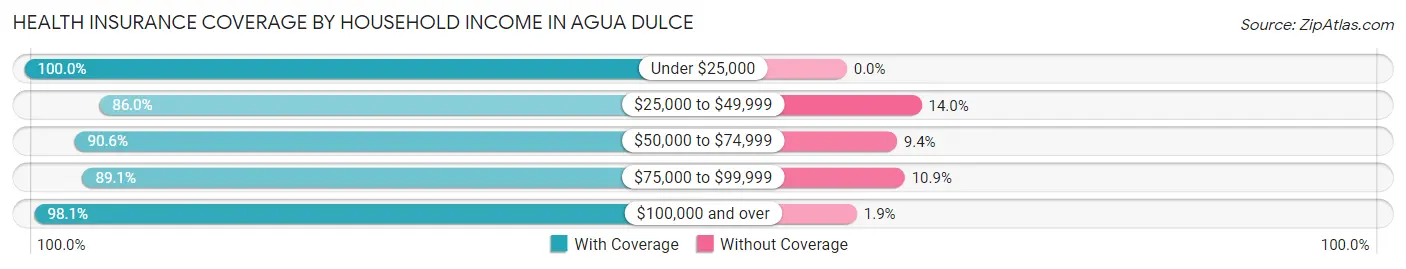
| Household Income | With Coverage | Without Coverage |
| Under $25,000 | 91 (100.0%) | 0 (0.0%) |
| $25,000 to $49,999 | 344 (86.0%) | 56 (14.0%) |
| $50,000 to $74,999 | 87 (90.6%) | 9 (9.4%) |
| $75,000 to $99,999 | 427 (89.1%) | 52 (10.9%) |
| $100,000 and over | 2,025 (98.1%) | 39 (1.9%) |
Public vs Private Health Insurance Coverage by Age in Agua Dulce
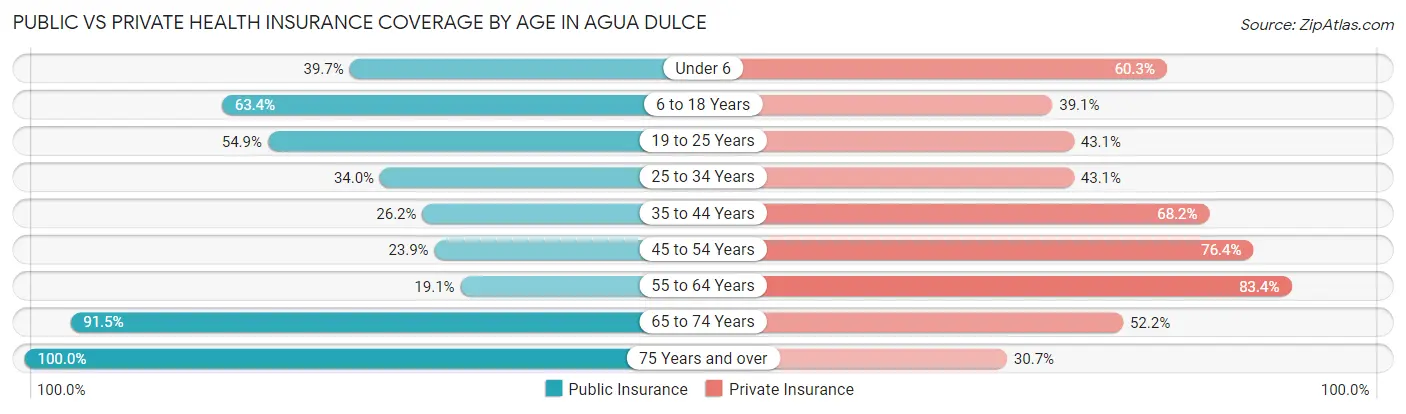
| Age Bracket | Public Insurance | Private Insurance |
| Under 6 | 52 (39.7%) | 79 (60.3%) |
| 6 to 18 Years | 232 (63.4%) | 143 (39.1%) |
| 19 to 25 Years | 79 (54.9%) | 62 (43.1%) |
| 25 to 34 Years | 113 (34.0%) | 143 (43.1%) |
| 35 to 44 Years | 84 (26.2%) | 219 (68.2%) |
| 45 to 54 Years | 78 (23.9%) | 249 (76.4%) |
| 55 to 64 Years | 151 (19.1%) | 659 (83.4%) |
| 65 to 74 Years | 356 (91.5%) | 203 (52.2%) |
| 75 Years and over | 336 (100.0%) | 103 (30.6%) |
| Total | 1,481 (47.2%) | 1,860 (59.3%) |
Disability Status by Sex by Age in Agua Dulce
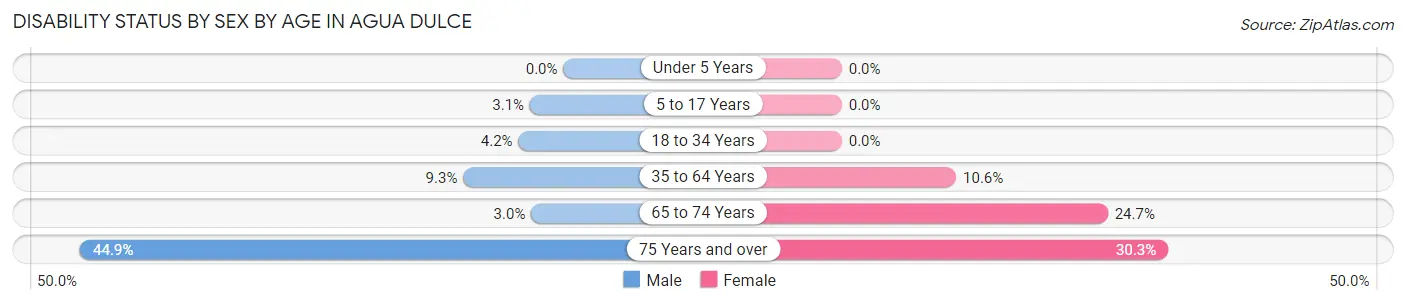
| Age Bracket | Male | Female |
| Under 5 Years | 0 (0.0%) | 0 (0.0%) |
| 5 to 17 Years | 7 (3.1%) | 0 (0.0%) |
| 18 to 34 Years | 10 (4.2%) | 0 (0.0%) |
| 35 to 64 Years | 67 (9.3%) | 76 (10.6%) |
| 65 to 74 Years | 7 (3.0%) | 38 (24.7%) |
| 75 Years and over | 87 (44.9%) | 43 (30.3%) |
Disability Class by Sex by Age in Agua Dulce
Disability Class: Hearing Difficulty
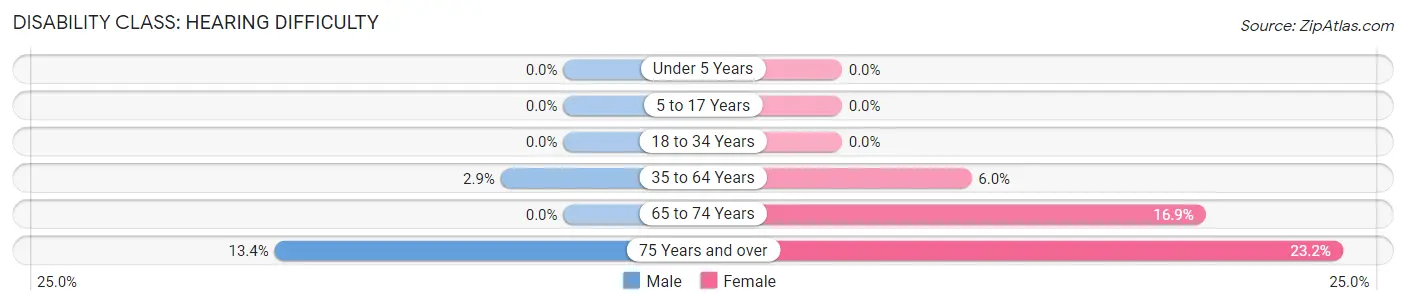
| Age Bracket | Male | Female |
| Under 5 Years | 0 (0.0%) | 0 (0.0%) |
| 5 to 17 Years | 0 (0.0%) | 0 (0.0%) |
| 18 to 34 Years | 0 (0.0%) | 0 (0.0%) |
| 35 to 64 Years | 21 (2.9%) | 43 (6.0%) |
| 65 to 74 Years | 0 (0.0%) | 26 (16.9%) |
| 75 Years and over | 26 (13.4%) | 33 (23.2%) |
Disability Class: Vision Difficulty
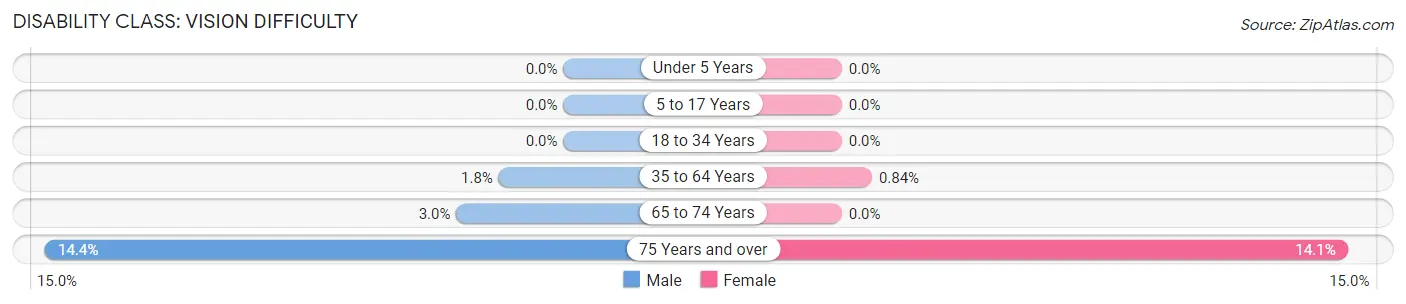
| Age Bracket | Male | Female |
| Under 5 Years | 0 (0.0%) | 0 (0.0%) |
| 5 to 17 Years | 0 (0.0%) | 0 (0.0%) |
| 18 to 34 Years | 0 (0.0%) | 0 (0.0%) |
| 35 to 64 Years | 13 (1.8%) | 6 (0.8%) |
| 65 to 74 Years | 7 (3.0%) | 0 (0.0%) |
| 75 Years and over | 28 (14.4%) | 20 (14.1%) |
Disability Class: Cognitive Difficulty
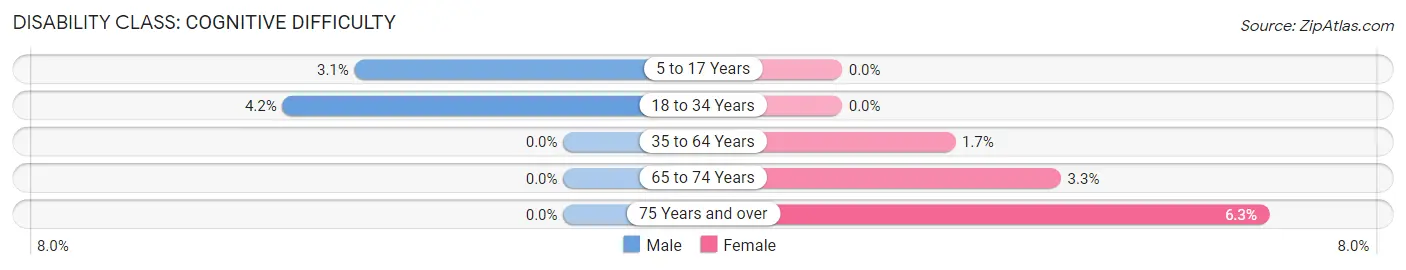
| Age Bracket | Male | Female |
| 5 to 17 Years | 7 (3.1%) | 0 (0.0%) |
| 18 to 34 Years | 10 (4.2%) | 0 (0.0%) |
| 35 to 64 Years | 0 (0.0%) | 12 (1.7%) |
| 65 to 74 Years | 0 (0.0%) | 5 (3.3%) |
| 75 Years and over | 0 (0.0%) | 9 (6.3%) |
Disability Class: Ambulatory Difficulty
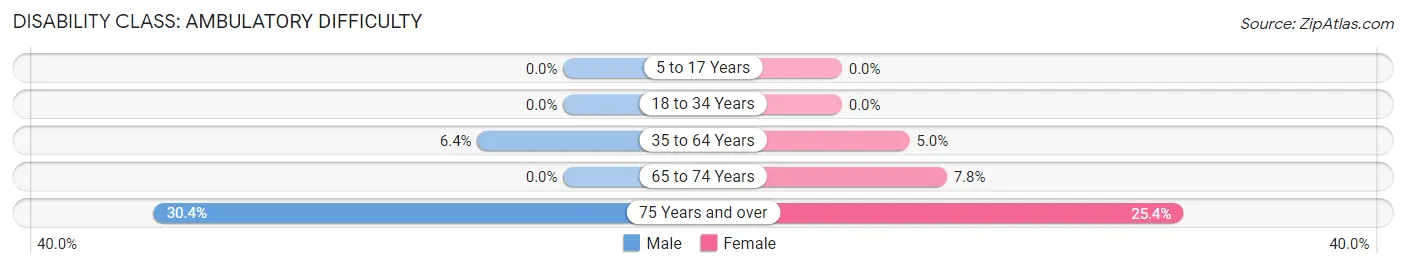
| Age Bracket | Male | Female |
| 5 to 17 Years | 0 (0.0%) | 0 (0.0%) |
| 18 to 34 Years | 0 (0.0%) | 0 (0.0%) |
| 35 to 64 Years | 46 (6.4%) | 36 (5.0%) |
| 65 to 74 Years | 0 (0.0%) | 12 (7.8%) |
| 75 Years and over | 59 (30.4%) | 36 (25.4%) |
Disability Class: Self-Care Difficulty
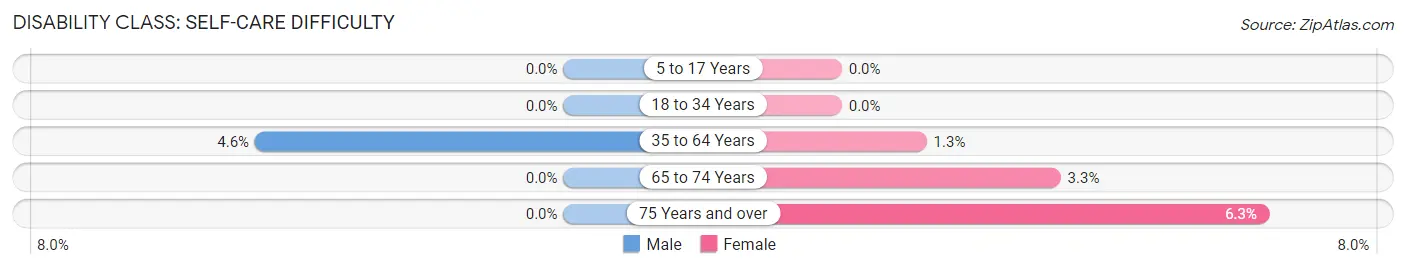
| Age Bracket | Male | Female |
| 5 to 17 Years | 0 (0.0%) | 0 (0.0%) |
| 18 to 34 Years | 0 (0.0%) | 0 (0.0%) |
| 35 to 64 Years | 33 (4.6%) | 9 (1.3%) |
| 65 to 74 Years | 0 (0.0%) | 5 (3.3%) |
| 75 Years and over | 0 (0.0%) | 9 (6.3%) |
Technology Access in Agua Dulce
Computing Device Access in Agua Dulce
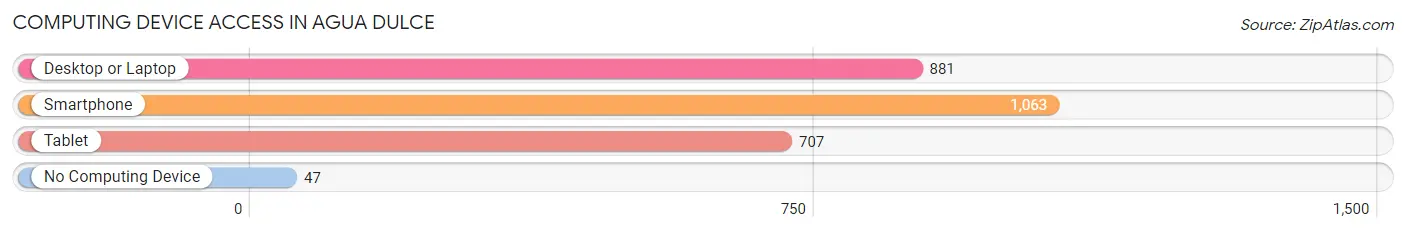
| Device Type | # Households | % Households |
| Desktop or Laptop | 881 | 77.1% |
| Smartphone | 1,063 | 93.0% |
| Tablet | 707 | 61.9% |
| No Computing Device | 47 | 4.1% |
| Total | 1,143 | 100.0% |
Internet Access in Agua Dulce
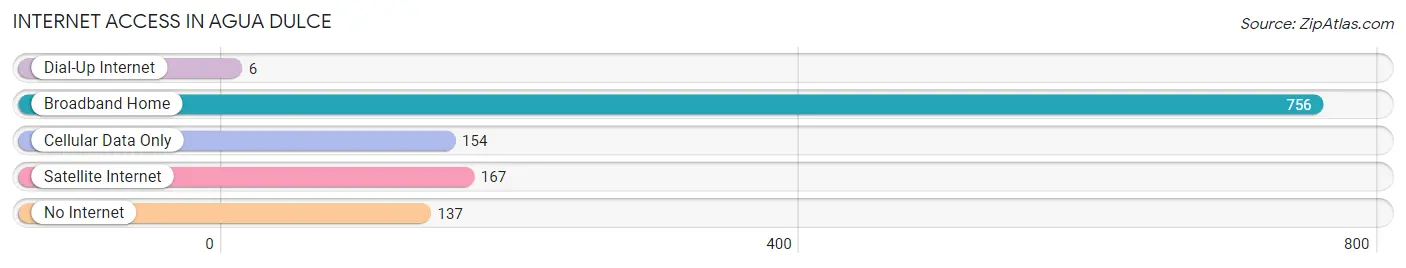
| Internet Type | # Households | % Households |
| Dial-Up Internet | 6 | 0.5% |
| Broadband Home | 756 | 66.1% |
| Cellular Data Only | 154 | 13.5% |
| Satellite Internet | 167 | 14.6% |
| No Internet | 137 | 12.0% |
| Total | 1,143 | 100.0% |
Agua Dulce Summary
Agua Dulce is a census-designated place located in Los Angeles County, California. It is located in the Antelope Valley, approximately 30 miles north of the city of Los Angeles. The population was 8,342 at the 2010 census, up from 7,298 at the 2000 census.
History
The area of Agua Dulce was originally inhabited by the Tataviam people, who were a Native American tribe that lived in the area for thousands of years. The first Europeans to settle in the area were Spanish missionaries in the late 18th century. The area was later settled by ranchers in the 19th century, and the town of Agua Dulce was established in 1876.
The town was named after a nearby freshwater spring, which was used by the local ranchers for their livestock. The town grew slowly over the years, and by the early 20th century, it had become a popular stop for travelers on the Los Angeles-San Francisco highway.
In the 1950s, the area began to experience rapid growth as Los Angeles expanded northward. The population of Agua Dulce increased from 1,000 in 1950 to 8,342 in 2010.
Geography
Agua Dulce is located in the Antelope Valley, approximately 30 miles north of the city of Los Angeles. It is bordered by the San Gabriel Mountains to the south and the Sierra Pelona Mountains to the north. The town is situated at an elevation of 2,500 feet above sea level.
The climate in Agua Dulce is semi-arid, with hot summers and mild winters. The average annual precipitation is 11.5 inches.
Economy
The economy of Agua Dulce is largely based on agriculture and tourism. The town is home to several wineries, and it is a popular destination for wine tasting. The area is also known for its horse ranches, and it is a popular destination for horseback riding.
The town is also home to several small businesses, including restaurants, shops, and services. The town is also home to a small airport, which is used for private and commercial flights.
Demographics
As of the 2010 census, the population of Agua Dulce was 8,342. The racial makeup of the town was 75.3% White, 0.7% African American, 0.9% Native American, 0.7% Asian, 0.1% Pacific Islander, 19.2% from other races, and 3.2% from two or more races. Hispanic or Latino of any race were 33.3% of the population.
The median household income in Agua Dulce was $50,944, and the median family income was $58,958. The per capita income was $22,945. About 11.2% of families and 14.2% of the population were below the poverty line, including 18.2% of those under age 18 and 8.2% of those age 65 or over.
Conclusion
Agua Dulce is a small town located in Los Angeles County, California. It is situated in the Antelope Valley, approximately 30 miles north of the city of Los Angeles. The town has a population of 8,342, and it is known for its wineries, horse ranches, and small businesses. The economy of Agua Dulce is largely based on agriculture and tourism, and the town is a popular destination for wine tasting and horseback riding. The population of Agua Dulce is diverse, with a majority of White, Hispanic, and other races. The median household income in Agua Dulce is $50,944, and the per capita income is $22,945.
Common Questions
What is Per Capita Income in Agua Dulce?
Per Capita income in Agua Dulce is $51,906.
What is the Median Family Income in Agua Dulce?
Median Family Income in Agua Dulce is $128,958.
What is the Median Household income in Agua Dulce?
Median Household Income in Agua Dulce is $121,250.
What is Income or Wage Gap in Agua Dulce?
Income or Wage Gap in Agua Dulce is 63.3%.
Women in Agua Dulce earn 36.7 cents for every dollar earned by a man.
What is Inequality or Gini Index in Agua Dulce?
Inequality or Gini Index in Agua Dulce is 0.38.
What is the Total Population of Agua Dulce?
Total Population of Agua Dulce is 3,161.
What is the Total Male Population of Agua Dulce?
Total Male Population of Agua Dulce is 1,696.
What is the Total Female Population of Agua Dulce?
Total Female Population of Agua Dulce is 1,465.
What is the Ratio of Males per 100 Females in Agua Dulce?
There are 115.77 Males per 100 Females in Agua Dulce.
What is the Ratio of Females per 100 Males in Agua Dulce?
There are 86.38 Females per 100 Males in Agua Dulce.
What is the Median Population Age in Agua Dulce?
Median Population Age in Agua Dulce is 53.4 Years.
What is the Average Family Size in Agua Dulce
Average Family Size in Agua Dulce is 3.1 People.
What is the Average Household Size in Agua Dulce
Average Household Size in Agua Dulce is 2.8 People.
How Large is the Labor Force in Agua Dulce?
There are 1,631 People in the Labor Forcein in Agua Dulce.
What is the Percentage of People in the Labor Force in Agua Dulce?
60.0% of People are in the Labor Force in Agua Dulce.
What is the Unemployment Rate in Agua Dulce?
Unemployment Rate in Agua Dulce is 3.9%.