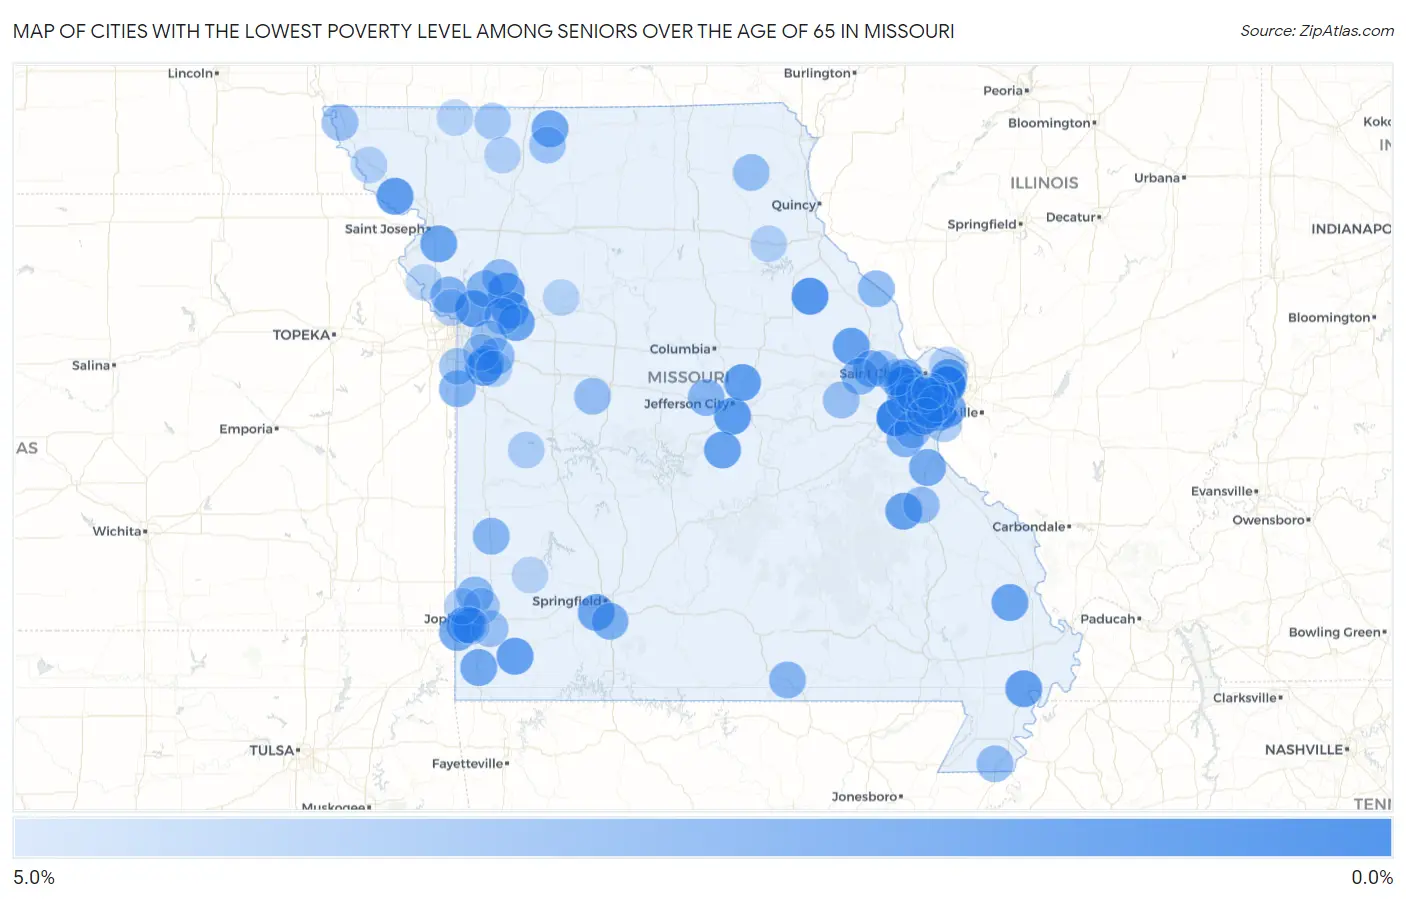
Cities with the Lowest Poverty Level Among Seniors Over the Age of 65 in Missouri
RELATED REPORTS & OPTIONS
Lowest Poverty | Seniors 65+
Missouri
Compare Cities
Map of Cities with the Lowest Poverty Level Among Seniors Over the Age of 65 in Missouri
5.0%
0.0%
Cities with the Lowest Poverty Level Among Seniors Over the Age of 65 in Missouri
| City | Senior Poverty | vs State | vs National | |
| 1. | Pacific | 0.27% | 9.5%(-9.23)#1 | 10.0%(-9.68)#39 |
| 2. | Weldon Spring | 0.81% | 9.5%(-8.69)#2 | 10.0%(-9.14)#182 |
| 3. | Twin Oaks | 0.88% | 9.5%(-8.62)#3 | 10.0%(-9.07)#217 |
| 4. | Huntleigh | 1.0% | 9.5%(-8.47)#4 | 10.0%(-8.92)#301 |
| 5. | Crystal Lake Park | 1.2% | 9.5%(-8.26)#5 | 10.0%(-8.71)#443 |
| 6. | Vandalia | 1.2% | 9.5%(-8.25)#6 | 10.0%(-8.70)#444 |
| 7. | Wardsville | 1.5% | 9.5%(-8.04)#7 | 10.0%(-8.50)#619 |
| 8. | Des Peres | 1.5% | 9.5%(-7.99)#8 | 10.0%(-8.44)#656 |
| 9. | Oregon | 1.6% | 9.5%(-7.94)#9 | 10.0%(-8.39)#693 |
| 10. | Glenaire | 1.6% | 9.5%(-7.91)#10 | 10.0%(-8.36)#713 |
| 11. | New Bloomfield | 1.7% | 9.5%(-7.83)#11 | 10.0%(-8.29)#775 |
| 12. | Dellwood | 1.7% | 9.5%(-7.77)#12 | 10.0%(-8.23)#835 |
| 13. | Fairview | 1.7% | 9.5%(-7.77)#13 | 10.0%(-8.23)#838 |
| 14. | Wood Heights | 1.7% | 9.5%(-7.76)#14 | 10.0%(-8.21)#853 |
| 15. | Shoal Creek Drive | 1.8% | 9.5%(-7.74)#15 | 10.0%(-8.20)#867 |
| 16. | Lake Winnebago | 1.8% | 9.5%(-7.72)#16 | 10.0%(-8.18)#885 |
| 17. | Lilbourn | 1.8% | 9.5%(-7.68)#17 | 10.0%(-8.13)#913 |
| 18. | Hawk Point | 1.8% | 9.5%(-7.68)#18 | 10.0%(-8.13)#918 |
| 19. | Parkdale | 1.8% | 9.5%(-7.66)#19 | 10.0%(-8.12)#933 |
| 20. | Irondale | 1.9% | 9.5%(-7.65)#20 | 10.0%(-8.10)#948 |
| 21. | St Elizabeth | 1.9% | 9.5%(-7.61)#21 | 10.0%(-8.06)#977 |
| 22. | Delta | 1.9% | 9.5%(-7.61)#22 | 10.0%(-8.06)#978 |
| 23. | Orrick | 1.9% | 9.5%(-7.59)#23 | 10.0%(-8.05)#991 |
| 24. | Bella Villa | 1.9% | 9.5%(-7.56)#24 | 10.0%(-8.01)#1,032 |
| 25. | Napoleon | 2.0% | 9.5%(-7.50)#25 | 10.0%(-7.95)#1,098 |
| 26. | Agency | 2.0% | 9.5%(-7.48)#26 | 10.0%(-7.93)#1,108 |
| 27. | Battlefield | 2.0% | 9.5%(-7.47)#27 | 10.0%(-7.92)#1,112 |
| 28. | Pasadena Hills | 2.1% | 9.5%(-7.42)#28 | 10.0%(-7.87)#1,170 |
| 29. | Loma Linda | 2.2% | 9.5%(-7.34)#29 | 10.0%(-7.79)#1,232 |
| 30. | Cainsville | 2.2% | 9.5%(-7.32)#30 | 10.0%(-7.78)#1,248 |
| 31. | Cottleville | 2.2% | 9.5%(-7.32)#31 | 10.0%(-7.77)#1,254 |
| 32. | Goodman | 2.2% | 9.5%(-7.30)#32 | 10.0%(-7.75)#1,274 |
| 33. | Olympian Village | 2.3% | 9.5%(-7.17)#33 | 10.0%(-7.63)#1,400 |
| 34. | Grantwood Village | 2.4% | 9.5%(-7.13)#34 | 10.0%(-7.58)#1,454 |
| 35. | Foristell | 2.4% | 9.5%(-7.12)#35 | 10.0%(-7.57)#1,461 |
| 36. | Indian Lake | 2.5% | 9.5%(-7.02)#36 | 10.0%(-7.47)#1,573 |
| 37. | Fremont Hills | 2.5% | 9.5%(-6.96)#37 | 10.0%(-7.42)#1,635 |
| 38. | Concord | 2.6% | 9.5%(-6.92)#38 | 10.0%(-7.37)#1,685 |
| 39. | Ballwin | 2.7% | 9.5%(-6.81)#39 | 10.0%(-7.26)#1,819 |
| 40. | Weldon Spring Heights | 2.7% | 9.5%(-6.80)#40 | 10.0%(-7.25)#1,836 |
| 41. | Ferrelview | 2.7% | 9.5%(-6.76)#41 | 10.0%(-7.21)#1,866 |
| 42. | Cleveland | 2.8% | 9.5%(-6.73)#42 | 10.0%(-7.19)#1,890 |
| 43. | Cedar Hill Lakes | 2.8% | 9.5%(-6.72)#43 | 10.0%(-7.17)#1,913 |
| 44. | Kearney | 2.8% | 9.5%(-6.70)#44 | 10.0%(-7.15)#1,932 |
| 45. | Brentwood | 2.9% | 9.5%(-6.64)#45 | 10.0%(-7.10)#1,987 |
| 46. | Centertown | 2.9% | 9.5%(-6.64)#46 | 10.0%(-7.09)#2,001 |
| 47. | Brandsville | 2.9% | 9.5%(-6.64)#47 | 10.0%(-7.09)#2,011 |
| 48. | Norwood Court | 2.9% | 9.5%(-6.61)#48 | 10.0%(-7.07)#2,042 |
| 49. | Sheldon | 2.9% | 9.5%(-6.60)#49 | 10.0%(-7.05)#2,057 |
| 50. | Innsbrook | 2.9% | 9.5%(-6.59)#50 | 10.0%(-7.04)#2,070 |
| 51. | Lake Lotawana | 3.0% | 9.5%(-6.51)#51 | 10.0%(-6.96)#2,169 |
| 52. | Clarksville | 3.0% | 9.5%(-6.47)#52 | 10.0%(-6.92)#2,211 |
| 53. | Purcell | 3.0% | 9.5%(-6.47)#53 | 10.0%(-6.92)#2,212 |
| 54. | Northwoods | 3.1% | 9.5%(-6.42)#54 | 10.0%(-6.88)#2,258 |
| 55. | Ladue | 3.1% | 9.5%(-6.38)#55 | 10.0%(-6.84)#2,320 |
| 56. | Scotsdale | 3.1% | 9.5%(-6.37)#56 | 10.0%(-6.83)#2,346 |
| 57. | Clarkson Valley | 3.2% | 9.5%(-6.29)#57 | 10.0%(-6.74)#2,445 |
| 58. | Lawson | 3.2% | 9.5%(-6.27)#58 | 10.0%(-6.73)#2,460 |
| 59. | Holland | 3.2% | 9.5%(-6.27)#59 | 10.0%(-6.73)#2,481 |
| 60. | Green Ridge | 3.3% | 9.5%(-6.22)#60 | 10.0%(-6.67)#2,541 |
| 61. | Desloge | 3.3% | 9.5%(-6.20)#61 | 10.0%(-6.65)#2,574 |
| 62. | Knox City | 3.3% | 9.5%(-6.17)#62 | 10.0%(-6.62)#2,642 |
| 63. | Wildwood | 3.3% | 9.5%(-6.16)#63 | 10.0%(-6.62)#2,646 |
| 64. | New Haven | 3.4% | 9.5%(-6.10)#64 | 10.0%(-6.55)#2,722 |
| 65. | Diamond | 3.4% | 9.5%(-6.08)#65 | 10.0%(-6.53)#2,742 |
| 66. | Rock Hill | 3.4% | 9.5%(-6.07)#66 | 10.0%(-6.52)#2,755 |
| 67. | Sibley | 3.4% | 9.5%(-6.05)#67 | 10.0%(-6.50)#2,791 |
| 68. | Watson | 3.4% | 9.5%(-6.05)#68 | 10.0%(-6.50)#2,801 |
| 69. | Loch Lloyd | 3.5% | 9.5%(-6.00)#69 | 10.0%(-6.45)#2,853 |
| 70. | Brooklyn Heights | 3.6% | 9.5%(-5.93)#70 | 10.0%(-6.38)#2,964 |
| 71. | Mount Moriah | 3.6% | 9.5%(-5.93)#71 | 10.0%(-6.38)#2,965 |
| 72. | Valley Park | 3.6% | 9.5%(-5.91)#72 | 10.0%(-6.36)#2,997 |
| 73. | Lake Tapawingo | 3.6% | 9.5%(-5.89)#73 | 10.0%(-6.34)#3,023 |
| 74. | Saginaw | 3.6% | 9.5%(-5.86)#74 | 10.0%(-6.32)#3,058 |
| 75. | Frontenac | 3.6% | 9.5%(-5.85)#75 | 10.0%(-6.30)#3,066 |
| 76. | Oakville | 3.7% | 9.5%(-5.79)#76 | 10.0%(-6.25)#3,165 |
| 77. | Fenton | 3.7% | 9.5%(-5.76)#77 | 10.0%(-6.21)#3,192 |
| 78. | Greenwood | 3.8% | 9.5%(-5.73)#78 | 10.0%(-6.18)#3,227 |
| 79. | Chesterfield | 3.8% | 9.5%(-5.70)#79 | 10.0%(-6.15)#3,257 |
| 80. | Allendale | 3.8% | 9.5%(-5.65)#80 | 10.0%(-6.11)#3,345 |
| 81. | Dardenne Prairie | 3.8% | 9.5%(-5.65)#81 | 10.0%(-6.10)#3,348 |
| 82. | Town And Country | 3.9% | 9.5%(-5.63)#82 | 10.0%(-6.08)#3,359 |
| 83. | Lee S Summit | 3.9% | 9.5%(-5.56)#83 | 10.0%(-6.01)#3,460 |
| 84. | Platte Woods | 4.0% | 9.5%(-5.54)#84 | 10.0%(-5.99)#3,482 |
| 85. | Carl Junction | 4.0% | 9.5%(-5.53)#85 | 10.0%(-5.99)#3,488 |
| 86. | Wentzville | 4.0% | 9.5%(-5.51)#86 | 10.0%(-5.97)#3,515 |
| 87. | Montrose | 4.1% | 9.5%(-5.42)#87 | 10.0%(-5.87)#3,656 |
| 88. | Oakland | 4.1% | 9.5%(-5.38)#88 | 10.0%(-5.83)#3,715 |
| 89. | Murphy | 4.1% | 9.5%(-5.38)#89 | 10.0%(-5.83)#3,718 |
| 90. | Pleasant Hill | 4.1% | 9.5%(-5.36)#90 | 10.0%(-5.81)#3,749 |
| 91. | Old Jamestown | 4.2% | 9.5%(-5.33)#91 | 10.0%(-5.79)#3,765 |
| 92. | New Hampton | 4.2% | 9.5%(-5.33)#92 | 10.0%(-5.79)#3,786 |
| 93. | Hunnewell | 4.2% | 9.5%(-5.33)#93 | 10.0%(-5.79)#3,794 |
| 94. | Craig | 4.2% | 9.5%(-5.33)#94 | 10.0%(-5.79)#3,800 |
| 95. | Norborne | 4.3% | 9.5%(-5.19)#95 | 10.0%(-5.64)#3,976 |
| 96. | Weston | 4.3% | 9.5%(-5.18)#96 | 10.0%(-5.64)#3,989 |
| 97. | Creve Coeur | 4.3% | 9.5%(-5.16)#97 | 10.0%(-5.61)#4,019 |
| 98. | Leawood | 4.3% | 9.5%(-5.15)#98 | 10.0%(-5.60)#4,034 |
| 99. | Sheridan | 4.3% | 9.5%(-5.15)#99 | 10.0%(-5.60)#4,055 |
| 100. | Lockwood | 4.4% | 9.5%(-5.10)#100 | 10.0%(-5.56)#4,119 |
Common Questions
What are the Top 10 Cities with the Lowest Poverty Level Among Seniors Over the Age of 65 in Missouri?
Top 10 Cities with the Lowest Poverty Level Among Seniors Over the Age of 65 in Missouri are:
#1
0.27%
#2
0.81%
#3
0.88%
#4
1.0%
#5
1.2%
#6
1.2%
#7
1.5%
#8
1.5%
#9
1.6%
#10
1.6%
What city has the Lowest Poverty Level Among Seniors Over the Age of 65 in Missouri?
Pacific has the Lowest Poverty Level Among Seniors Over the Age of 65 in Missouri with 0.27%.
What is the Poverty Level Among Seniors Over the Age of 65 in the State of Missouri?
Poverty Level Among Seniors Over the Age of 65 in Missouri is 9.5%.
What is the Poverty Level Among Seniors Over the Age of 65 in the United States?
Poverty Level Among Seniors Over the Age of 65 in the United States is 10.0%.