Cities with the Lowest Poverty Level Among Seniors Over the Age of 65 in Pennsylvania
RELATED REPORTS & OPTIONS
Lowest Poverty | Seniors 65+
Pennsylvania
Compare Cities
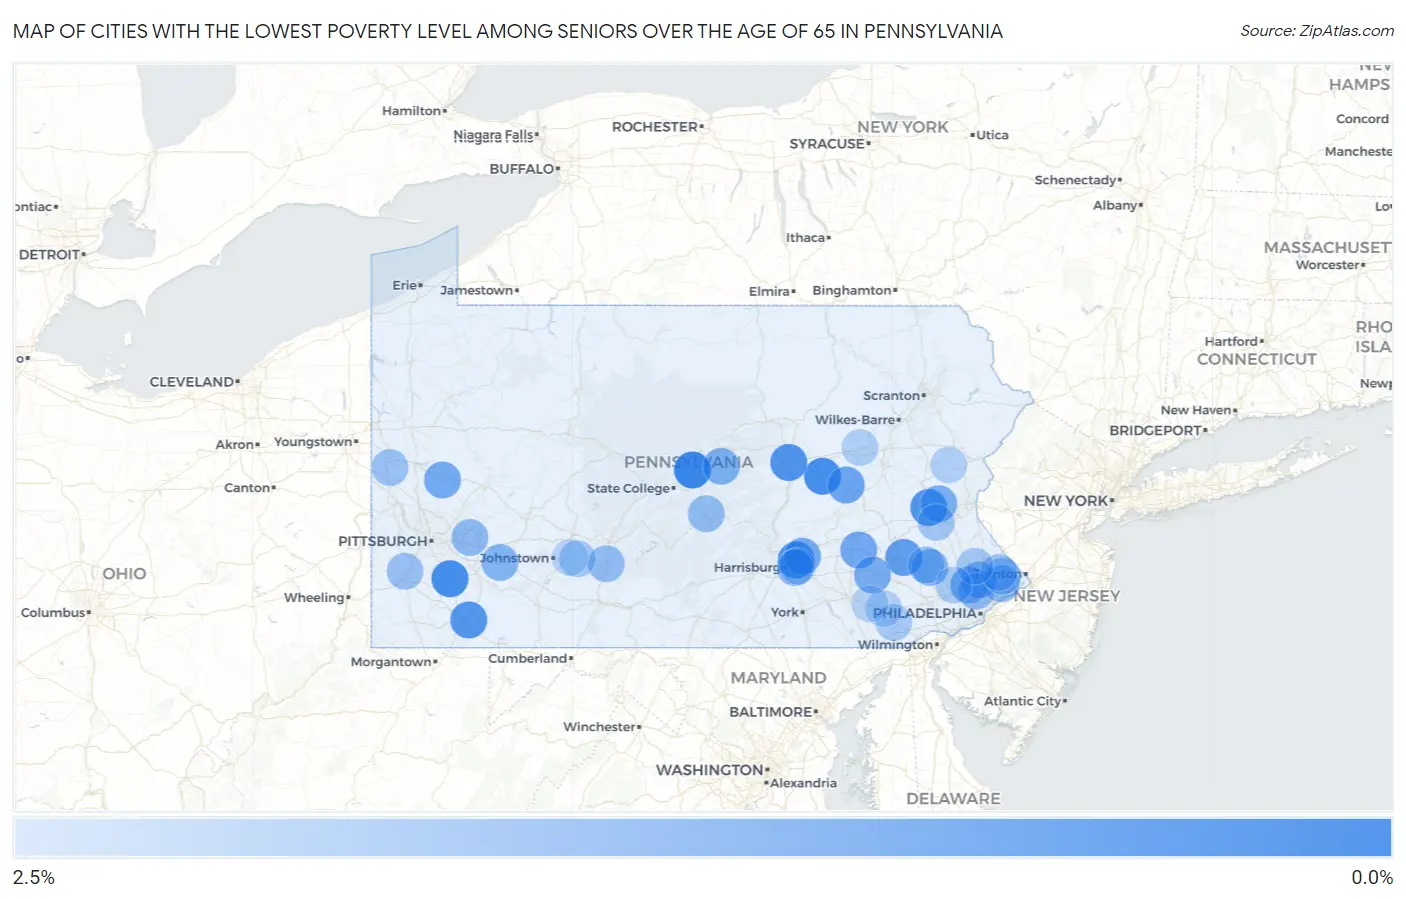
Map of Cities with the Lowest Poverty Level Among Seniors Over the Age of 65 in Pennsylvania
2.5%
0.0%
Cities with the Lowest Poverty Level Among Seniors Over the Age of 65 in Pennsylvania
| City | Senior Poverty | vs State | vs National | |
| 1. | Villanova | 0.22% | 8.9%(-8.67)#1 | 10.0%(-9.73)#23 |
| 2. | Zion | 0.26% | 8.9%(-8.63)#2 | 10.0%(-9.69)#36 |
| 3. | Elysburg | 0.43% | 8.9%(-8.46)#3 | 10.0%(-9.53)#66 |
| 4. | Fellsburg | 0.43% | 8.9%(-8.46)#4 | 10.0%(-9.52)#69 |
| 5. | Frazer | 0.53% | 8.9%(-8.36)#5 | 10.0%(-9.42)#90 |
| 6. | Paxtonia | 0.55% | 8.9%(-8.34)#6 | 10.0%(-9.40)#93 |
| 7. | Montandon | 0.63% | 8.9%(-8.26)#7 | 10.0%(-9.32)#109 |
| 8. | York Haven Borough | 0.63% | 8.9%(-8.26)#8 | 10.0%(-9.32)#110 |
| 9. | Schnecksville | 0.65% | 8.9%(-8.24)#9 | 10.0%(-9.30)#119 |
| 10. | Lemont Furnace | 0.69% | 8.9%(-8.20)#10 | 10.0%(-9.26)#135 |
| 11. | Bryn Athyn Borough | 0.70% | 8.9%(-8.19)#11 | 10.0%(-9.25)#141 |
| 12. | Rockledge Borough | 0.83% | 8.9%(-8.06)#12 | 10.0%(-9.12)#191 |
| 13. | Silverdale Borough | 0.85% | 8.9%(-8.04)#13 | 10.0%(-9.10)#199 |
| 14. | Platea Borough | 0.88% | 8.9%(-8.01)#14 | 10.0%(-9.07)#219 |
| 15. | Jacksonwald | 0.91% | 8.9%(-7.98)#15 | 10.0%(-9.04)#228 |
| 16. | Penn Lake Park Borough | 0.98% | 8.9%(-7.91)#16 | 10.0%(-8.97)#272 |
| 17. | Thornburg Borough | 0.99% | 8.9%(-7.90)#17 | 10.0%(-8.96)#280 |
| 18. | Rosslyn Farms Borough | 1.1% | 8.9%(-7.82)#18 | 10.0%(-8.88)#320 |
| 19. | Manorville Borough | 1.1% | 8.9%(-7.80)#19 | 10.0%(-8.86)#331 |
| 20. | Aristes | 1.1% | 8.9%(-7.80)#20 | 10.0%(-8.86)#332 |
| 21. | Red Lion Borough | 1.1% | 8.9%(-7.74)#21 | 10.0%(-8.80)#372 |
| 22. | Madison Borough | 1.2% | 8.9%(-7.73)#22 | 10.0%(-8.79)#387 |
| 23. | Oakdale Borough | 1.2% | 8.9%(-7.72)#23 | 10.0%(-8.78)#391 |
| 24. | Paint Borough | 1.2% | 8.9%(-7.72)#24 | 10.0%(-8.78)#393 |
| 25. | Stouchsburg | 1.2% | 8.9%(-7.71)#25 | 10.0%(-8.78)#401 |
| 26. | Edgewood Borough | 1.2% | 8.9%(-7.70)#26 | 10.0%(-8.76)#404 |
| 27. | South Waverly Borough | 1.2% | 8.9%(-7.69)#27 | 10.0%(-8.76)#412 |
| 28. | Elizabethville Borough | 1.2% | 8.9%(-7.68)#28 | 10.0%(-8.75)#419 |
| 29. | Skyline View | 1.2% | 8.9%(-7.68)#29 | 10.0%(-8.74)#426 |
| 30. | Meadowood | 1.3% | 8.9%(-7.63)#30 | 10.0%(-8.70)#452 |
| 31. | Bernville Borough | 1.3% | 8.9%(-7.60)#31 | 10.0%(-8.66)#486 |
| 32. | Reamstown | 1.3% | 8.9%(-7.59)#32 | 10.0%(-8.65)#489 |
| 33. | South New Castle Borough | 1.3% | 8.9%(-7.57)#33 | 10.0%(-8.63)#513 |
| 34. | Blue Bell | 1.3% | 8.9%(-7.56)#34 | 10.0%(-8.63)#514 |
| 35. | Petersburg Borough | 1.3% | 8.9%(-7.56)#35 | 10.0%(-8.62)#523 |
| 36. | Freeburg Borough | 1.3% | 8.9%(-7.55)#36 | 10.0%(-8.61)#530 |
| 37. | Foxburg Borough | 1.4% | 8.9%(-7.52)#37 | 10.0%(-8.58)#554 |
| 38. | Egypt | 1.4% | 8.9%(-7.52)#38 | 10.0%(-8.58)#556 |
| 39. | Ramey Borough | 1.4% | 8.9%(-7.50)#39 | 10.0%(-8.56)#565 |
| 40. | Rebersburg | 1.4% | 8.9%(-7.48)#40 | 10.0%(-8.54)#583 |
| 41. | Jennerstown Borough | 1.4% | 8.9%(-7.46)#41 | 10.0%(-8.52)#604 |
| 42. | New Wilmington Borough | 1.4% | 8.9%(-7.45)#42 | 10.0%(-8.52)#606 |
| 43. | Churchill Borough | 1.5% | 8.9%(-7.42)#43 | 10.0%(-8.48)#634 |
| 44. | Connoquenessing Borough | 1.5% | 8.9%(-7.40)#44 | 10.0%(-8.46)#641 |
| 45. | Harmony Borough | 1.5% | 8.9%(-7.37)#45 | 10.0%(-8.43)#664 |
| 46. | New Alexandria Borough | 1.5% | 8.9%(-7.37)#46 | 10.0%(-8.43)#666 |
| 47. | Pottsgrove | 1.5% | 8.9%(-7.36)#47 | 10.0%(-8.42)#669 |
| 48. | Lawson Heights | 1.6% | 8.9%(-7.33)#48 | 10.0%(-8.39)#690 |
| 49. | Lawnton | 1.6% | 8.9%(-7.30)#49 | 10.0%(-8.36)#721 |
| 50. | Wind Gap Borough | 1.6% | 8.9%(-7.29)#50 | 10.0%(-8.35)#730 |
| 51. | Trevose | 1.6% | 8.9%(-7.24)#51 | 10.0%(-8.30)#765 |
| 52. | Stockertown Borough | 1.7% | 8.9%(-7.21)#52 | 10.0%(-8.28)#789 |
| 53. | Murrysville | 1.7% | 8.9%(-7.20)#53 | 10.0%(-8.27)#796 |
| 54. | Strasburg Borough | 1.7% | 8.9%(-7.18)#54 | 10.0%(-8.25)#821 |
| 55. | Maple Glen | 1.7% | 8.9%(-7.18)#55 | 10.0%(-8.24)#829 |
| 56. | Highland Park | 1.8% | 8.9%(-7.12)#56 | 10.0%(-8.18)#875 |
| 57. | Claysburg | 1.8% | 8.9%(-7.10)#57 | 10.0%(-8.17)#892 |
| 58. | Port Royal Borough | 1.8% | 8.9%(-7.09)#58 | 10.0%(-8.16)#900 |
| 59. | Flourtown | 1.8% | 8.9%(-7.07)#59 | 10.0%(-8.13)#922 |
| 60. | Village Shires | 1.8% | 8.9%(-7.05)#60 | 10.0%(-8.11)#941 |
| 61. | Pennsbury Village Borough | 1.9% | 8.9%(-7.04)#61 | 10.0%(-8.10)#947 |
| 62. | East Washington Borough | 1.9% | 8.9%(-7.02)#62 | 10.0%(-8.09)#957 |
| 63. | Mcgovern | 1.9% | 8.9%(-7.00)#63 | 10.0%(-8.06)#972 |
| 64. | Alburtis Borough | 1.9% | 8.9%(-7.00)#64 | 10.0%(-8.06)#974 |
| 65. | Halfway House | 1.9% | 8.9%(-6.99)#65 | 10.0%(-8.05)#987 |
| 66. | New Stanton Borough | 1.9% | 8.9%(-6.99)#66 | 10.0%(-8.05)#989 |
| 67. | West Pittsburg | 1.9% | 8.9%(-6.97)#67 | 10.0%(-8.03)#1,006 |
| 68. | Rosemont | 1.9% | 8.9%(-6.96)#68 | 10.0%(-8.02)#1,026 |
| 69. | Smethport Borough | 2.0% | 8.9%(-6.94)#69 | 10.0%(-8.00)#1,043 |
| 70. | Richboro | 2.0% | 8.9%(-6.92)#70 | 10.0%(-7.98)#1,067 |
| 71. | Bolivar Borough | 2.0% | 8.9%(-6.89)#71 | 10.0%(-7.95)#1,095 |
| 72. | Eldorado | 2.0% | 8.9%(-6.88)#72 | 10.0%(-7.94)#1,106 |
| 73. | Rutledge Borough | 2.0% | 8.9%(-6.87)#73 | 10.0%(-7.93)#1,107 |
| 74. | Edgeworth Borough | 2.0% | 8.9%(-6.84)#74 | 10.0%(-7.90)#1,134 |
| 75. | Wescosville | 2.1% | 8.9%(-6.84)#75 | 10.0%(-7.90)#1,139 |
| 76. | Brittany Farms The Highlands | 2.1% | 8.9%(-6.84)#76 | 10.0%(-7.90)#1,140 |
| 77. | Narberth Borough | 2.1% | 8.9%(-6.82)#77 | 10.0%(-7.89)#1,155 |
| 78. | Palo Alto Borough | 2.1% | 8.9%(-6.82)#78 | 10.0%(-7.88)#1,160 |
| 79. | Birdsboro Borough | 2.1% | 8.9%(-6.80)#79 | 10.0%(-7.87)#1,182 |
| 80. | Beaverdale | 2.1% | 8.9%(-6.80)#80 | 10.0%(-7.86)#1,185 |
| 81. | Cochranville | 2.1% | 8.9%(-6.75)#81 | 10.0%(-7.81)#1,223 |
| 82. | Jersey Shore Borough | 2.2% | 8.9%(-6.73)#82 | 10.0%(-7.79)#1,231 |
| 83. | Ben Avon Heights Borough | 2.2% | 8.9%(-6.72)#83 | 10.0%(-7.78)#1,246 |
| 84. | Hydetown Borough | 2.2% | 8.9%(-6.70)#84 | 10.0%(-7.77)#1,262 |
| 85. | Trooper | 2.2% | 8.9%(-6.70)#85 | 10.0%(-7.76)#1,266 |
| 86. | Snydertown Borough | 2.2% | 8.9%(-6.69)#86 | 10.0%(-7.75)#1,276 |
| 87. | Ebensburg Borough | 2.2% | 8.9%(-6.67)#87 | 10.0%(-7.73)#1,293 |
| 88. | Conyngham Borough | 2.2% | 8.9%(-6.65)#88 | 10.0%(-7.71)#1,316 |
| 89. | Pennsburg Borough | 2.3% | 8.9%(-6.63)#89 | 10.0%(-7.69)#1,342 |
| 90. | Lilly Borough | 2.3% | 8.9%(-6.63)#90 | 10.0%(-7.69)#1,343 |
| 91. | East Berwick | 2.3% | 8.9%(-6.63)#91 | 10.0%(-7.69)#1,344 |
| 92. | Gap | 2.3% | 8.9%(-6.60)#92 | 10.0%(-7.67)#1,361 |
| 93. | Effort | 2.3% | 8.9%(-6.58)#93 | 10.0%(-7.64)#1,386 |
| 94. | Rutherford | 2.3% | 8.9%(-6.56)#94 | 10.0%(-7.63)#1,396 |
| 95. | West Middlesex Borough | 2.3% | 8.9%(-6.56)#95 | 10.0%(-7.63)#1,398 |
| 96. | St Petersburg Borough | 2.3% | 8.9%(-6.56)#96 | 10.0%(-7.63)#1,405 |
| 97. | Fox Chapel Borough | 2.4% | 8.9%(-6.53)#97 | 10.0%(-7.59)#1,436 |
| 98. | Bechtelsville Borough | 2.4% | 8.9%(-6.51)#98 | 10.0%(-7.57)#1,460 |
| 99. | Gordonville | 2.4% | 8.9%(-6.51)#99 | 10.0%(-7.57)#1,462 |
| 100. | St Michael | 2.4% | 8.9%(-6.51)#100 | 10.0%(-7.57)#1,468 |
Common Questions
What are the Top 10 Cities with the Lowest Poverty Level Among Seniors Over the Age of 65 in Pennsylvania?
Top 10 Cities with the Lowest Poverty Level Among Seniors Over the Age of 65 in Pennsylvania are:
#1
0.26%
#2
0.43%
#3
0.43%
#4
0.55%
#5
0.63%
#6
0.65%
#7
0.69%
#8
0.91%
#9
1.1%
#10
1.2%
What city has the Lowest Poverty Level Among Seniors Over the Age of 65 in Pennsylvania?
Zion has the Lowest Poverty Level Among Seniors Over the Age of 65 in Pennsylvania with 0.26%.
What is the Poverty Level Among Seniors Over the Age of 65 in the State of Pennsylvania?
Poverty Level Among Seniors Over the Age of 65 in Pennsylvania is 8.9%.
What is the Poverty Level Among Seniors Over the Age of 65 in the United States?
Poverty Level Among Seniors Over the Age of 65 in the United States is 10.0%.