Cities with the Lowest Poverty Level Among Seniors Over the Age of 65 in Illinois
RELATED REPORTS & OPTIONS
Lowest Poverty | Seniors 65+
Illinois
Compare Cities
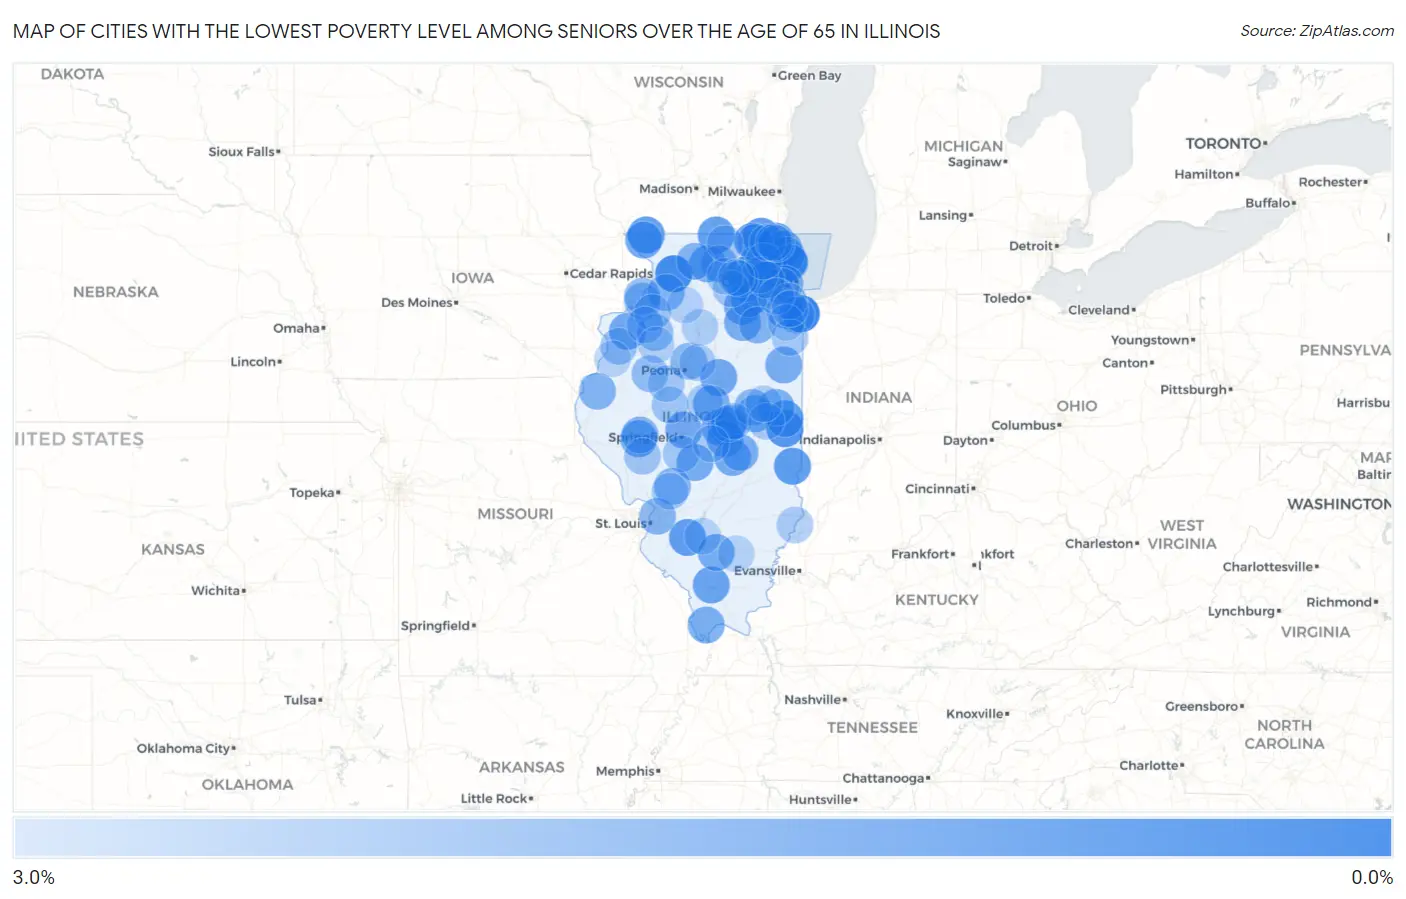
Map of Cities with the Lowest Poverty Level Among Seniors Over the Age of 65 in Illinois
3.0%
0.0%
Cities with the Lowest Poverty Level Among Seniors Over the Age of 65 in Illinois
| City | Senior Poverty | vs State | vs National | |
| 1. | Willowbrook | 0.24% | 9.4%(-9.16)#1 | 10.0%(-9.71)#30 |
| 2. | Milledgeville | 0.42% | 9.4%(-8.98)#2 | 10.0%(-9.53)#64 |
| 3. | Glencoe | 0.63% | 9.4%(-8.77)#3 | 10.0%(-9.32)#112 |
| 4. | Long Grove | 0.68% | 9.4%(-8.72)#4 | 10.0%(-9.27)#131 |
| 5. | Sidell | 0.79% | 9.4%(-8.61)#5 | 10.0%(-9.16)#175 |
| 6. | Grandwood Park | 0.87% | 9.4%(-8.53)#6 | 10.0%(-9.08)#211 |
| 7. | Scales Mound | 0.93% | 9.4%(-8.47)#7 | 10.0%(-9.03)#241 |
| 8. | Spring Grove | 0.93% | 9.4%(-8.47)#8 | 10.0%(-9.02)#244 |
| 9. | Marshall | 0.95% | 9.4%(-8.45)#9 | 10.0%(-9.00)#255 |
| 10. | Okawville | 0.97% | 9.4%(-8.43)#10 | 10.0%(-8.98)#264 |
| 11. | Fairmount | 1.0% | 9.4%(-8.38)#11 | 10.0%(-8.93)#294 |
| 12. | South Beloit | 1.0% | 9.4%(-8.38)#12 | 10.0%(-8.93)#295 |
| 13. | Greenwood | 1.0% | 9.4%(-8.36)#13 | 10.0%(-8.91)#307 |
| 14. | Lake Bluff | 1.1% | 9.4%(-8.28)#14 | 10.0%(-8.83)#352 |
| 15. | Oreana | 1.1% | 9.4%(-8.28)#15 | 10.0%(-8.83)#355 |
| 16. | Inverness | 1.1% | 9.4%(-8.26)#16 | 10.0%(-8.81)#368 |
| 17. | Cambria | 1.2% | 9.4%(-8.22)#17 | 10.0%(-8.78)#399 |
| 18. | The Galena Territory | 1.2% | 9.4%(-8.16)#18 | 10.0%(-8.71)#442 |
| 19. | Newark | 1.3% | 9.4%(-8.15)#19 | 10.0%(-8.70)#450 |
| 20. | Sherman | 1.3% | 9.4%(-8.13)#20 | 10.0%(-8.68)#463 |
| 21. | Viola | 1.3% | 9.4%(-8.12)#21 | 10.0%(-8.67)#475 |
| 22. | Hudson | 1.3% | 9.4%(-8.10)#22 | 10.0%(-8.65)#492 |
| 23. | Forsyth | 1.3% | 9.4%(-8.09)#23 | 10.0%(-8.64)#503 |
| 24. | Chapin | 1.3% | 9.4%(-8.08)#24 | 10.0%(-8.64)#507 |
| 25. | Boulder Hill | 1.3% | 9.4%(-8.08)#25 | 10.0%(-8.63)#511 |
| 26. | Kaneville | 1.3% | 9.4%(-8.07)#26 | 10.0%(-8.62)#519 |
| 27. | Frankfort | 1.3% | 9.4%(-8.06)#27 | 10.0%(-8.62)#527 |
| 28. | Stillman Valley | 1.3% | 9.4%(-8.06)#28 | 10.0%(-8.61)#539 |
| 29. | Waynesville | 1.4% | 9.4%(-8.05)#29 | 10.0%(-8.60)#543 |
| 30. | Palmer | 1.4% | 9.4%(-8.03)#30 | 10.0%(-8.58)#555 |
| 31. | Waltonville | 1.4% | 9.4%(-8.01)#31 | 10.0%(-8.56)#566 |
| 32. | Sleepy Hollow | 1.4% | 9.4%(-8.00)#32 | 10.0%(-8.55)#579 |
| 33. | Mount Zion | 1.4% | 9.4%(-8.00)#33 | 10.0%(-8.55)#580 |
| 34. | Findlay | 1.4% | 9.4%(-7.99)#34 | 10.0%(-8.54)#582 |
| 35. | Highwood | 1.4% | 9.4%(-7.98)#35 | 10.0%(-8.53)#595 |
| 36. | Seneca | 1.4% | 9.4%(-7.95)#36 | 10.0%(-8.50)#612 |
| 37. | Crescent City | 1.5% | 9.4%(-7.94)#37 | 10.0%(-8.49)#622 |
| 38. | Virgil | 1.5% | 9.4%(-7.93)#38 | 10.0%(-8.48)#630 |
| 39. | Pulaski | 1.5% | 9.4%(-7.93)#39 | 10.0%(-8.48)#632 |
| 40. | Royal | 1.5% | 9.4%(-7.91)#40 | 10.0%(-8.46)#643 |
| 41. | Sullivan | 1.5% | 9.4%(-7.90)#41 | 10.0%(-8.46)#649 |
| 42. | Winnetka | 1.5% | 9.4%(-7.88)#42 | 10.0%(-8.43)#668 |
| 43. | Yorkville | 1.5% | 9.4%(-7.87)#43 | 10.0%(-8.42)#672 |
| 44. | Bondville | 1.5% | 9.4%(-7.86)#44 | 10.0%(-8.41)#676 |
| 45. | Argenta | 1.5% | 9.4%(-7.85)#45 | 10.0%(-8.41)#681 |
| 46. | Riverside | 1.6% | 9.4%(-7.85)#46 | 10.0%(-8.40)#687 |
| 47. | Carbon Hill | 1.6% | 9.4%(-7.81)#47 | 10.0%(-8.36)#714 |
| 48. | Western Springs | 1.6% | 9.4%(-7.79)#48 | 10.0%(-8.35)#736 |
| 49. | Winfield | 1.6% | 9.4%(-7.79)#49 | 10.0%(-8.34)#740 |
| 50. | Monroe Center | 1.6% | 9.4%(-7.79)#50 | 10.0%(-8.34)#746 |
| 51. | Leaf River | 1.6% | 9.4%(-7.76)#51 | 10.0%(-8.31)#759 |
| 52. | Carthage | 1.7% | 9.4%(-7.75)#52 | 10.0%(-8.30)#769 |
| 53. | Lyndon | 1.7% | 9.4%(-7.73)#53 | 10.0%(-8.29)#776 |
| 54. | East Gillespie | 1.7% | 9.4%(-7.72)#54 | 10.0%(-8.27)#792 |
| 55. | Pontoon Beach | 1.7% | 9.4%(-7.71)#55 | 10.0%(-8.26)#797 |
| 56. | Concord | 1.7% | 9.4%(-7.68)#56 | 10.0%(-8.23)#846 |
| 57. | Mahomet | 1.7% | 9.4%(-7.66)#57 | 10.0%(-8.21)#857 |
| 58. | Bay View Gardens | 1.8% | 9.4%(-7.65)#58 | 10.0%(-8.20)#868 |
| 59. | Port Byron | 1.8% | 9.4%(-7.56)#59 | 10.0%(-8.11)#938 |
| 60. | Cordova | 1.9% | 9.4%(-7.51)#60 | 10.0%(-8.06)#975 |
| 61. | Fairview | 1.9% | 9.4%(-7.50)#61 | 10.0%(-8.05)#993 |
| 62. | Wonder Lake | 1.9% | 9.4%(-7.45)#62 | 10.0%(-8.00)#1,037 |
| 63. | Bishop Hill | 2.0% | 9.4%(-7.44)#63 | 10.0%(-7.99)#1,062 |
| 64. | Wayne | 2.0% | 9.4%(-7.40)#64 | 10.0%(-7.95)#1,099 |
| 65. | Little York | 2.0% | 9.4%(-7.36)#65 | 10.0%(-7.91)#1,126 |
| 66. | Maple Park | 2.1% | 9.4%(-7.35)#66 | 10.0%(-7.90)#1,136 |
| 67. | Barrington Hills | 2.1% | 9.4%(-7.35)#67 | 10.0%(-7.90)#1,142 |
| 68. | Geneseo | 2.1% | 9.4%(-7.32)#68 | 10.0%(-7.87)#1,165 |
| 69. | Crete | 2.1% | 9.4%(-7.32)#69 | 10.0%(-7.87)#1,166 |
| 70. | Easton | 2.1% | 9.4%(-7.27)#70 | 10.0%(-7.82)#1,212 |
| 71. | Manchester | 2.1% | 9.4%(-7.27)#71 | 10.0%(-7.82)#1,215 |
| 72. | Andover | 2.2% | 9.4%(-7.25)#72 | 10.0%(-7.80)#1,226 |
| 73. | Divernon | 2.2% | 9.4%(-7.23)#73 | 10.0%(-7.78)#1,239 |
| 74. | Cisco | 2.2% | 9.4%(-7.23)#74 | 10.0%(-7.78)#1,247 |
| 75. | Waterman | 2.2% | 9.4%(-7.19)#75 | 10.0%(-7.75)#1,281 |
| 76. | Malta | 2.2% | 9.4%(-7.17)#76 | 10.0%(-7.72)#1,307 |
| 77. | Long Lake | 2.2% | 9.4%(-7.15)#77 | 10.0%(-7.70)#1,324 |
| 78. | Sun River Terrace | 2.2% | 9.4%(-7.15)#78 | 10.0%(-7.70)#1,328 |
| 79. | Wilsonville | 2.2% | 9.4%(-7.15)#79 | 10.0%(-7.70)#1,330 |
| 80. | Banner | 2.3% | 9.4%(-7.13)#80 | 10.0%(-7.68)#1,355 |
| 81. | Philo | 2.3% | 9.4%(-7.10)#81 | 10.0%(-7.65)#1,382 |
| 82. | Candlewick Lake | 2.3% | 9.4%(-7.08)#82 | 10.0%(-7.64)#1,388 |
| 83. | Metamora | 2.3% | 9.4%(-7.07)#83 | 10.0%(-7.62)#1,408 |
| 84. | Gages Lake | 2.3% | 9.4%(-7.07)#84 | 10.0%(-7.62)#1,409 |
| 85. | Blue Mound | 2.3% | 9.4%(-7.06)#85 | 10.0%(-7.61)#1,421 |
| 86. | St Francisville | 2.3% | 9.4%(-7.06)#86 | 10.0%(-7.61)#1,423 |
| 87. | Atlanta | 2.4% | 9.4%(-7.03)#87 | 10.0%(-7.58)#1,443 |
| 88. | Hennepin | 2.4% | 9.4%(-7.00)#88 | 10.0%(-7.55)#1,495 |
| 89. | Oak Forest | 2.4% | 9.4%(-6.99)#89 | 10.0%(-7.54)#1,500 |
| 90. | Thomasboro | 2.4% | 9.4%(-6.98)#90 | 10.0%(-7.54)#1,507 |
| 91. | Victoria | 2.4% | 9.4%(-6.96)#91 | 10.0%(-7.51)#1,536 |
| 92. | Walnut | 2.5% | 9.4%(-6.92)#92 | 10.0%(-7.47)#1,571 |
| 93. | Lemont | 2.5% | 9.4%(-6.90)#93 | 10.0%(-7.45)#1,596 |
| 94. | Third Lake | 2.5% | 9.4%(-6.89)#94 | 10.0%(-7.44)#1,602 |
| 95. | Peotone | 2.5% | 9.4%(-6.88)#95 | 10.0%(-7.43)#1,615 |
| 96. | Dahlgren | 2.5% | 9.4%(-6.88)#96 | 10.0%(-7.43)#1,618 |
| 97. | Matteson | 2.5% | 9.4%(-6.88)#97 | 10.0%(-7.43)#1,621 |
| 98. | Hoyleton | 2.5% | 9.4%(-6.87)#98 | 10.0%(-7.42)#1,632 |
| 99. | Cortland | 2.5% | 9.4%(-6.85)#99 | 10.0%(-7.41)#1,645 |
| 100. | Biggsville | 2.6% | 9.4%(-6.84)#100 | 10.0%(-7.39)#1,666 |
Common Questions
What are the Top 10 Cities with the Lowest Poverty Level Among Seniors Over the Age of 65 in Illinois?
Top 10 Cities with the Lowest Poverty Level Among Seniors Over the Age of 65 in Illinois are:
#1
0.24%
#2
0.42%
#3
0.63%
#4
0.68%
#5
0.79%
#6
0.87%
#7
0.93%
#8
0.93%
#9
0.95%
#10
0.97%
What city has the Lowest Poverty Level Among Seniors Over the Age of 65 in Illinois?
Willowbrook has the Lowest Poverty Level Among Seniors Over the Age of 65 in Illinois with 0.24%.
What is the Poverty Level Among Seniors Over the Age of 65 in the State of Illinois?
Poverty Level Among Seniors Over the Age of 65 in Illinois is 9.4%.
What is the Poverty Level Among Seniors Over the Age of 65 in the United States?
Poverty Level Among Seniors Over the Age of 65 in the United States is 10.0%.