Crest, CA Map & Demographics
Crest Map
Crest Overview
$39,764
PER CAPITA INCOME
$115,972
AVG FAMILY INCOME
$108,417
AVG HOUSEHOLD INCOME
24.8%
WAGE / INCOME GAP [ % ]
75.2¢/ $1
WAGE / INCOME GAP [ $ ]
0.37
INEQUALITY / GINI INDEX
3,179
TOTAL POPULATION
1,489
MALE POPULATION
1,690
FEMALE POPULATION
88.11
MALES / 100 FEMALES
113.50
FEMALES / 100 MALES
43.4
MEDIAN AGE
3.2
AVG FAMILY SIZE
3.0
AVG HOUSEHOLD SIZE
1,314
LABOR FORCE [ PEOPLE ]
49.9%
PERCENT IN LABOR FORCE
5.4%
UNEMPLOYMENT RATE
Income in Crest
Income Overview in Crest
Per Capita Income in Crest is $39,764, while median incomes of families and households are $115,972 and $108,417 respectively.
| Characteristic | Number | Measure |
| Per Capita Income | 3,179 | $39,764 |
| Median Family Income | 859 | $115,972 |
| Mean Family Income | 859 | $124,033 |
| Median Household Income | 1,074 | $108,417 |
| Mean Household Income | 1,074 | $115,306 |
| Income Deficit | 859 | $0 |
| Wage / Income Gap (%) | 3,179 | 24.80% |
| Wage / Income Gap ($) | 3,179 | 75.20¢ per $1 |
| Gini / Inequality Index | 3,179 | 0.37 |
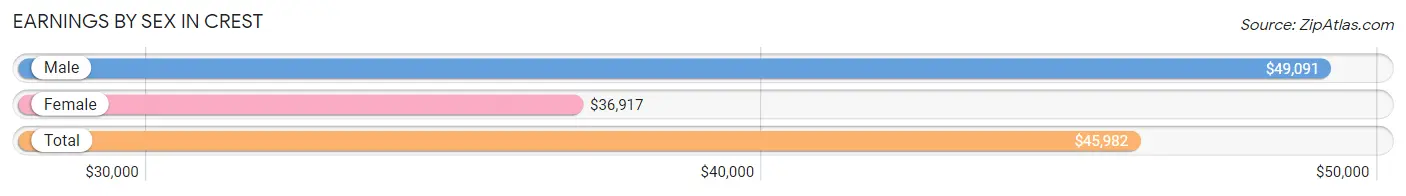
Earnings by Sex in Crest
Average Earnings in Crest are $45,982, $49,091 for men and $36,917 for women, a difference of 24.8%.
| Sex | Number | Average Earnings |
| Male | 766 (54.6%) | $49,091 |
| Female | 636 (45.4%) | $36,917 |
| Total | 1,402 (100.0%) | $45,982 |
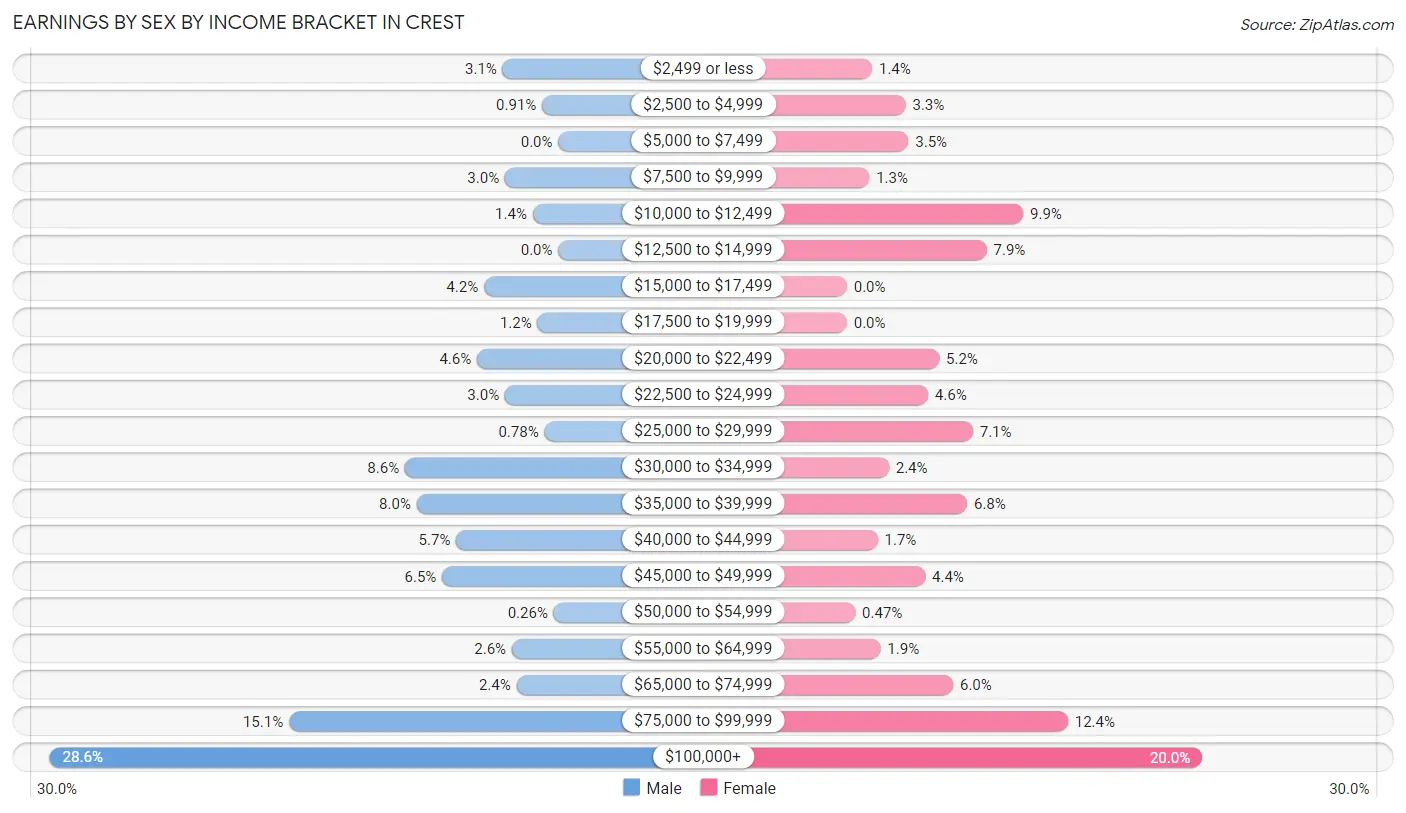
Earnings by Sex by Income Bracket in Crest
The most common earnings brackets in Crest are $100,000+ for men (219 | 28.6%) and $100,000+ for women (127 | 20.0%).
| Income | Male | Female |
| $2,499 or less | 24 (3.1%) | 9 (1.4%) |
| $2,500 to $4,999 | 7 (0.9%) | 21 (3.3%) |
| $5,000 to $7,499 | 0 (0.0%) | 22 (3.5%) |
| $7,500 to $9,999 | 23 (3.0%) | 8 (1.3%) |
| $10,000 to $12,499 | 11 (1.4%) | 63 (9.9%) |
| $12,500 to $14,999 | 0 (0.0%) | 50 (7.9%) |
| $15,000 to $17,499 | 32 (4.2%) | 0 (0.0%) |
| $17,500 to $19,999 | 9 (1.2%) | 0 (0.0%) |
| $20,000 to $22,499 | 35 (4.6%) | 33 (5.2%) |
| $22,500 to $24,999 | 23 (3.0%) | 29 (4.6%) |
| $25,000 to $29,999 | 6 (0.8%) | 45 (7.1%) |
| $30,000 to $34,999 | 66 (8.6%) | 15 (2.4%) |
| $35,000 to $39,999 | 61 (8.0%) | 43 (6.8%) |
| $40,000 to $44,999 | 44 (5.7%) | 11 (1.7%) |
| $45,000 to $49,999 | 50 (6.5%) | 28 (4.4%) |
| $50,000 to $54,999 | 2 (0.3%) | 3 (0.5%) |
| $55,000 to $64,999 | 20 (2.6%) | 12 (1.9%) |
| $65,000 to $74,999 | 18 (2.4%) | 38 (6.0%) |
| $75,000 to $99,999 | 116 (15.1%) | 79 (12.4%) |
| $100,000+ | 219 (28.6%) | 127 (20.0%) |
| Total | 766 (100.0%) | 636 (100.0%) |
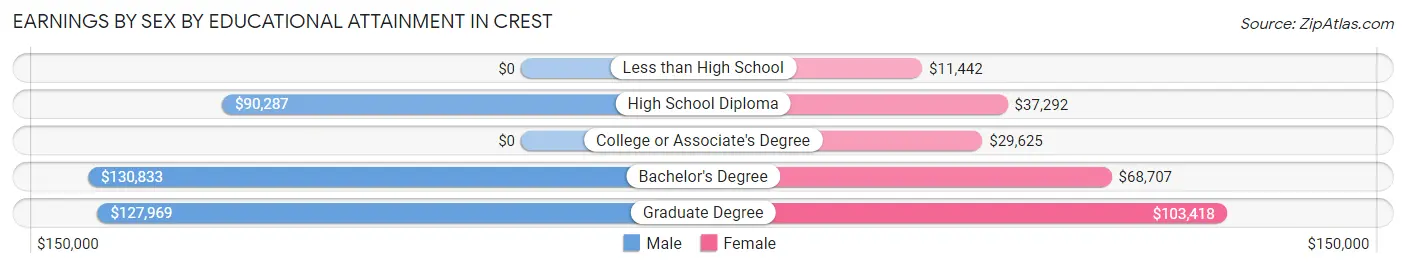
Earnings by Sex by Educational Attainment in Crest
Average earnings in Crest are $77,344 for men and $49,152 for women, a difference of 36.4%. Men with an educational attainment of bachelor's degree enjoy the highest average annual earnings of $130,833, while those with high school diploma education earn the least with $90,287. Women with an educational attainment of graduate degree earn the most with the average annual earnings of $103,418, while those with less than high school education have the smallest earnings of $11,442.
| Educational Attainment | Male Income | Female Income |
| Less than High School | - | - |
| High School Diploma | $90,287 | $37,292 |
| College or Associate's Degree | - | - |
| Bachelor's Degree | $130,833 | $68,707 |
| Graduate Degree | $127,969 | $103,418 |
| Total | $77,344 | $49,152 |
Family Income in Crest
Family Income Brackets in Crest
According to the Crest family income data, there are 275 families falling into the $100,000 to $149,999 income range, which is the most common income bracket and makes up 32.0% of all families.
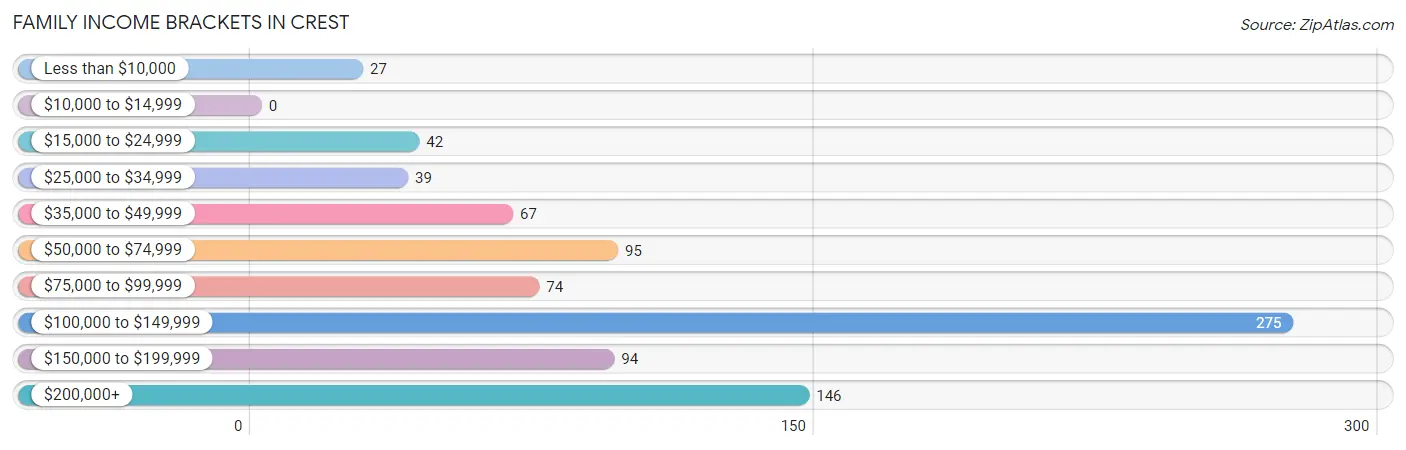
| Income Bracket | # Families | % Families |
| Less than $10,000 | 27 | 3.1% |
| $10,000 to $14,999 | 0 | 0.0% |
| $15,000 to $24,999 | 42 | 4.9% |
| $25,000 to $34,999 | 39 | 4.5% |
| $35,000 to $49,999 | 67 | 7.8% |
| $50,000 to $74,999 | 95 | 11.1% |
| $75,000 to $99,999 | 74 | 8.6% |
| $100,000 to $149,999 | 275 | 32.0% |
| $150,000 to $199,999 | 94 | 10.9% |
| $200,000+ | 146 | 17.0% |
Family Income by Famaliy Size in Crest
3-person families (237 | 27.6%) account for the highest median family income in Crest with $143,173 per family, while 2-person families (418 | 48.7%) have the highest median income of $53,542 per family member.
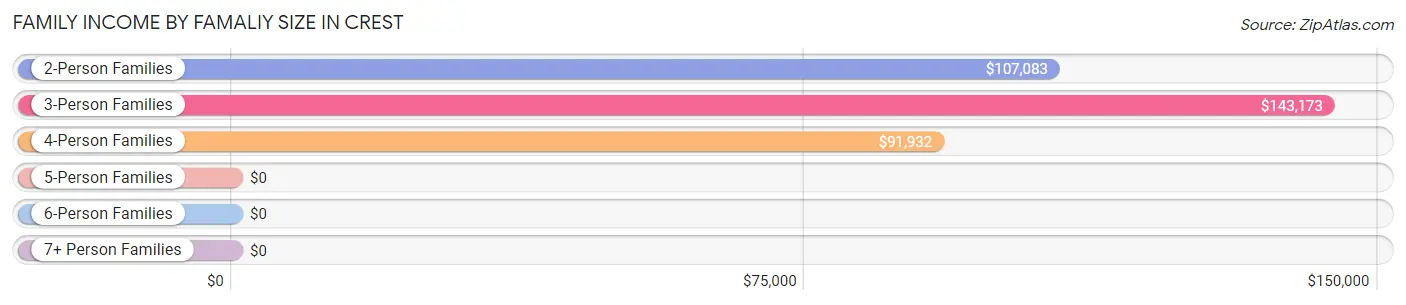
| Income Bracket | # Families | Median Income |
| 2-Person Families | 418 (48.7%) | $107,083 |
| 3-Person Families | 237 (27.6%) | $143,173 |
| 4-Person Families | 83 (9.7%) | $91,932 |
| 5-Person Families | 43 (5.0%) | $0 |
| 6-Person Families | 68 (7.9%) | $0 |
| 7+ Person Families | 10 (1.2%) | $0 |
| Total | 859 (100.0%) | $115,972 |
Family Income by Number of Earners in Crest
The median family income in Crest is $115,972, with families comprising 3+ earners (87) having the highest median family income of $149,448, while families with no earners (220) have the lowest median family income of $47,700, accounting for 10.1% and 25.6% of families, respectively.
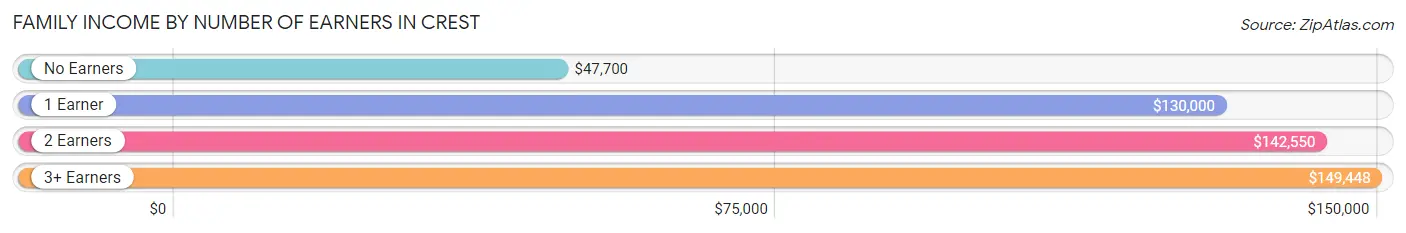
| Number of Earners | # Families | Median Income |
| No Earners | 220 (25.6%) | $47,700 |
| 1 Earner | 224 (26.1%) | $130,000 |
| 2 Earners | 328 (38.2%) | $142,550 |
| 3+ Earners | 87 (10.1%) | $149,448 |
| Total | 859 (100.0%) | $115,972 |
Household Income in Crest
Household Income Brackets in Crest
With 297 households falling in the category, the $100,000 to $149,999 income range is the most frequent in Crest, accounting for 27.7% of all households. In contrast, only 10 households (0.9%) fall into the $10,000 to $14,999 income bracket, making it the least populous group.
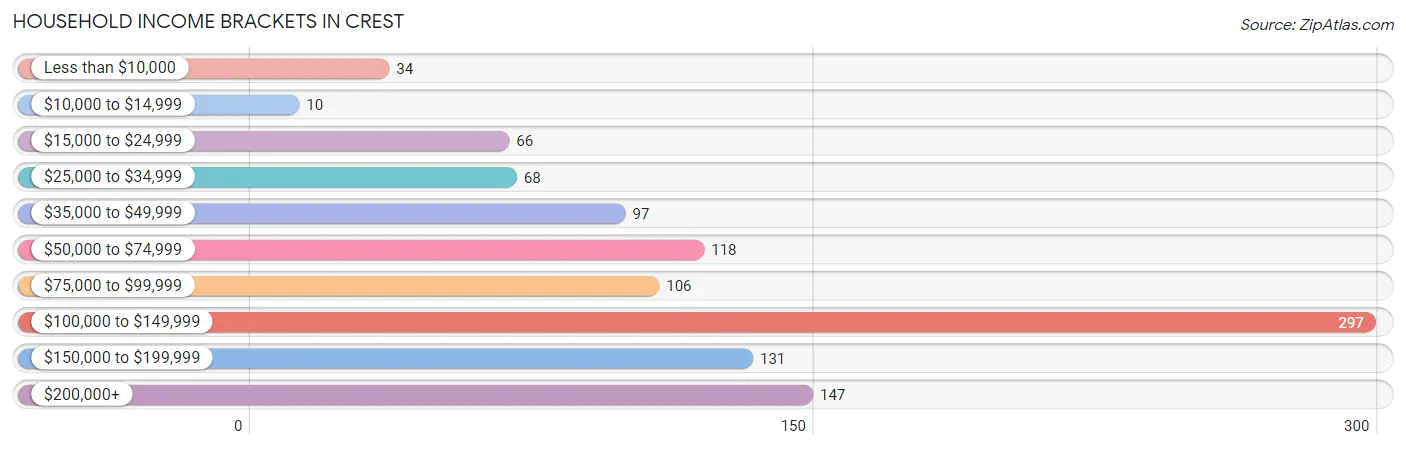
| Income Bracket | # Households | % Households |
| Less than $10,000 | 34 | 3.2% |
| $10,000 to $14,999 | 10 | 0.9% |
| $15,000 to $24,999 | 66 | 6.1% |
| $25,000 to $34,999 | 68 | 6.3% |
| $35,000 to $49,999 | 97 | 9.0% |
| $50,000 to $74,999 | 118 | 11.0% |
| $75,000 to $99,999 | 106 | 9.9% |
| $100,000 to $149,999 | 297 | 27.7% |
| $150,000 to $199,999 | 131 | 12.2% |
| $200,000+ | 147 | 13.7% |
Household Income by Householder Age in Crest
The median household income in Crest is $108,417, with the highest median household income of $148,276 found in the 45 to 64 years age bracket for the primary householder. A total of 410 households (38.2%) fall into this category. Meanwhile, the 15 to 24 years age bracket for the primary householder has the lowest median household income of $0, with 21 households (2.0%) in this group.
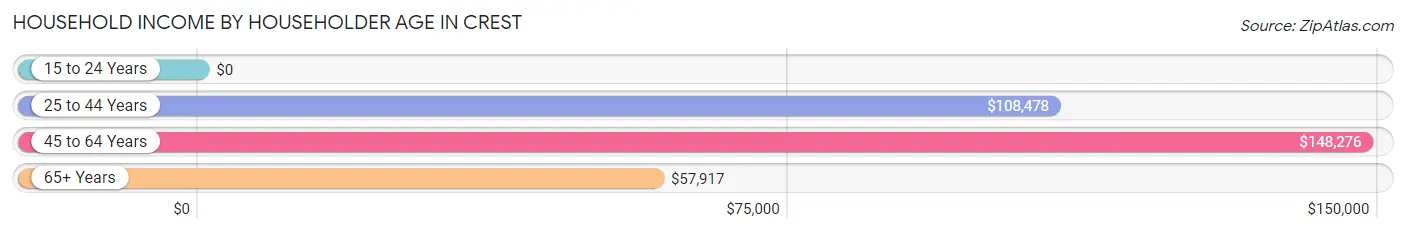
| Income Bracket | # Households | Median Income |
| 15 to 24 Years | 21 (2.0%) | $0 |
| 25 to 44 Years | 290 (27.0%) | $108,478 |
| 45 to 64 Years | 410 (38.2%) | $148,276 |
| 65+ Years | 353 (32.9%) | $57,917 |
| Total | 1,074 (100.0%) | $108,417 |
Poverty in Crest
Income Below Poverty by Sex and Age in Crest
With 4.2% poverty level for males and 4.7% for females among the residents of Crest, 5 year old males and 55 to 64 year old females are the most vulnerable to poverty, with 19 males (42.2%) and 52 females (15.2%) in their respective age groups living below the poverty level.
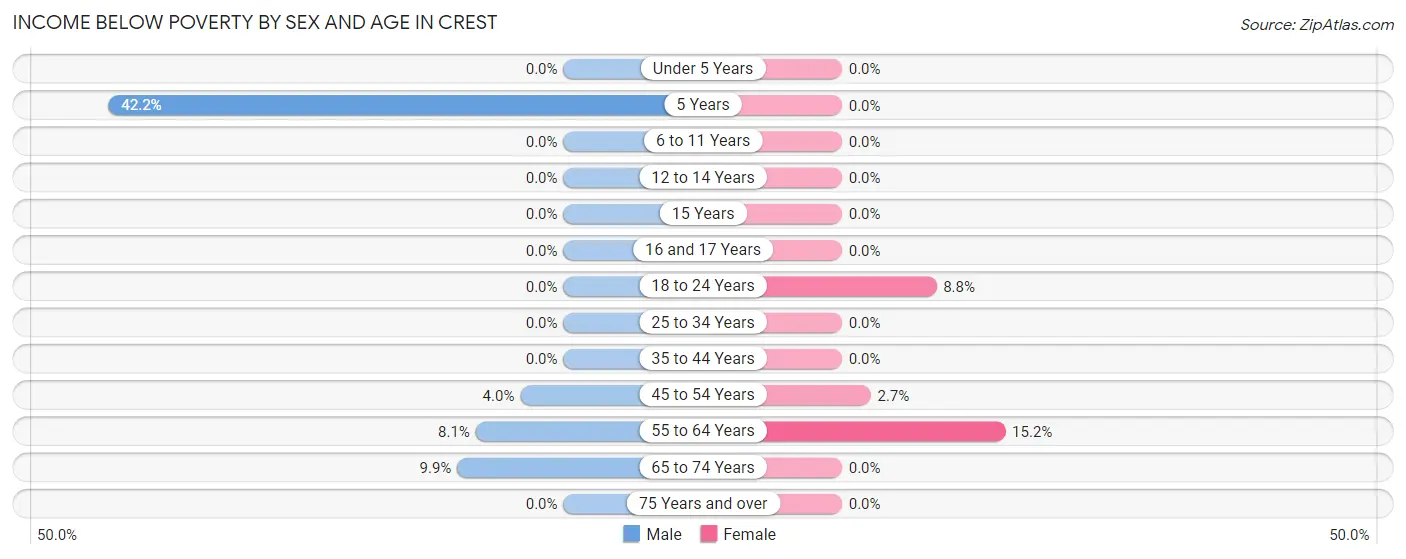
| Age Bracket | Male | Female |
| Under 5 Years | 0 (0.0%) | 0 (0.0%) |
| 5 Years | 19 (42.2%) | 0 (0.0%) |
| 6 to 11 Years | 0 (0.0%) | 0 (0.0%) |
| 12 to 14 Years | 0 (0.0%) | 0 (0.0%) |
| 15 Years | 0 (0.0%) | 0 (0.0%) |
| 16 and 17 Years | 0 (0.0%) | 0 (0.0%) |
| 18 to 24 Years | 0 (0.0%) | 22 (8.8%) |
| 25 to 34 Years | 0 (0.0%) | 0 (0.0%) |
| 35 to 44 Years | 0 (0.0%) | 0 (0.0%) |
| 45 to 54 Years | 6 (4.0%) | 4 (2.7%) |
| 55 to 64 Years | 24 (8.1%) | 52 (15.2%) |
| 65 to 74 Years | 13 (9.9%) | 0 (0.0%) |
| 75 Years and over | 0 (0.0%) | 0 (0.0%) |
| Total | 62 (4.2%) | 78 (4.7%) |
Income Above Poverty by Sex and Age in Crest
According to the poverty statistics in Crest, males aged under 5 years and females aged under 5 years are the age groups that are most secure financially, with 100.0% of males and 100.0% of females in these age groups living above the poverty line.
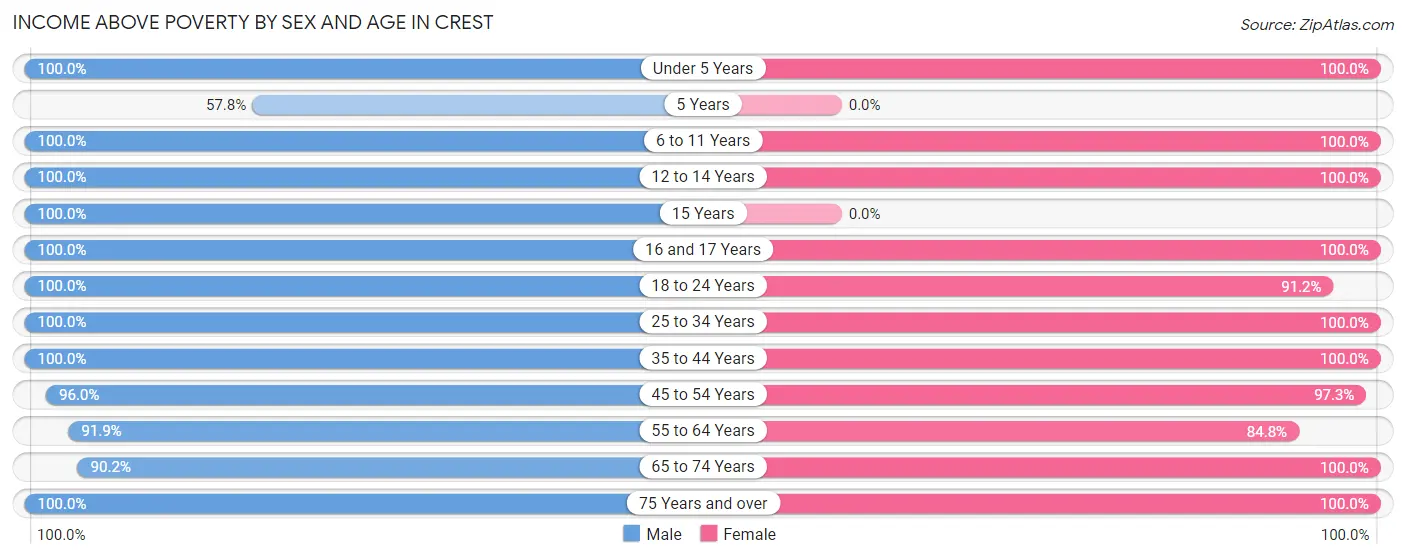
| Age Bracket | Male | Female |
| Under 5 Years | 83 (100.0%) | 47 (100.0%) |
| 5 Years | 26 (57.8%) | 0 (0.0%) |
| 6 to 11 Years | 87 (100.0%) | 126 (100.0%) |
| 12 to 14 Years | 26 (100.0%) | 55 (100.0%) |
| 15 Years | 17 (100.0%) | 0 (0.0%) |
| 16 and 17 Years | 7 (100.0%) | 51 (100.0%) |
| 18 to 24 Years | 174 (100.0%) | 229 (91.2%) |
| 25 to 34 Years | 140 (100.0%) | 114 (100.0%) |
| 35 to 44 Years | 144 (100.0%) | 237 (100.0%) |
| 45 to 54 Years | 144 (96.0%) | 146 (97.3%) |
| 55 to 64 Years | 271 (91.9%) | 291 (84.8%) |
| 65 to 74 Years | 119 (90.1%) | 131 (100.0%) |
| 75 Years and over | 161 (100.0%) | 153 (100.0%) |
| Total | 1,399 (95.8%) | 1,580 (95.3%) |
Income Below Poverty Among Married-Couple Families in Crest
The poverty statistics for married-couple families in Crest show that 1.9% or 13 of the total 692 families live below the poverty line. Families with no children have the highest poverty rate of 2.6%, comprising of 13 families. On the other hand, families with 1 or 2 children have the lowest poverty rate of 0.0%, which includes 0 families.
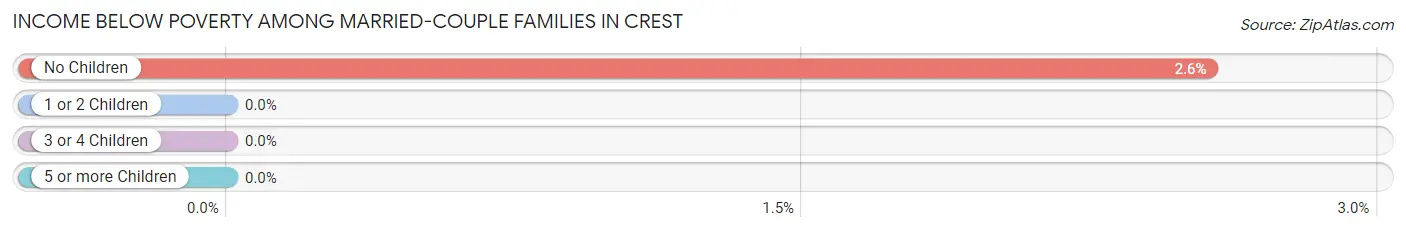
| Children | Above Poverty | Below Poverty |
| No Children | 495 (97.4%) | 13 (2.6%) |
| 1 or 2 Children | 117 (100.0%) | 0 (0.0%) |
| 3 or 4 Children | 67 (100.0%) | 0 (0.0%) |
| 5 or more Children | 0 (0.0%) | 0 (0.0%) |
| Total | 679 (98.1%) | 13 (1.9%) |
Income Below Poverty Among Single-Parent Households in Crest
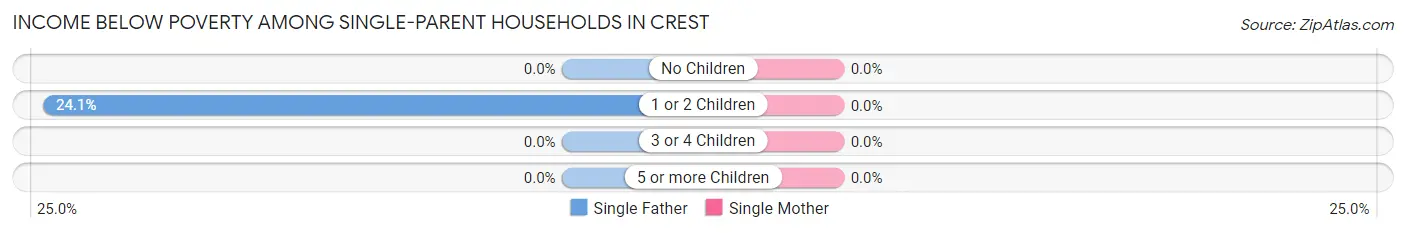
| Children | Single Father | Single Mother |
| No Children | 0 (0.0%) | 0 (0.0%) |
| 1 or 2 Children | 14 (24.1%) | 0 (0.0%) |
| 3 or 4 Children | 0 (0.0%) | 0 (0.0%) |
| 5 or more Children | 0 (0.0%) | 0 (0.0%) |
| Total | 14 (23.7%) | 0 (0.0%) |
Income Below Poverty Among Married-Couple vs Single-Parent Households in Crest
The poverty data for Crest shows that 13 of the married-couple family households (1.9%) and 14 of the single-parent households (8.4%) are living below the poverty level. Within the married-couple family households, those with no children have the highest poverty rate, with 13 households (2.6%) falling below the poverty line. Among the single-parent households, those with 1 or 2 children have the highest poverty rate, with 14 household (16.5%) living below poverty.
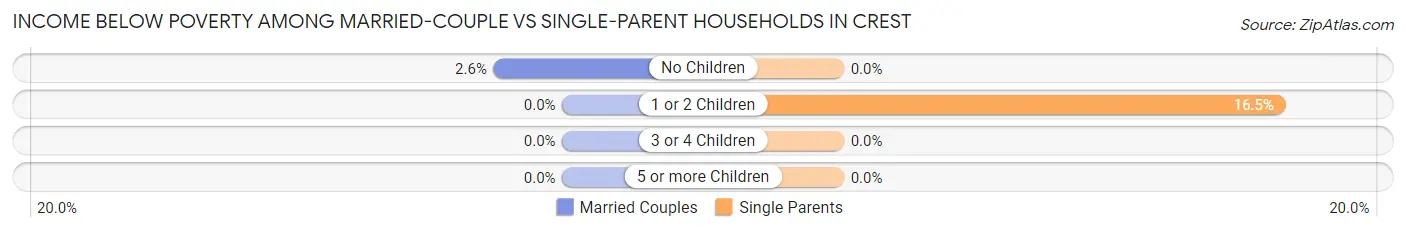
| Children | Married-Couple Families | Single-Parent Households |
| No Children | 13 (2.6%) | 0 (0.0%) |
| 1 or 2 Children | 0 (0.0%) | 14 (16.5%) |
| 3 or 4 Children | 0 (0.0%) | 0 (0.0%) |
| 5 or more Children | 0 (0.0%) | 0 (0.0%) |
| Total | 13 (1.9%) | 14 (8.4%) |
Race in Crest
The most populous races in Crest are White / Caucasian (2,231 | 70.2%), Hispanic or Latino (885 | 27.8%), and Two or more Races (625 | 19.7%).
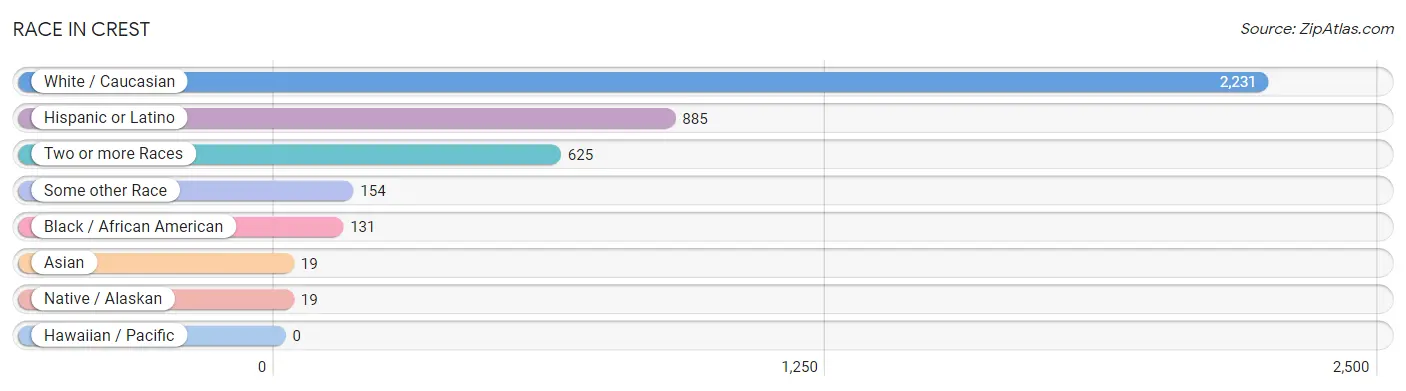
| Race | # Population | % Population |
| Asian | 19 | 0.6% |
| Black / African American | 131 | 4.1% |
| Hawaiian / Pacific | 0 | 0.0% |
| Hispanic or Latino | 885 | 27.8% |
| Native / Alaskan | 19 | 0.6% |
| White / Caucasian | 2,231 | 70.2% |
| Two or more Races | 625 | 19.7% |
| Some other Race | 154 | 4.8% |
| Total | 3,179 | 100.0% |
Ancestry in Crest
The most populous ancestries reported in Crest are Mexican (811 | 25.5%), German (537 | 16.9%), English (273 | 8.6%), Irish (221 | 7.0%), and European (207 | 6.5%), together accounting for 64.5% of all Crest residents.
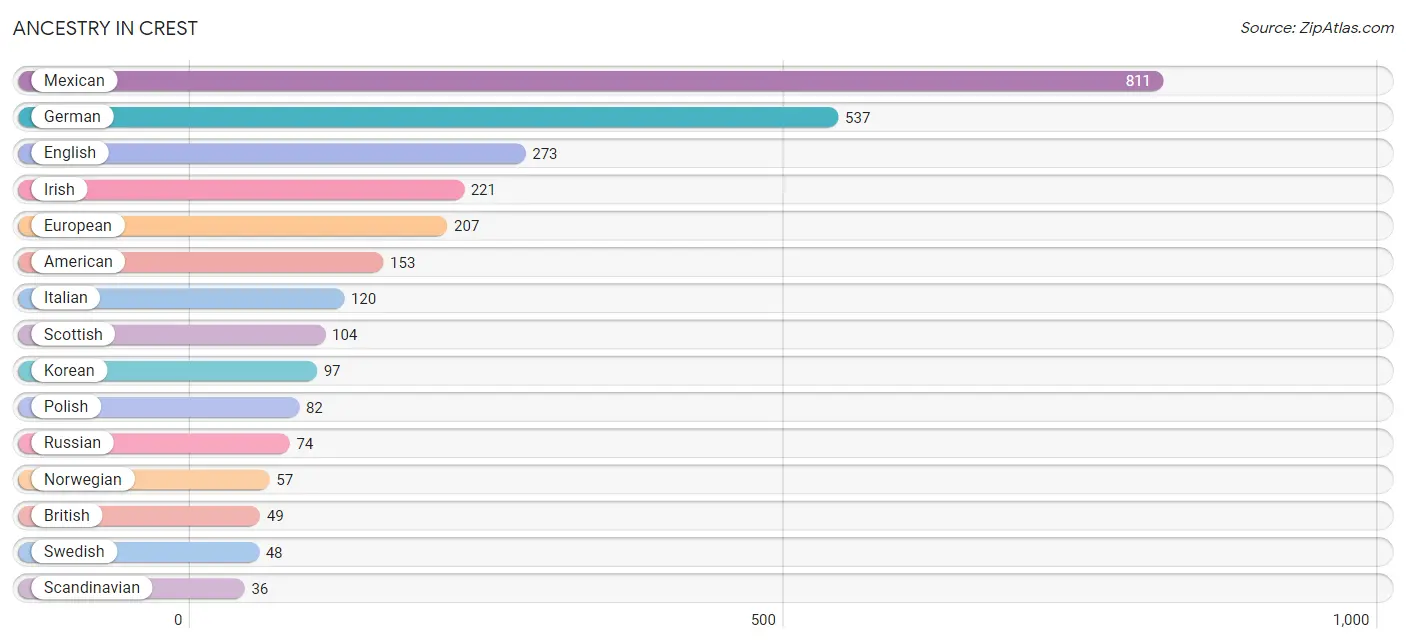
| Ancestry | # Population | % Population |
| American | 153 | 4.8% |
| Arab | 33 | 1.0% |
| Bhutanese | 27 | 0.9% |
| British | 49 | 1.5% |
| Central American | 34 | 1.1% |
| Cherokee | 31 | 1.0% |
| Chickasaw | 8 | 0.3% |
| Croatian | 9 | 0.3% |
| Danish | 25 | 0.8% |
| Dutch | 3 | 0.1% |
| English | 273 | 8.6% |
| European | 207 | 6.5% |
| Finnish | 11 | 0.4% |
| French | 14 | 0.4% |
| German | 537 | 16.9% |
| Greek | 3 | 0.1% |
| Honduran | 34 | 1.1% |
| Iraqi | 26 | 0.8% |
| Irish | 221 | 7.0% |
| Italian | 120 | 3.8% |
| Korean | 97 | 3.0% |
| Lebanese | 7 | 0.2% |
| Mexican | 811 | 25.5% |
| Native Hawaiian | 27 | 0.9% |
| Northern European | 22 | 0.7% |
| Norwegian | 57 | 1.8% |
| Pakistani | 26 | 0.8% |
| Peruvian | 5 | 0.2% |
| Polish | 82 | 2.6% |
| Portuguese | 14 | 0.4% |
| Puerto Rican | 29 | 0.9% |
| Russian | 74 | 2.3% |
| Scandinavian | 36 | 1.1% |
| Scotch-Irish | 11 | 0.4% |
| Scottish | 104 | 3.3% |
| South American | 5 | 0.2% |
| Spanish | 6 | 0.2% |
| Swedish | 48 | 1.5% |
| Swiss | 28 | 0.9% |
| Welsh | 24 | 0.7% |
| Yaqui | 19 | 0.6% | View All 41 Rows |
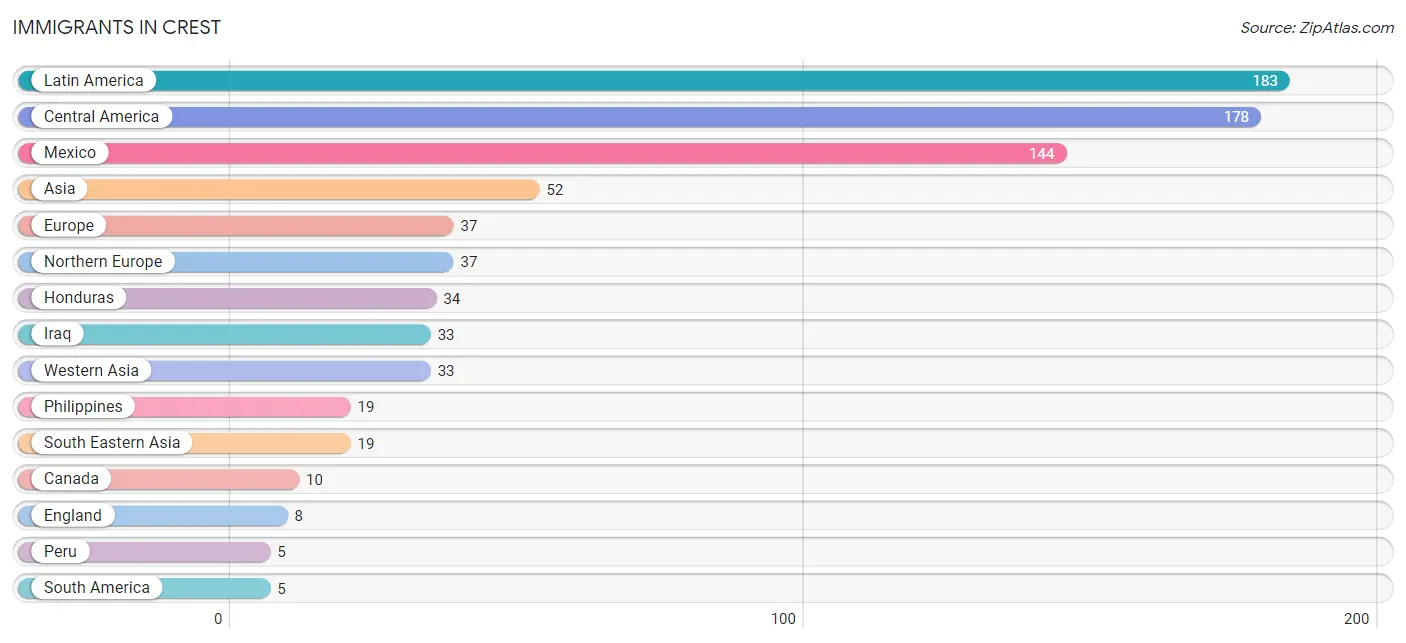
Immigrants in Crest
The most numerous immigrant groups reported in Crest came from Latin America (183 | 5.8%), Central America (178 | 5.6%), Mexico (144 | 4.5%), Asia (52 | 1.6%), and Europe (37 | 1.2%), together accounting for 18.7% of all Crest residents.
| Immigration Origin | # Population | % Population |
| Asia | 52 | 1.6% |
| Canada | 10 | 0.3% |
| Central America | 178 | 5.6% |
| England | 8 | 0.3% |
| Europe | 37 | 1.2% |
| Honduras | 34 | 1.1% |
| Iraq | 33 | 1.0% |
| Latin America | 183 | 5.8% |
| Mexico | 144 | 4.5% |
| Northern Europe | 37 | 1.2% |
| Peru | 5 | 0.2% |
| Philippines | 19 | 0.6% |
| South America | 5 | 0.2% |
| South Eastern Asia | 19 | 0.6% |
| Western Asia | 33 | 1.0% | View All 15 Rows |
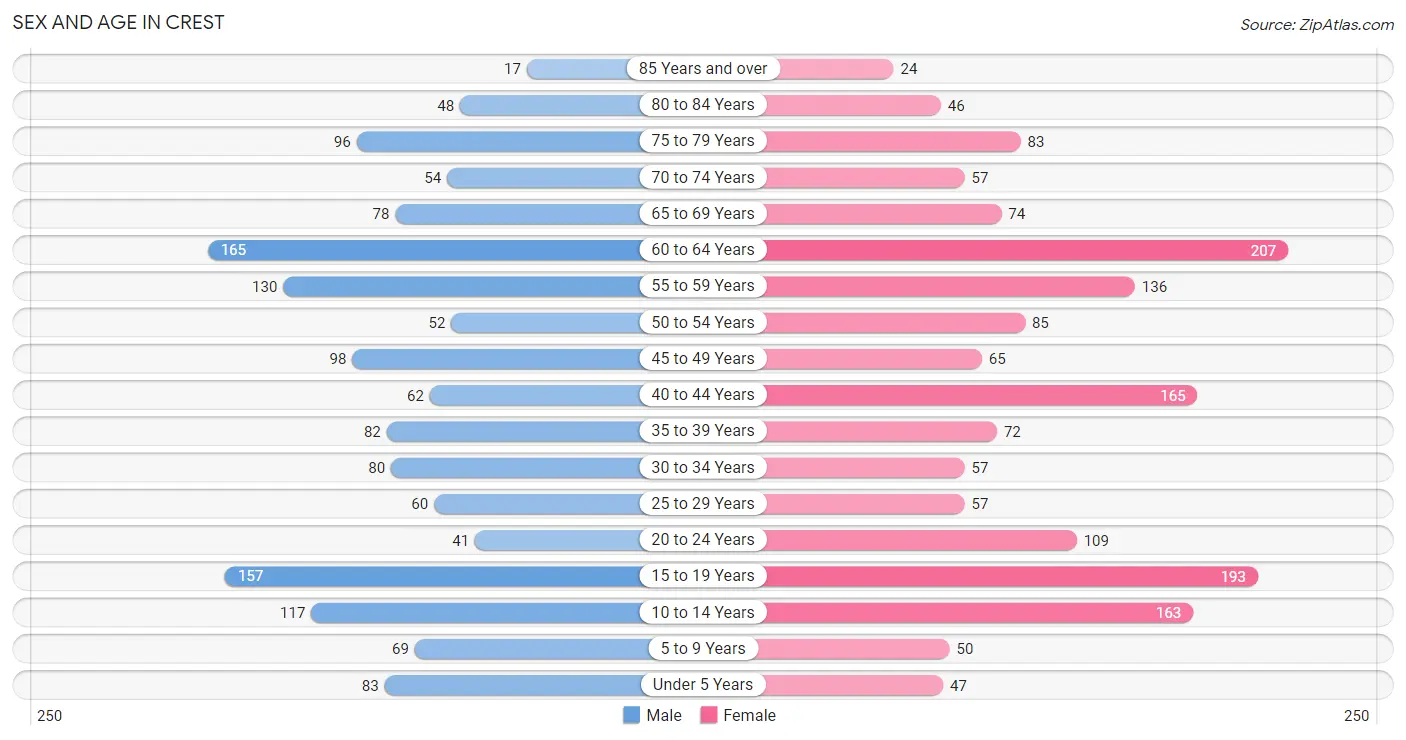
Sex and Age in Crest
Sex and Age in Crest
The most populous age groups in Crest are 60 to 64 Years (165 | 11.1%) for men and 60 to 64 Years (207 | 12.2%) for women.
| Age Bracket | Male | Female |
| Under 5 Years | 83 (5.6%) | 47 (2.8%) |
| 5 to 9 Years | 69 (4.6%) | 50 (3.0%) |
| 10 to 14 Years | 117 (7.9%) | 163 (9.6%) |
| 15 to 19 Years | 157 (10.5%) | 193 (11.4%) |
| 20 to 24 Years | 41 (2.8%) | 109 (6.5%) |
| 25 to 29 Years | 60 (4.0%) | 57 (3.4%) |
| 30 to 34 Years | 80 (5.4%) | 57 (3.4%) |
| 35 to 39 Years | 82 (5.5%) | 72 (4.3%) |
| 40 to 44 Years | 62 (4.2%) | 165 (9.8%) |
| 45 to 49 Years | 98 (6.6%) | 65 (3.8%) |
| 50 to 54 Years | 52 (3.5%) | 85 (5.0%) |
| 55 to 59 Years | 130 (8.7%) | 136 (8.1%) |
| 60 to 64 Years | 165 (11.1%) | 207 (12.2%) |
| 65 to 69 Years | 78 (5.2%) | 74 (4.4%) |
| 70 to 74 Years | 54 (3.6%) | 57 (3.4%) |
| 75 to 79 Years | 96 (6.5%) | 83 (4.9%) |
| 80 to 84 Years | 48 (3.2%) | 46 (2.7%) |
| 85 Years and over | 17 (1.1%) | 24 (1.4%) |
| Total | 1,489 (100.0%) | 1,690 (100.0%) |
Families and Households in Crest
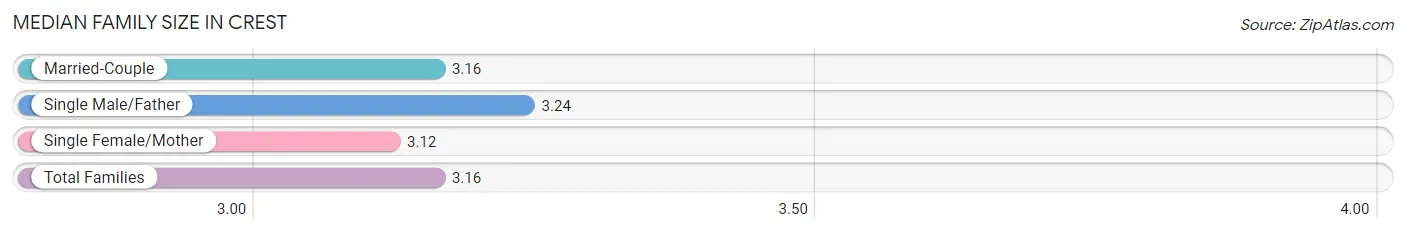
Median Family Size in Crest
The median family size in Crest is 3.16 persons per family, with single male/father families (59 | 6.9%) accounting for the largest median family size of 3.24 persons per family. On the other hand, single female/mother families (108 | 12.6%) represent the smallest median family size with 3.12 persons per family.
| Family Type | # Families | Family Size |
| Married-Couple | 692 (80.6%) | 3.16 |
| Single Male/Father | 59 (6.9%) | 3.24 |
| Single Female/Mother | 108 (12.6%) | 3.12 |
| Total Families | 859 (100.0%) | 3.16 |
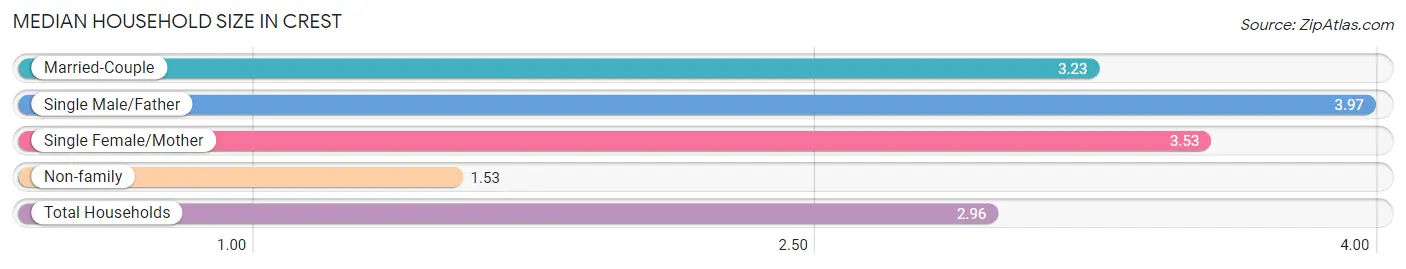
Median Household Size in Crest
The median household size in Crest is 2.96 persons per household, with single male/father households (59 | 5.5%) accounting for the largest median household size of 3.97 persons per household. non-family households (215 | 20.0%) represent the smallest median household size with 1.53 persons per household.
| Household Type | # Households | Household Size |
| Married-Couple | 692 (64.4%) | 3.23 |
| Single Male/Father | 59 (5.5%) | 3.97 |
| Single Female/Mother | 108 (10.1%) | 3.53 |
| Non-family | 215 (20.0%) | 1.53 |
| Total Households | 1,074 (100.0%) | 2.96 |
Household Size by Marriage Status in Crest
Out of a total of 1,074 households in Crest, 859 (80.0%) are family households, while 215 (20.0%) are nonfamily households. The most numerous type of family households are 2-person households, comprising 359, and the most common type of nonfamily households are 1-person households, comprising 175.
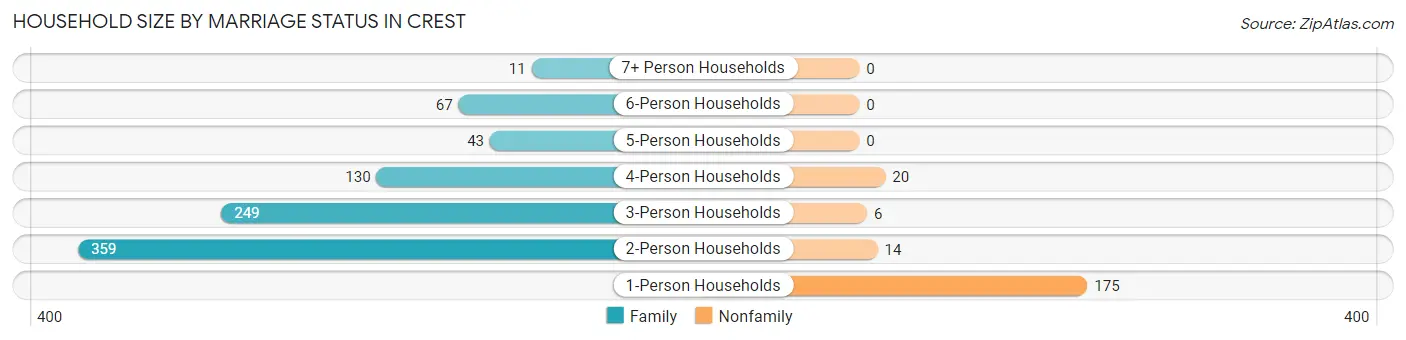
| Household Size | Family Households | Nonfamily Households |
| 1-Person Households | - | 175 (16.3%) |
| 2-Person Households | 359 (33.4%) | 14 (1.3%) |
| 3-Person Households | 249 (23.2%) | 6 (0.6%) |
| 4-Person Households | 130 (12.1%) | 20 (1.9%) |
| 5-Person Households | 43 (4.0%) | 0 (0.0%) |
| 6-Person Households | 67 (6.2%) | 0 (0.0%) |
| 7+ Person Households | 11 (1.0%) | 0 (0.0%) |
| Total | 859 (80.0%) | 215 (20.0%) |
Female Fertility in Crest
Fertility by Age in Crest
Average fertility rate in Crest is 14.0 births per 1,000 women. Women in the age bracket of 20 to 34 years have the highest fertility rate with 45.0 births per 1,000 women. Women in the age bracket of 20 to 34 years acount for 100.0% of all women with births.
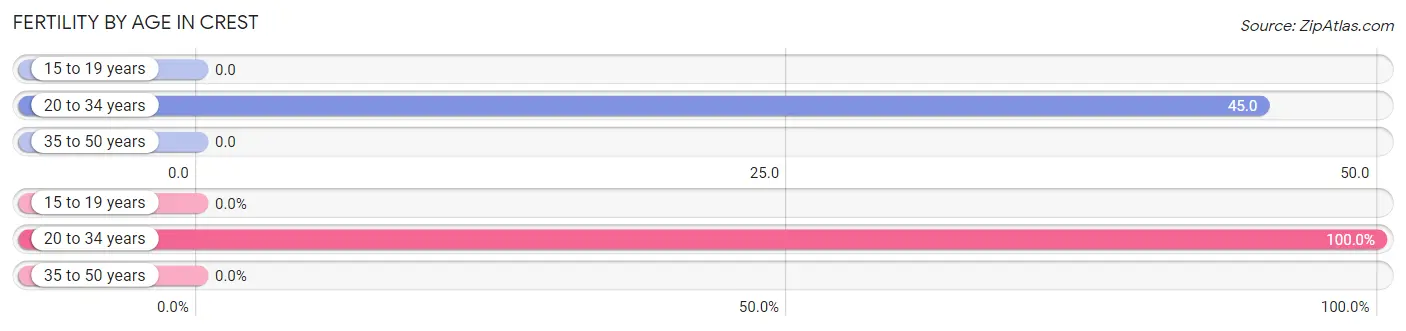
| Age Bracket | Women with Births | Births / 1,000 Women |
| 15 to 19 years | 0 (0.0%) | 0.0 |
| 20 to 34 years | 10 (100.0%) | 45.0 |
| 35 to 50 years | 0 (0.0%) | 0.0 |
| Total | 10 (100.0%) | 14.0 |
Fertility by Age by Marriage Status in Crest
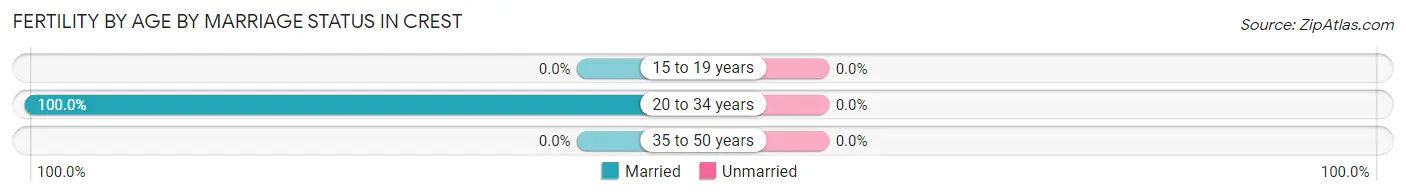
| Age Bracket | Married | Unmarried |
| 15 to 19 years | 0 (0.0%) | 0 (0.0%) |
| 20 to 34 years | 10 (100.0%) | 0 (0.0%) |
| 35 to 50 years | 0 (0.0%) | 0 (0.0%) |
| Total | 10 (100.0%) | 0 (0.0%) |
Fertility by Education in Crest
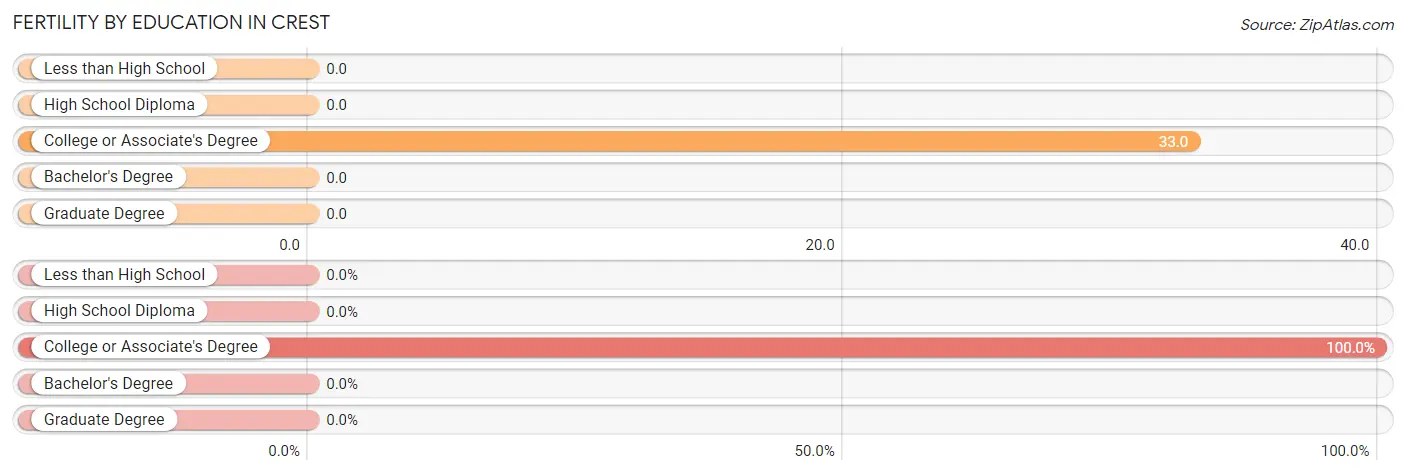
| Educational Attainment | Women with Births | Births / 1,000 Women |
| Less than High School | 0 (0.0%) | 0.0 |
| High School Diploma | 0 (0.0%) | 0.0 |
| College or Associate's Degree | 10 (100.0%) | 33.0 |
| Bachelor's Degree | 0 (0.0%) | 0.0 |
| Graduate Degree | 0 (0.0%) | 0.0 |
| Total | 10 (100.0%) | 14.0 |
Fertility by Education by Marriage Status in Crest
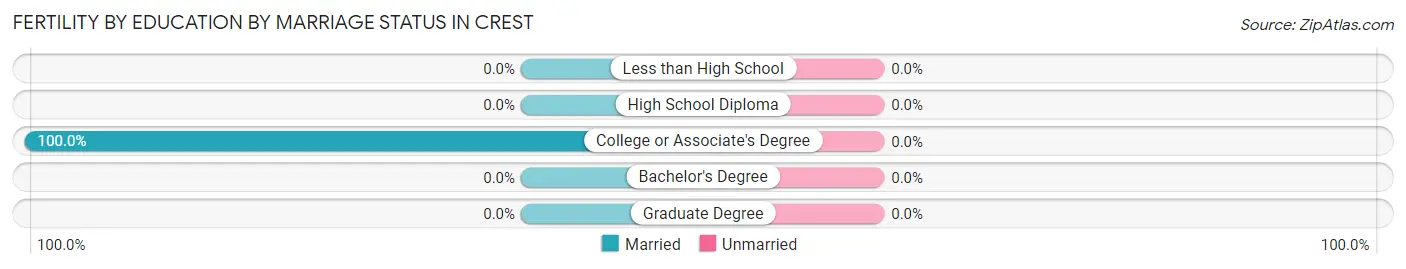
| Educational Attainment | Married | Unmarried |
| Less than High School | 0 (0.0%) | 0 (0.0%) |
| High School Diploma | 0 (0.0%) | 0 (0.0%) |
| College or Associate's Degree | 10 (100.0%) | 0 (0.0%) |
| Bachelor's Degree | 0 (0.0%) | 0 (0.0%) |
| Graduate Degree | 0 (0.0%) | 0 (0.0%) |
| Total | 10 (100.0%) | 0 (0.0%) |
Employment Characteristics in Crest
Employment by Class of Employer in Crest
Among the 1,230 employed individuals in Crest, private company employees (764 | 62.1%), not-for-profit organizations (136 | 11.1%), and local government employees (114 | 9.3%) make up the most common classes of employment.
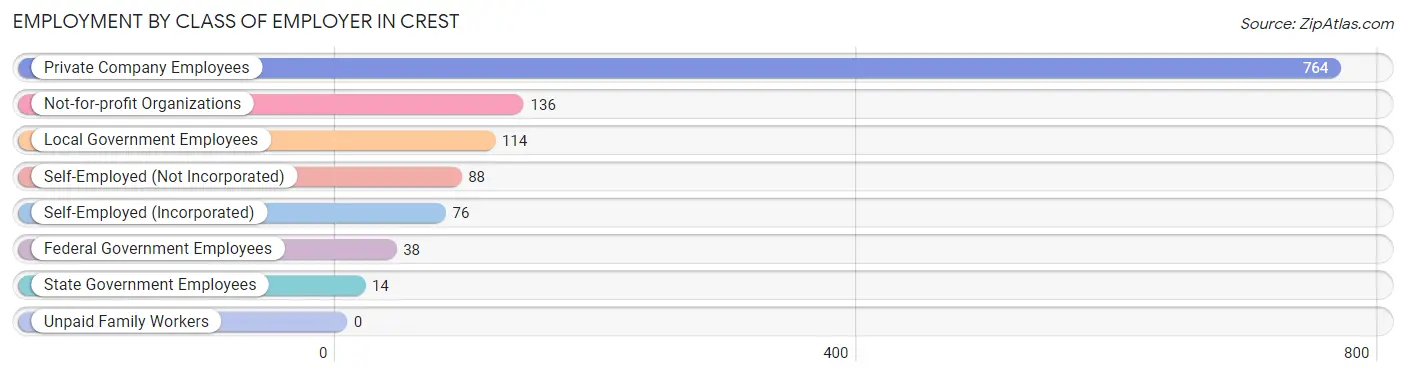
| Employer Class | # Employees | % Employees |
| Private Company Employees | 764 | 62.1% |
| Self-Employed (Incorporated) | 76 | 6.2% |
| Self-Employed (Not Incorporated) | 88 | 7.1% |
| Not-for-profit Organizations | 136 | 11.1% |
| Local Government Employees | 114 | 9.3% |
| State Government Employees | 14 | 1.1% |
| Federal Government Employees | 38 | 3.1% |
| Unpaid Family Workers | 0 | 0.0% |
| Total | 1,230 | 100.0% |
Employment Status by Age in Crest
According to the labor force statistics for Crest, out of the total population over 16 years of age (2,633), 49.9% or 1,314 individuals are in the labor force, with 5.4% or 71 of them unemployed. The age group with the highest labor force participation rate is 45 to 54 years, with 88.3% or 265 individuals in the labor force. Within the labor force, the 30 to 34 years age range has the highest percentage of unemployed individuals, with 21.3% or 16 of them being unemployed.
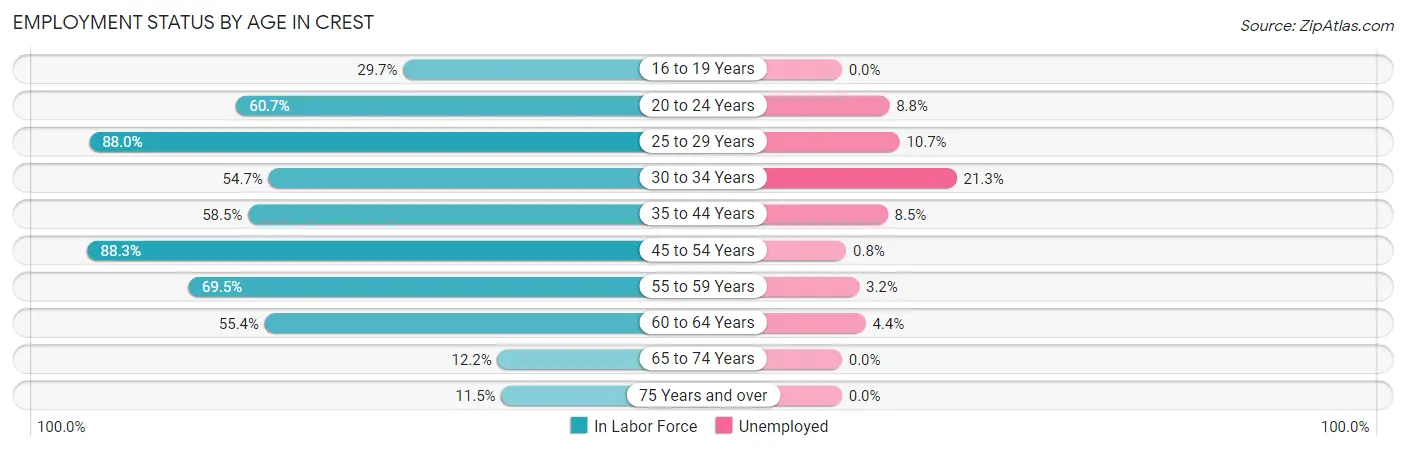
| Age Bracket | In Labor Force | Unemployed |
| 16 to 19 Years | 99 (29.7%) | 0 (0.0%) |
| 20 to 24 Years | 91 (60.7%) | 8 (8.8%) |
| 25 to 29 Years | 103 (88.0%) | 11 (10.7%) |
| 30 to 34 Years | 75 (54.7%) | 16 (21.3%) |
| 35 to 44 Years | 223 (58.5%) | 19 (8.5%) |
| 45 to 54 Years | 265 (88.3%) | 2 (0.8%) |
| 55 to 59 Years | 185 (69.5%) | 6 (3.2%) |
| 60 to 64 Years | 206 (55.4%) | 9 (4.4%) |
| 65 to 74 Years | 32 (12.2%) | 0 (0.0%) |
| 75 Years and over | 36 (11.5%) | 0 (0.0%) |
| Total | 1,314 (49.9%) | 71 (5.4%) |
Employment Status by Educational Attainment in Crest
According to labor force statistics for Crest, 67.2% of individuals (1,057) out of the total population between 25 and 64 years of age (1,573) are in the labor force, with 6.0% or 63 of them being unemployed. The group with the highest labor force participation rate are those with the educational attainment of bachelor's degree or higher, with 80.1% or 371 individuals in the labor force. Within the labor force, individuals with bachelor's degree or higher education have the highest percentage of unemployment, with 6.7% or 25 of them being unemployed.
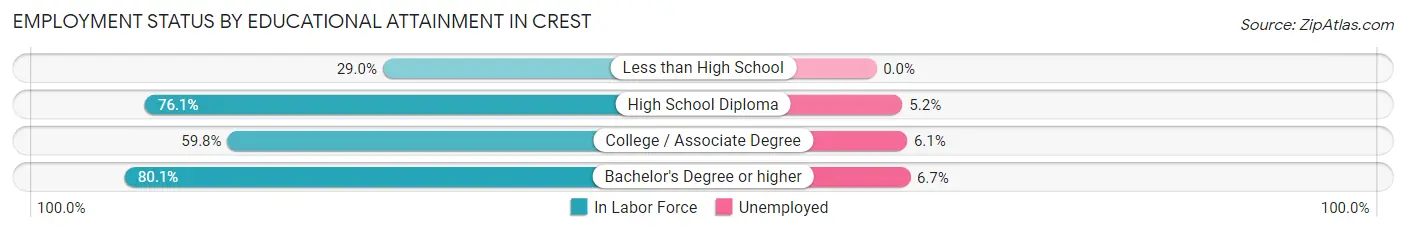
| Educational Attainment | In Labor Force | Unemployed |
| Less than High School | 29 (29.0%) | 0 (0.0%) |
| High School Diploma | 248 (76.1%) | 17 (5.2%) |
| College / Associate Degree | 409 (59.8%) | 42 (6.1%) |
| Bachelor's Degree or higher | 371 (80.1%) | 31 (6.7%) |
| Total | 1,057 (67.2%) | 94 (6.0%) |
Employment Occupations by Sex in Crest
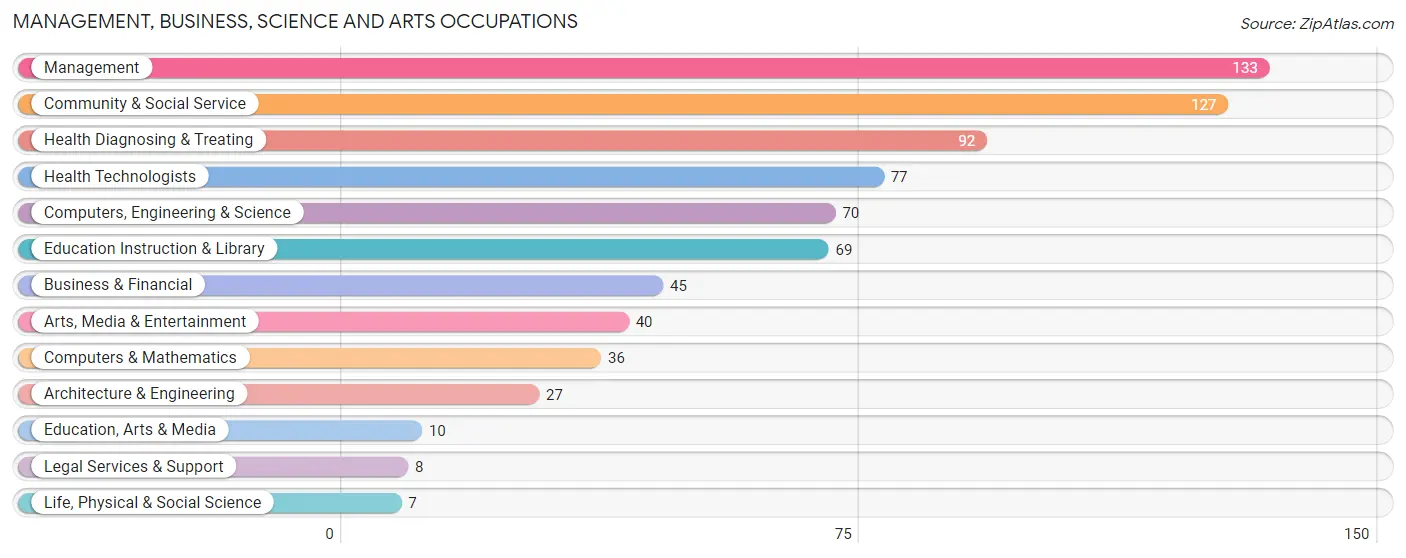
Management, Business, Science and Arts Occupations
The most common Management, Business, Science and Arts occupations in Crest are Management (133 | 10.7%), Community & Social Service (127 | 10.2%), Health Diagnosing & Treating (92 | 7.4%), Health Technologists (77 | 6.2%), and Computers, Engineering & Science (70 | 5.6%).
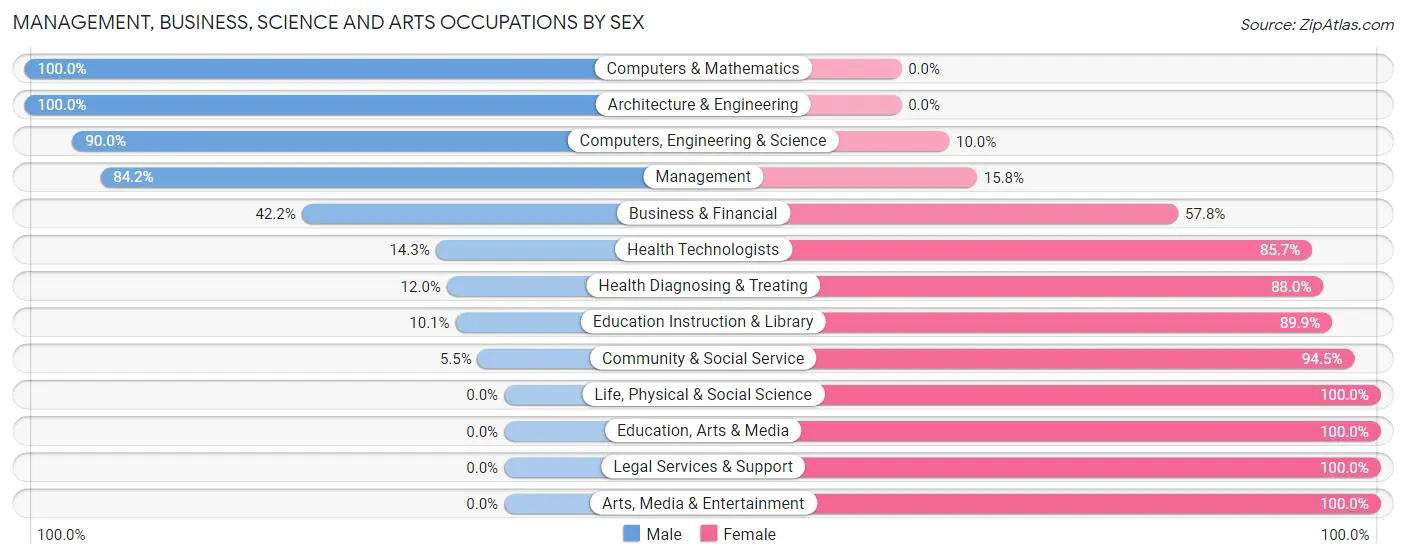
Management, Business, Science and Arts Occupations by Sex
Within the Management, Business, Science and Arts occupations in Crest, the most male-oriented occupations are Computers & Mathematics (100.0%), Architecture & Engineering (100.0%), and Computers, Engineering & Science (90.0%), while the most female-oriented occupations are Life, Physical & Social Science (100.0%), Education, Arts & Media (100.0%), and Legal Services & Support (100.0%).
| Occupation | Male | Female |
| Management | 112 (84.2%) | 21 (15.8%) |
| Business & Financial | 19 (42.2%) | 26 (57.8%) |
| Computers, Engineering & Science | 63 (90.0%) | 7 (10.0%) |
| Computers & Mathematics | 36 (100.0%) | 0 (0.0%) |
| Architecture & Engineering | 27 (100.0%) | 0 (0.0%) |
| Life, Physical & Social Science | 0 (0.0%) | 7 (100.0%) |
| Community & Social Service | 7 (5.5%) | 120 (94.5%) |
| Education, Arts & Media | 0 (0.0%) | 10 (100.0%) |
| Legal Services & Support | 0 (0.0%) | 8 (100.0%) |
| Education Instruction & Library | 7 (10.1%) | 62 (89.9%) |
| Arts, Media & Entertainment | 0 (0.0%) | 40 (100.0%) |
| Health Diagnosing & Treating | 11 (12.0%) | 81 (88.0%) |
| Health Technologists | 11 (14.3%) | 66 (85.7%) |
| Total (Category) | 212 (45.4%) | 255 (54.6%) |
| Total (Overall) | 686 (55.1%) | 558 (44.9%) |
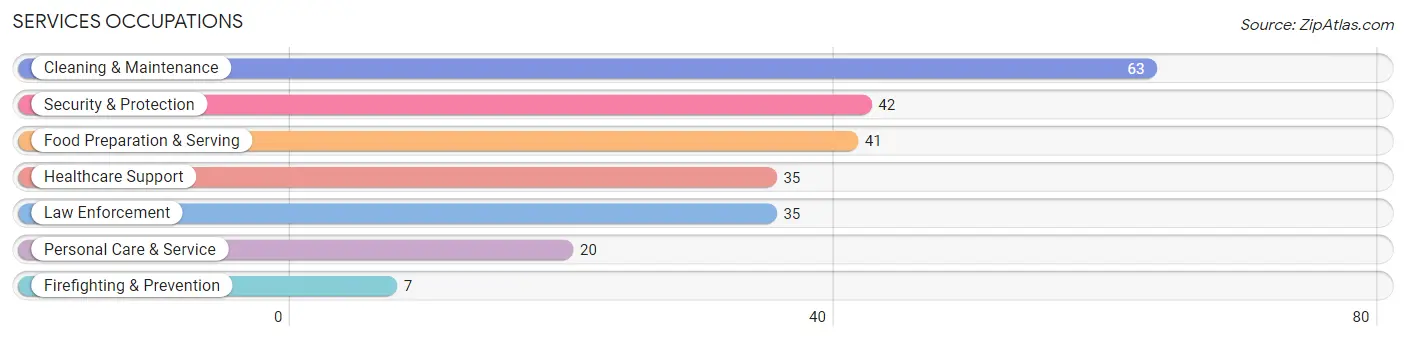
Services Occupations
The most common Services occupations in Crest are Cleaning & Maintenance (63 | 5.1%), Security & Protection (42 | 3.4%), Food Preparation & Serving (41 | 3.3%), Healthcare Support (35 | 2.8%), and Law Enforcement (35 | 2.8%).
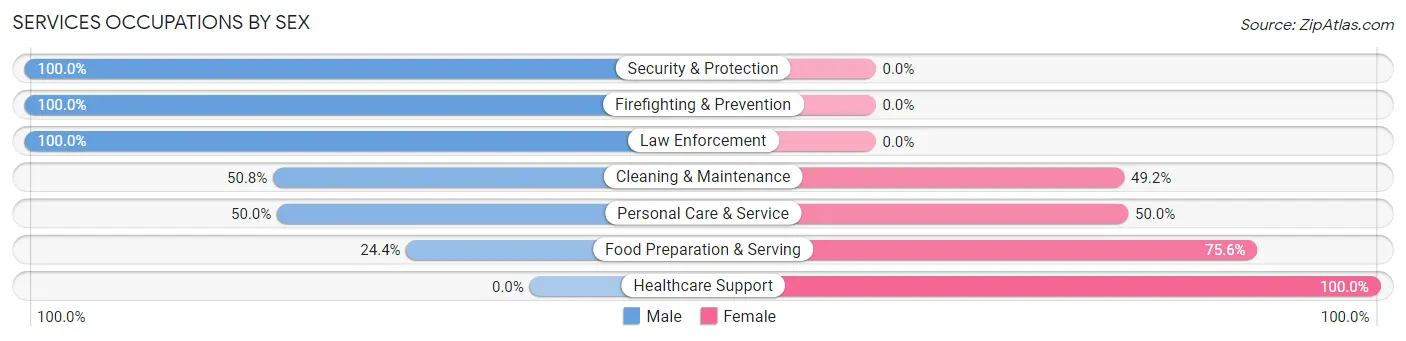
Services Occupations by Sex
Within the Services occupations in Crest, the most male-oriented occupations are Security & Protection (100.0%), Firefighting & Prevention (100.0%), and Law Enforcement (100.0%), while the most female-oriented occupations are Healthcare Support (100.0%), Food Preparation & Serving (75.6%), and Personal Care & Service (50.0%).
| Occupation | Male | Female |
| Healthcare Support | 0 (0.0%) | 35 (100.0%) |
| Security & Protection | 42 (100.0%) | 0 (0.0%) |
| Firefighting & Prevention | 7 (100.0%) | 0 (0.0%) |
| Law Enforcement | 35 (100.0%) | 0 (0.0%) |
| Food Preparation & Serving | 10 (24.4%) | 31 (75.6%) |
| Cleaning & Maintenance | 32 (50.8%) | 31 (49.2%) |
| Personal Care & Service | 10 (50.0%) | 10 (50.0%) |
| Total (Category) | 94 (46.8%) | 107 (53.2%) |
| Total (Overall) | 686 (55.1%) | 558 (44.9%) |
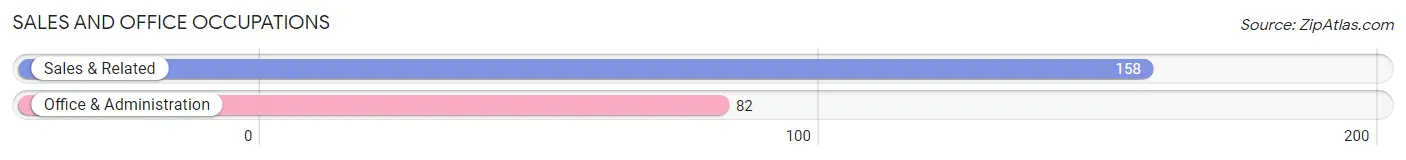
Sales and Office Occupations
The most common Sales and Office occupations in Crest are Sales & Related (158 | 12.7%), and Office & Administration (82 | 6.6%).
Sales and Office Occupations by Sex
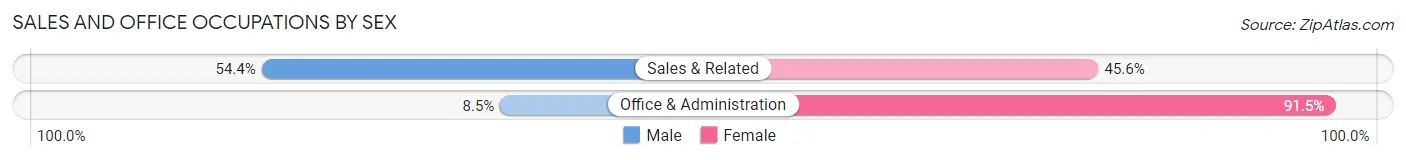
| Occupation | Male | Female |
| Sales & Related | 86 (54.4%) | 72 (45.6%) |
| Office & Administration | 7 (8.5%) | 75 (91.5%) |
| Total (Category) | 93 (38.8%) | 147 (61.3%) |
| Total (Overall) | 686 (55.1%) | 558 (44.9%) |
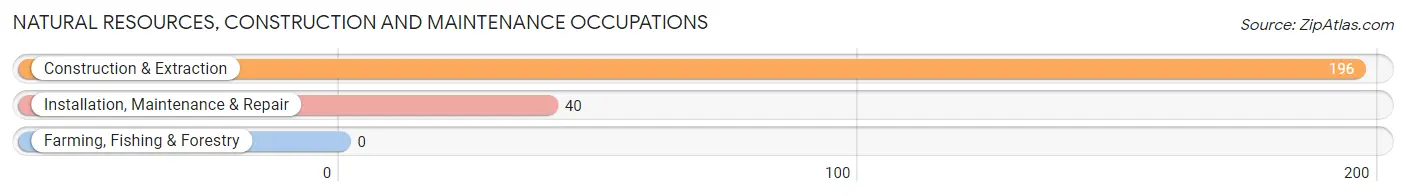
Natural Resources, Construction and Maintenance Occupations
The most common Natural Resources, Construction and Maintenance occupations in Crest are Construction & Extraction (196 | 15.8%), and Installation, Maintenance & Repair (40 | 3.2%).
Natural Resources, Construction and Maintenance Occupations by Sex
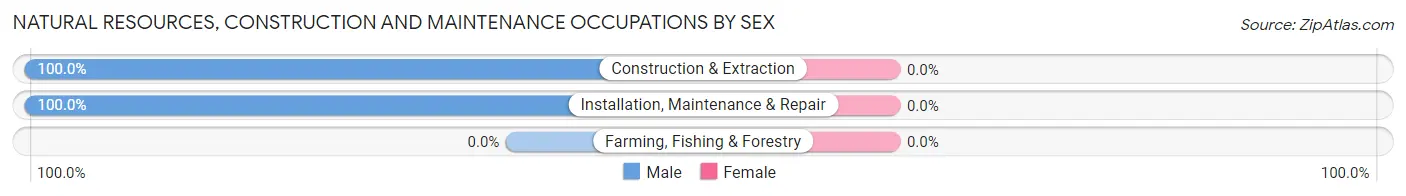
| Occupation | Male | Female |
| Farming, Fishing & Forestry | 0 (0.0%) | 0 (0.0%) |
| Construction & Extraction | 196 (100.0%) | 0 (0.0%) |
| Installation, Maintenance & Repair | 40 (100.0%) | 0 (0.0%) |
| Total (Category) | 236 (100.0%) | 0 (0.0%) |
| Total (Overall) | 686 (55.1%) | 558 (44.9%) |
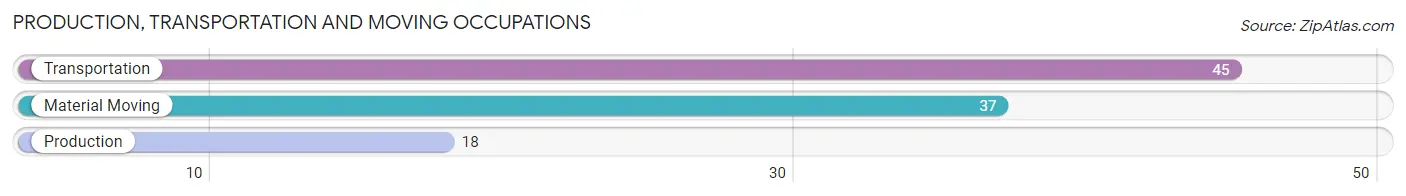
Production, Transportation and Moving Occupations
The most common Production, Transportation and Moving occupations in Crest are Transportation (45 | 3.6%), Material Moving (37 | 3.0%), and Production (18 | 1.5%).
Production, Transportation and Moving Occupations by Sex
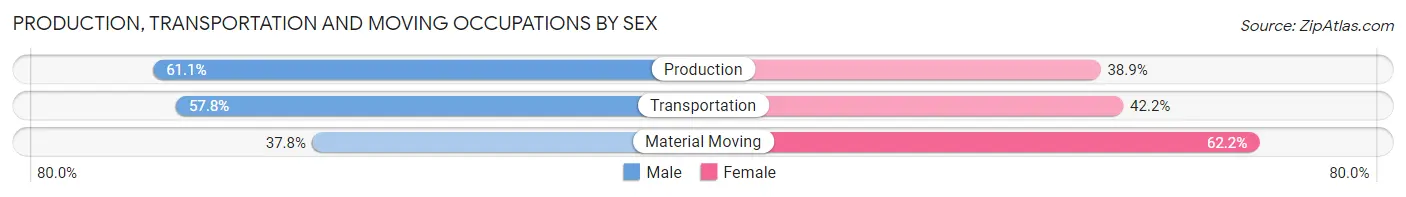
| Occupation | Male | Female |
| Production | 11 (61.1%) | 7 (38.9%) |
| Transportation | 26 (57.8%) | 19 (42.2%) |
| Material Moving | 14 (37.8%) | 23 (62.2%) |
| Total (Category) | 51 (51.0%) | 49 (49.0%) |
| Total (Overall) | 686 (55.1%) | 558 (44.9%) |
Employment Industries by Sex in Crest
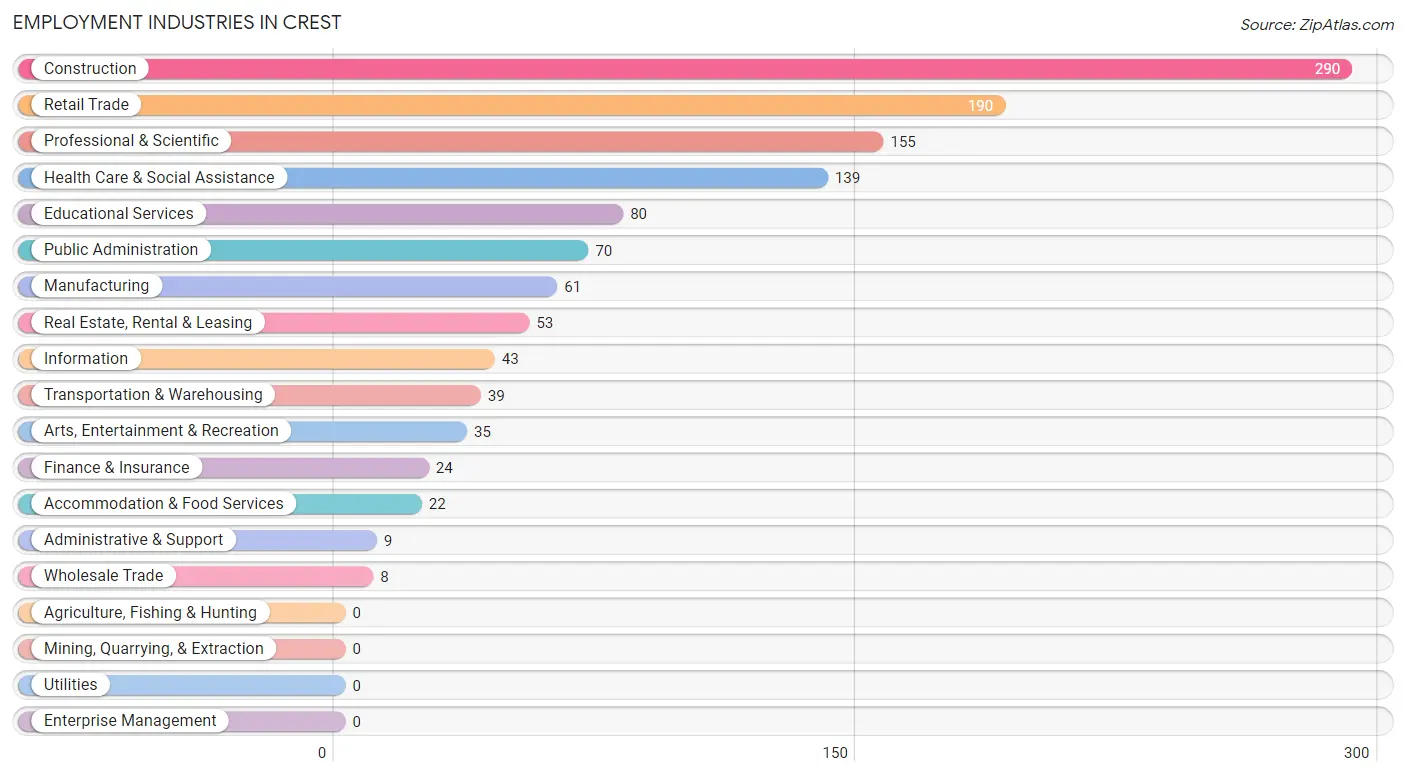
Employment Industries in Crest
The major employment industries in Crest include Construction (290 | 23.3%), Retail Trade (190 | 15.3%), Professional & Scientific (155 | 12.5%), Health Care & Social Assistance (139 | 11.2%), and Educational Services (80 | 6.4%).
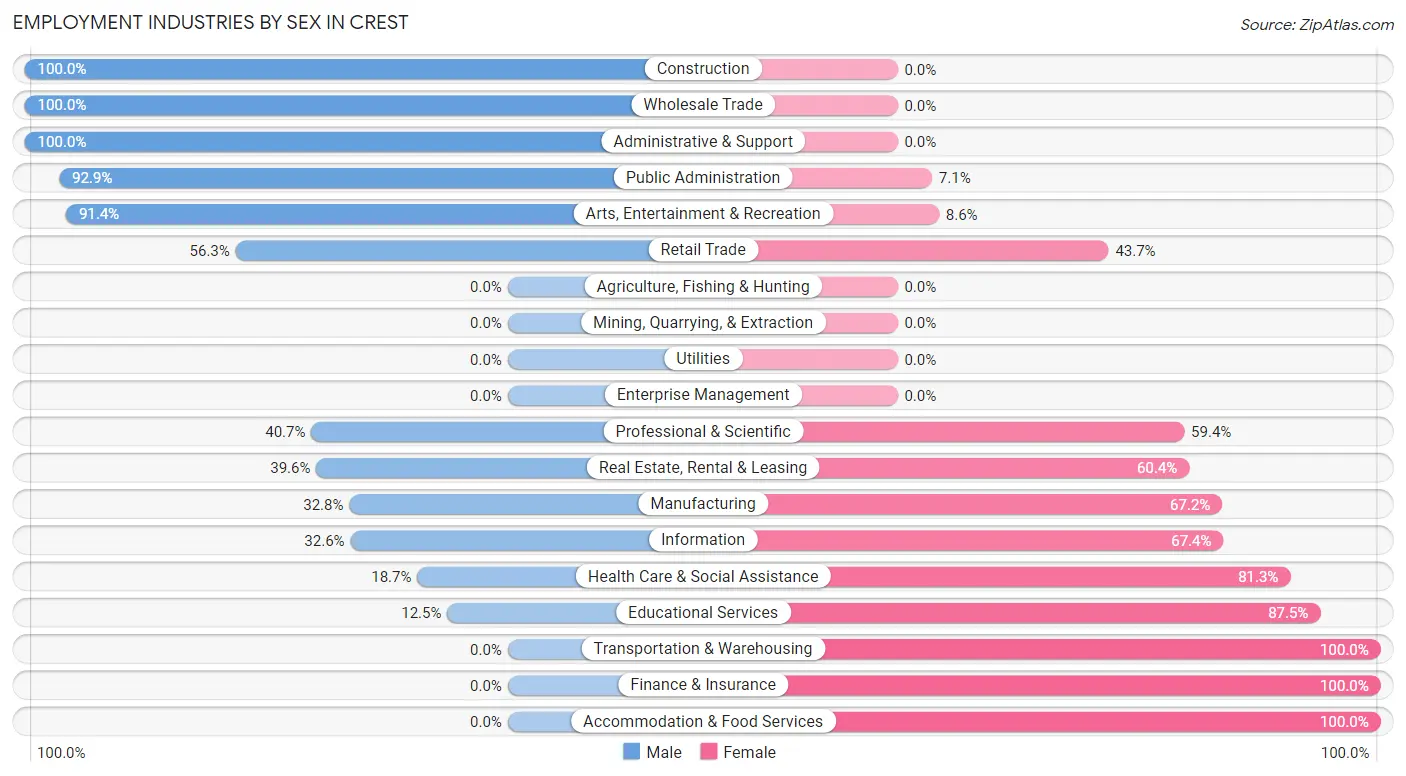
Employment Industries by Sex in Crest
The Crest industries that see more men than women are Construction (100.0%), Wholesale Trade (100.0%), and Administrative & Support (100.0%), whereas the industries that tend to have a higher number of women are Transportation & Warehousing (100.0%), Finance & Insurance (100.0%), and Accommodation & Food Services (100.0%).
| Industry | Male | Female |
| Agriculture, Fishing & Hunting | 0 (0.0%) | 0 (0.0%) |
| Mining, Quarrying, & Extraction | 0 (0.0%) | 0 (0.0%) |
| Construction | 290 (100.0%) | 0 (0.0%) |
| Manufacturing | 20 (32.8%) | 41 (67.2%) |
| Wholesale Trade | 8 (100.0%) | 0 (0.0%) |
| Retail Trade | 107 (56.3%) | 83 (43.7%) |
| Transportation & Warehousing | 0 (0.0%) | 39 (100.0%) |
| Utilities | 0 (0.0%) | 0 (0.0%) |
| Information | 14 (32.6%) | 29 (67.4%) |
| Finance & Insurance | 0 (0.0%) | 24 (100.0%) |
| Real Estate, Rental & Leasing | 21 (39.6%) | 32 (60.4%) |
| Professional & Scientific | 63 (40.6%) | 92 (59.4%) |
| Enterprise Management | 0 (0.0%) | 0 (0.0%) |
| Administrative & Support | 9 (100.0%) | 0 (0.0%) |
| Educational Services | 10 (12.5%) | 70 (87.5%) |
| Health Care & Social Assistance | 26 (18.7%) | 113 (81.3%) |
| Arts, Entertainment & Recreation | 32 (91.4%) | 3 (8.6%) |
| Accommodation & Food Services | 0 (0.0%) | 22 (100.0%) |
| Public Administration | 65 (92.9%) | 5 (7.1%) |
| Total | 686 (55.1%) | 558 (44.9%) |
Education in Crest
School Enrollment in Crest
The most common levels of schooling among the 790 students in Crest are middle school (246 | 31.1%), college / undergraduate (178 | 22.5%), and high school (163 | 20.6%).
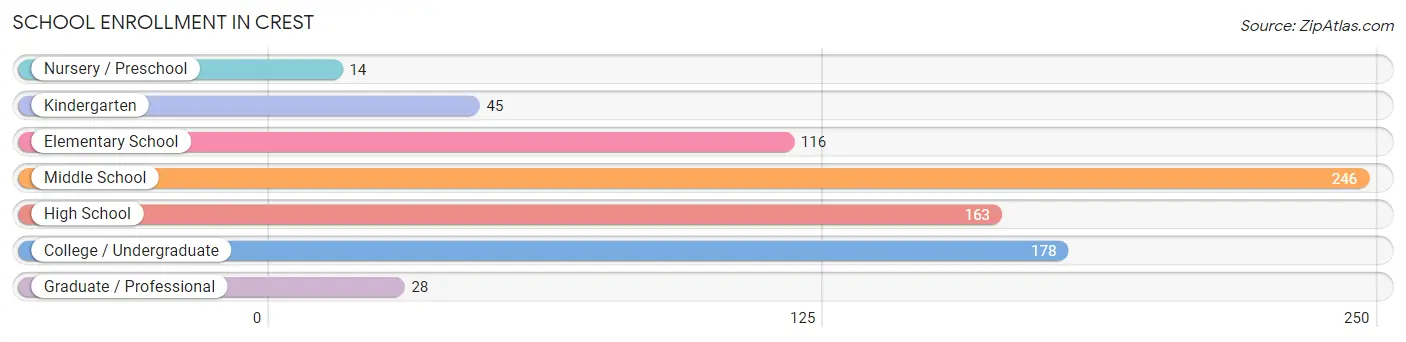
| School Level | # Students | % Students |
| Nursery / Preschool | 14 | 1.8% |
| Kindergarten | 45 | 5.7% |
| Elementary School | 116 | 14.7% |
| Middle School | 246 | 31.1% |
| High School | 163 | 20.6% |
| College / Undergraduate | 178 | 22.5% |
| Graduate / Professional | 28 | 3.5% |
| Total | 790 | 100.0% |
School Enrollment by Age by Funding Source in Crest
Out of a total of 790 students who are enrolled in schools in Crest, 108 (13.7%) attend a private institution, while the remaining 682 (86.3%) are enrolled in public schools. The age group of 3 to 4 year olds has the highest likelihood of being enrolled in private schools, with 14 (100.0% in the age bracket) enrolled. Conversely, the age group of 5 to 9 year old has the lowest likelihood of being enrolled in a private school, with 116 (97.5% in the age bracket) attending a public institution.
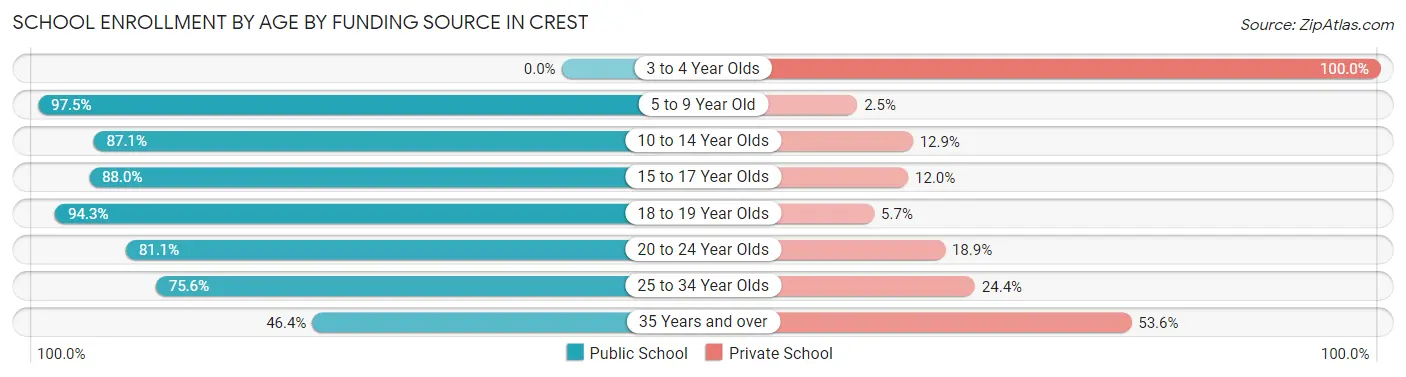
| Age Bracket | Public School | Private School |
| 3 to 4 Year Olds | 0 (0.0%) | 14 (100.0%) |
| 5 to 9 Year Old | 116 (97.5%) | 3 (2.5%) |
| 10 to 14 Year Olds | 244 (87.1%) | 36 (12.9%) |
| 15 to 17 Year Olds | 66 (88.0%) | 9 (12.0%) |
| 18 to 19 Year Olds | 166 (94.3%) | 10 (5.7%) |
| 20 to 24 Year Olds | 43 (81.1%) | 10 (18.9%) |
| 25 to 34 Year Olds | 34 (75.6%) | 11 (24.4%) |
| 35 Years and over | 13 (46.4%) | 15 (53.6%) |
| Total | 682 (86.3%) | 108 (13.7%) |
Educational Attainment by Field of Study in Crest
Education (119 | 17.6%), science & technology (96 | 14.2%), business (84 | 12.4%), computers & mathematics (63 | 9.3%), and liberal arts & history (55 | 8.1%) are the most common fields of study among 677 individuals in Crest who have obtained a bachelor's degree or higher.
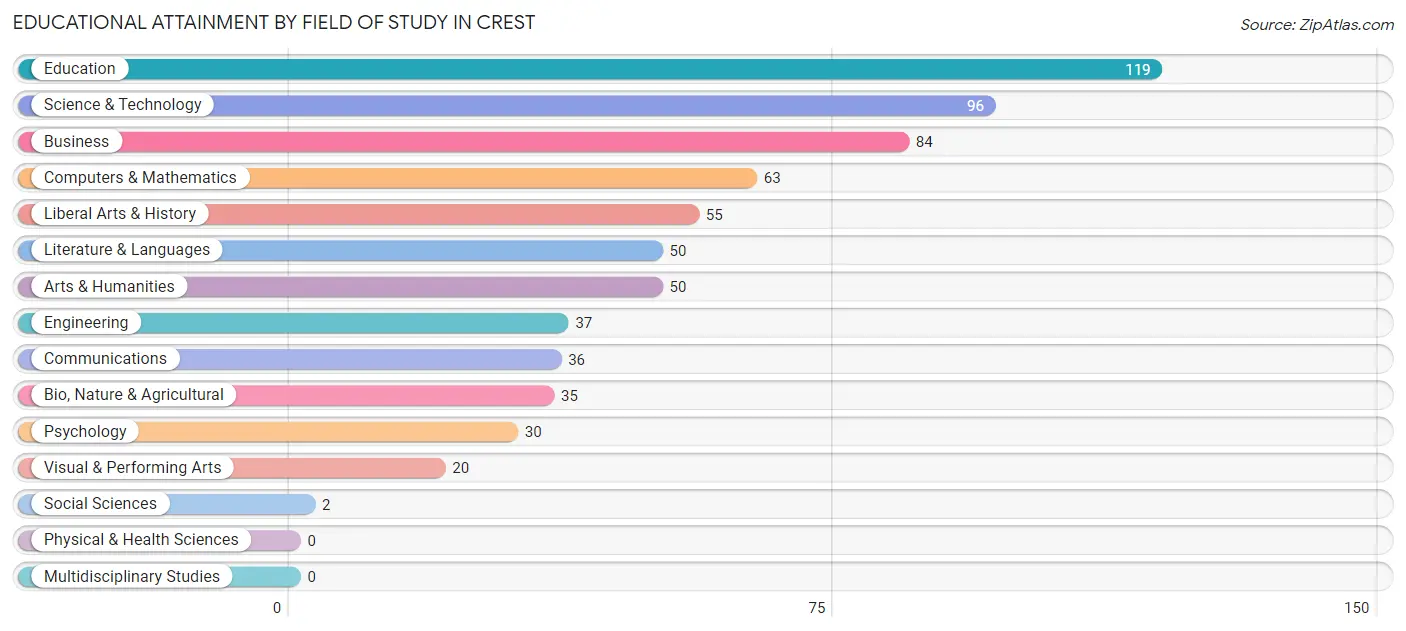
| Field of Study | # Graduates | % Graduates |
| Computers & Mathematics | 63 | 9.3% |
| Bio, Nature & Agricultural | 35 | 5.2% |
| Physical & Health Sciences | 0 | 0.0% |
| Psychology | 30 | 4.4% |
| Social Sciences | 2 | 0.3% |
| Engineering | 37 | 5.5% |
| Multidisciplinary Studies | 0 | 0.0% |
| Science & Technology | 96 | 14.2% |
| Business | 84 | 12.4% |
| Education | 119 | 17.6% |
| Literature & Languages | 50 | 7.4% |
| Liberal Arts & History | 55 | 8.1% |
| Visual & Performing Arts | 20 | 2.9% |
| Communications | 36 | 5.3% |
| Arts & Humanities | 50 | 7.4% |
| Total | 677 | 100.0% |
Transportation & Commute in Crest
Vehicle Availability by Sex in Crest
The most prevalent vehicle ownership categories in Crest are males with 3 vehicles (266, accounting for 39.6%) and females with 3 vehicles (156, making up 47.7%).
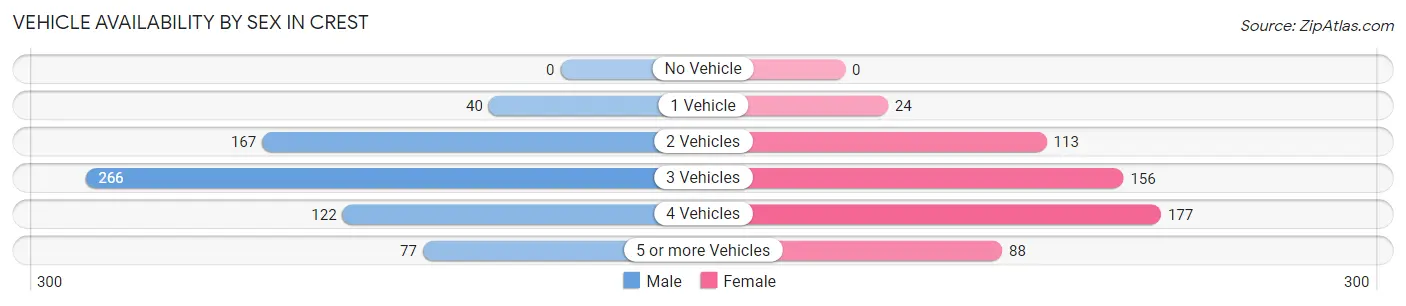
| Vehicles Available | Male | Female |
| No Vehicle | 0 (0.0%) | 0 (0.0%) |
| 1 Vehicle | 40 (5.9%) | 24 (4.3%) |
| 2 Vehicles | 167 (24.8%) | 113 (20.3%) |
| 3 Vehicles | 266 (39.6%) | 156 (28.0%) |
| 4 Vehicles | 122 (18.1%) | 177 (31.7%) |
| 5 or more Vehicles | 77 (11.5%) | 88 (15.8%) |
| Total | 672 (100.0%) | 558 (100.0%) |
Commute Time in Crest
The most frequently occuring commute durations in Crest are 20 to 24 minutes (205 commuters, 17.4%), 30 to 34 minutes (193 commuters, 16.4%), and 15 to 19 minutes (177 commuters, 15.0%).
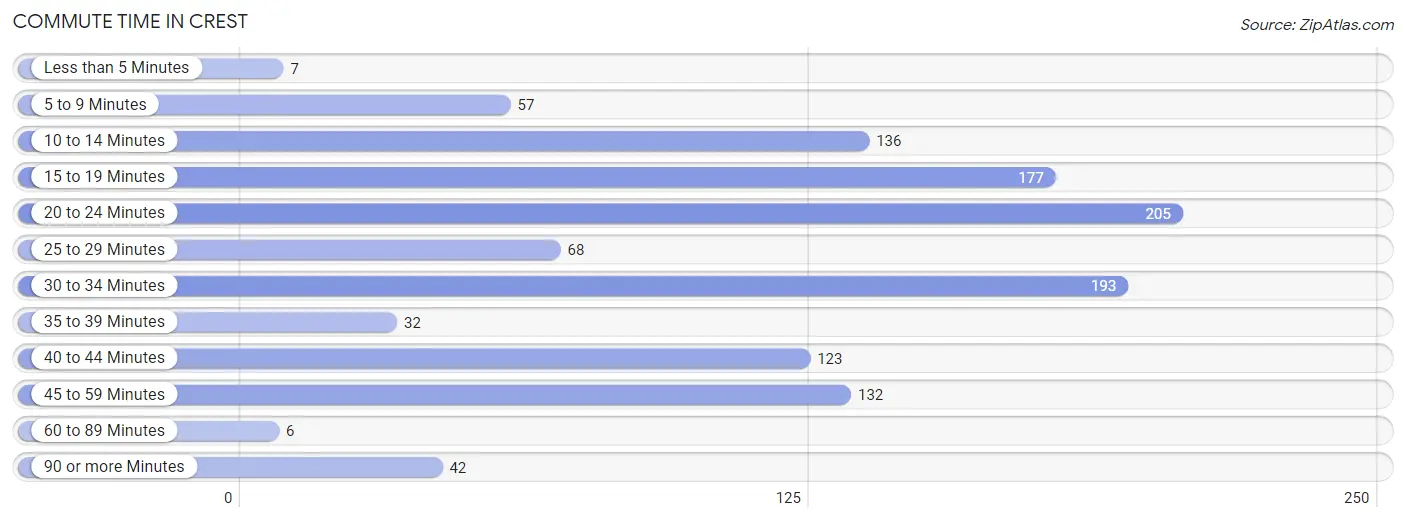
| Commute Time | # Commuters | % Commuters |
| Less than 5 Minutes | 7 | 0.6% |
| 5 to 9 Minutes | 57 | 4.8% |
| 10 to 14 Minutes | 136 | 11.5% |
| 15 to 19 Minutes | 177 | 15.0% |
| 20 to 24 Minutes | 205 | 17.4% |
| 25 to 29 Minutes | 68 | 5.8% |
| 30 to 34 Minutes | 193 | 16.4% |
| 35 to 39 Minutes | 32 | 2.7% |
| 40 to 44 Minutes | 123 | 10.4% |
| 45 to 59 Minutes | 132 | 11.2% |
| 60 to 89 Minutes | 6 | 0.5% |
| 90 or more Minutes | 42 | 3.6% |
Commute Time by Sex in Crest
The most common commute times in Crest are 40 to 44 minutes (115 commuters, 17.4%) for males and 20 to 24 minutes (116 commuters, 22.5%) for females.
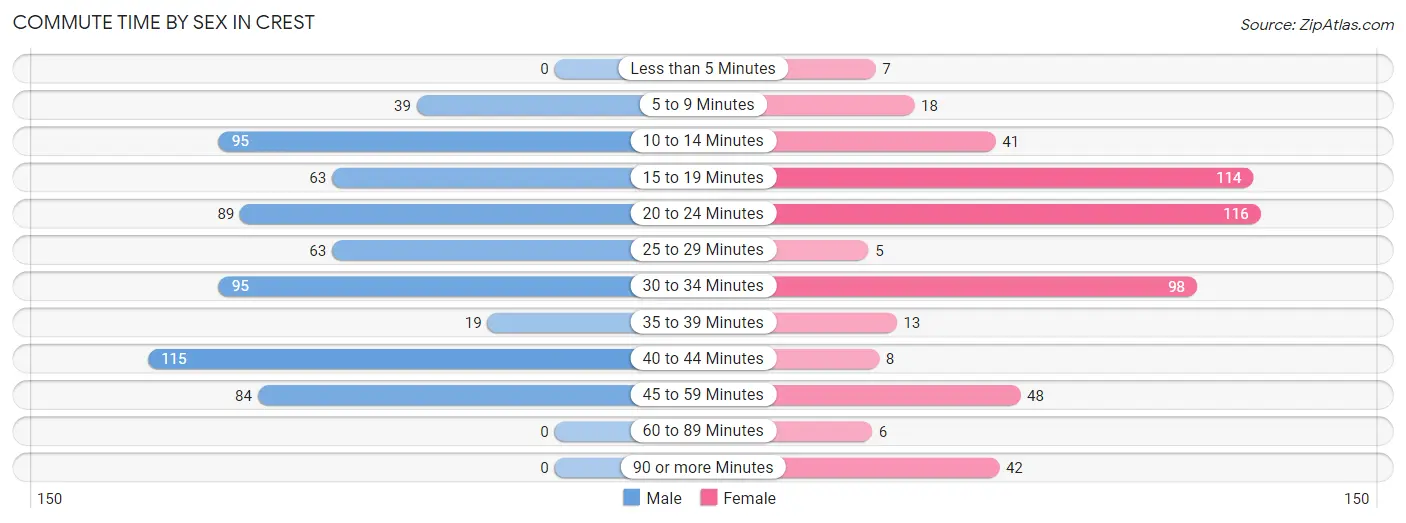
| Commute Time | Male | Female |
| Less than 5 Minutes | 0 (0.0%) | 7 (1.4%) |
| 5 to 9 Minutes | 39 (5.9%) | 18 (3.5%) |
| 10 to 14 Minutes | 95 (14.3%) | 41 (8.0%) |
| 15 to 19 Minutes | 63 (9.5%) | 114 (22.1%) |
| 20 to 24 Minutes | 89 (13.4%) | 116 (22.5%) |
| 25 to 29 Minutes | 63 (9.5%) | 5 (1.0%) |
| 30 to 34 Minutes | 95 (14.3%) | 98 (19.0%) |
| 35 to 39 Minutes | 19 (2.9%) | 13 (2.5%) |
| 40 to 44 Minutes | 115 (17.4%) | 8 (1.5%) |
| 45 to 59 Minutes | 84 (12.7%) | 48 (9.3%) |
| 60 to 89 Minutes | 0 (0.0%) | 6 (1.2%) |
| 90 or more Minutes | 0 (0.0%) | 42 (8.1%) |
Time of Departure to Work by Sex in Crest
The most frequent times of departure to work in Crest are 5:30 AM to 5:59 AM (93, 14.1%) for males and 7:00 AM to 7:29 AM (208, 40.3%) for females.
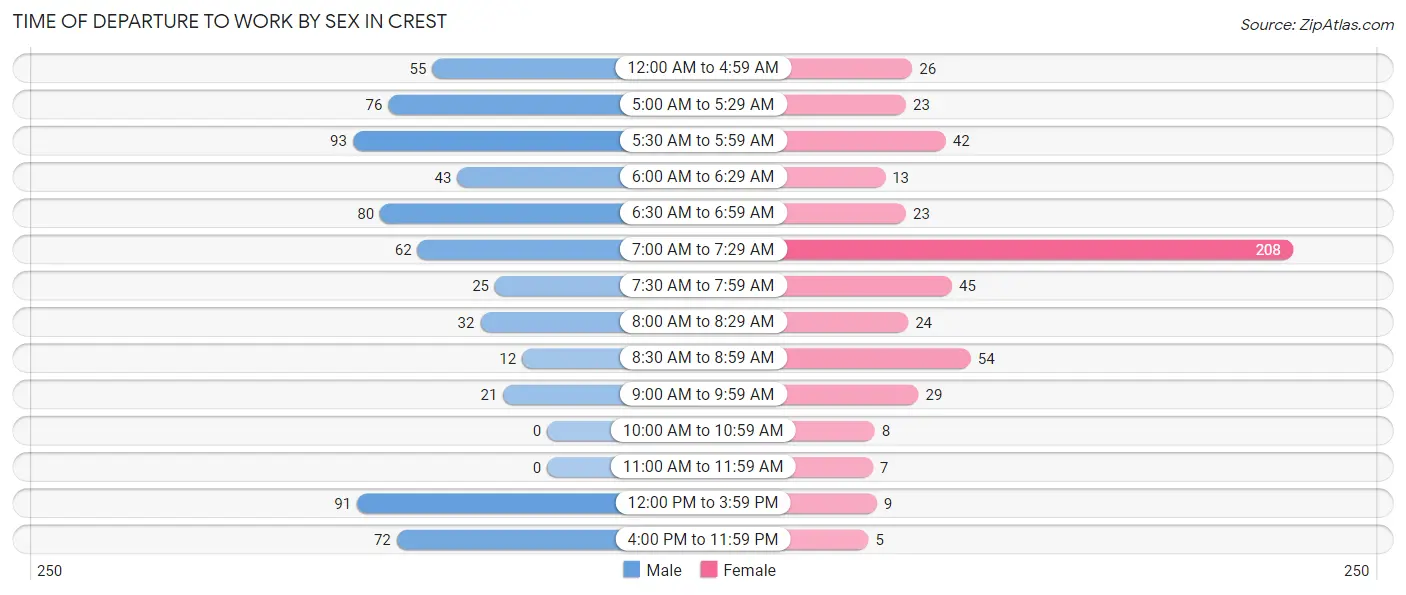
| Time of Departure | Male | Female |
| 12:00 AM to 4:59 AM | 55 (8.3%) | 26 (5.0%) |
| 5:00 AM to 5:29 AM | 76 (11.5%) | 23 (4.5%) |
| 5:30 AM to 5:59 AM | 93 (14.1%) | 42 (8.1%) |
| 6:00 AM to 6:29 AM | 43 (6.5%) | 13 (2.5%) |
| 6:30 AM to 6:59 AM | 80 (12.1%) | 23 (4.5%) |
| 7:00 AM to 7:29 AM | 62 (9.4%) | 208 (40.3%) |
| 7:30 AM to 7:59 AM | 25 (3.8%) | 45 (8.7%) |
| 8:00 AM to 8:29 AM | 32 (4.8%) | 24 (4.6%) |
| 8:30 AM to 8:59 AM | 12 (1.8%) | 54 (10.5%) |
| 9:00 AM to 9:59 AM | 21 (3.2%) | 29 (5.6%) |
| 10:00 AM to 10:59 AM | 0 (0.0%) | 8 (1.5%) |
| 11:00 AM to 11:59 AM | 0 (0.0%) | 7 (1.4%) |
| 12:00 PM to 3:59 PM | 91 (13.8%) | 9 (1.7%) |
| 4:00 PM to 11:59 PM | 72 (10.9%) | 5 (1.0%) |
| Total | 662 (100.0%) | 516 (100.0%) |
Housing Occupancy in Crest
Occupancy by Ownership in Crest
Of the total 1,074 dwellings in Crest, owner-occupied units account for 966 (89.9%), while renter-occupied units make up 108 (10.1%).
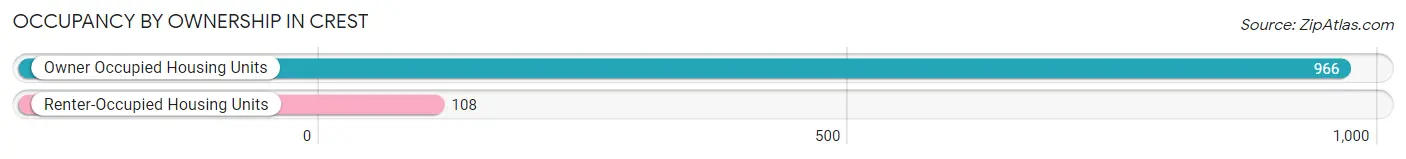
| Occupancy | # Housing Units | % Housing Units |
| Owner Occupied Housing Units | 966 | 89.9% |
| Renter-Occupied Housing Units | 108 | 10.1% |
| Total Occupied Housing Units | 1,074 | 100.0% |
Occupancy by Household Size in Crest
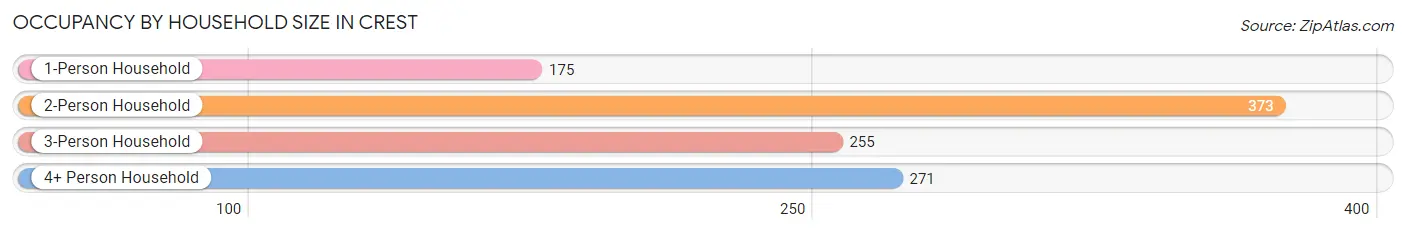
| Household Size | # Housing Units | % Housing Units |
| 1-Person Household | 175 | 16.3% |
| 2-Person Household | 373 | 34.7% |
| 3-Person Household | 255 | 23.7% |
| 4+ Person Household | 271 | 25.2% |
| Total Housing Units | 1,074 | 100.0% |
Occupancy by Ownership by Household Size in Crest
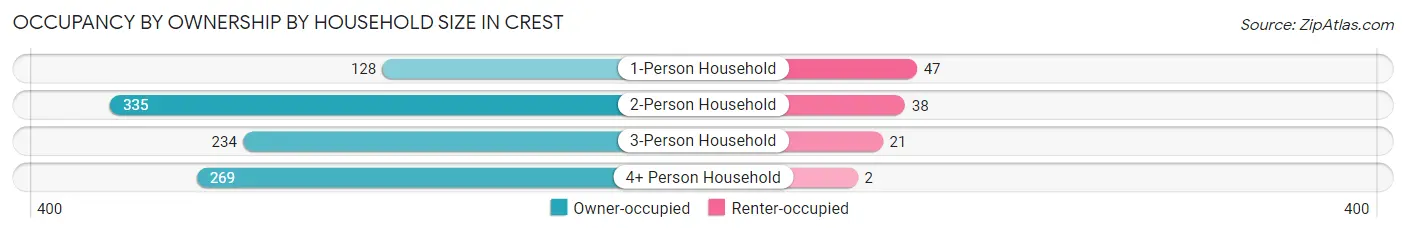
| Household Size | Owner-occupied | Renter-occupied |
| 1-Person Household | 128 (73.1%) | 47 (26.9%) |
| 2-Person Household | 335 (89.8%) | 38 (10.2%) |
| 3-Person Household | 234 (91.8%) | 21 (8.2%) |
| 4+ Person Household | 269 (99.3%) | 2 (0.7%) |
| Total Housing Units | 966 (89.9%) | 108 (10.1%) |
Occupancy by Educational Attainment in Crest
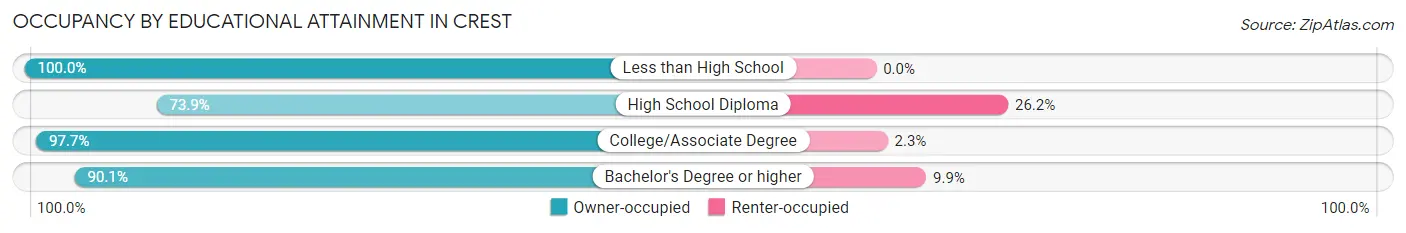
| Household Size | Owner-occupied | Renter-occupied |
| Less than High School | 36 (100.0%) | 0 (0.0%) |
| High School Diploma | 192 (73.9%) | 68 (26.2%) |
| College/Associate Degree | 474 (97.7%) | 11 (2.3%) |
| Bachelor's Degree or higher | 264 (90.1%) | 29 (9.9%) |
Occupancy by Age of Householder in Crest
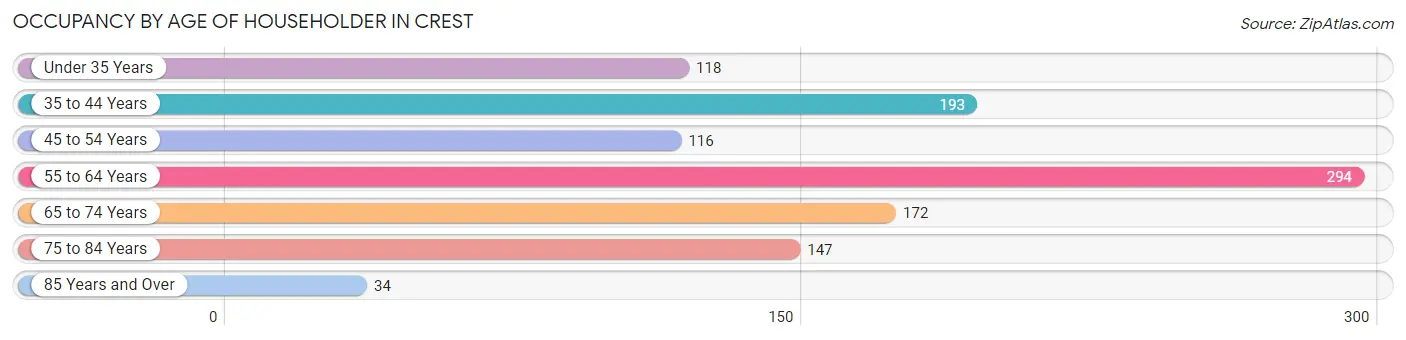
| Age Bracket | # Households | % Households |
| Under 35 Years | 118 | 11.0% |
| 35 to 44 Years | 193 | 18.0% |
| 45 to 54 Years | 116 | 10.8% |
| 55 to 64 Years | 294 | 27.4% |
| 65 to 74 Years | 172 | 16.0% |
| 75 to 84 Years | 147 | 13.7% |
| 85 Years and Over | 34 | 3.2% |
| Total | 1,074 | 100.0% |
Housing Finances in Crest
Median Income by Occupancy in Crest
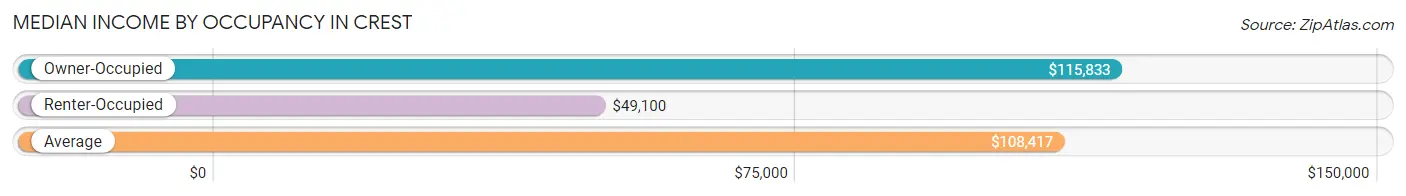
| Occupancy Type | # Households | Median Income |
| Owner-Occupied | 966 (89.9%) | $115,833 |
| Renter-Occupied | 108 (10.1%) | $49,100 |
| Average | 1,074 (100.0%) | $108,417 |
Occupancy by Householder Income Bracket in Crest
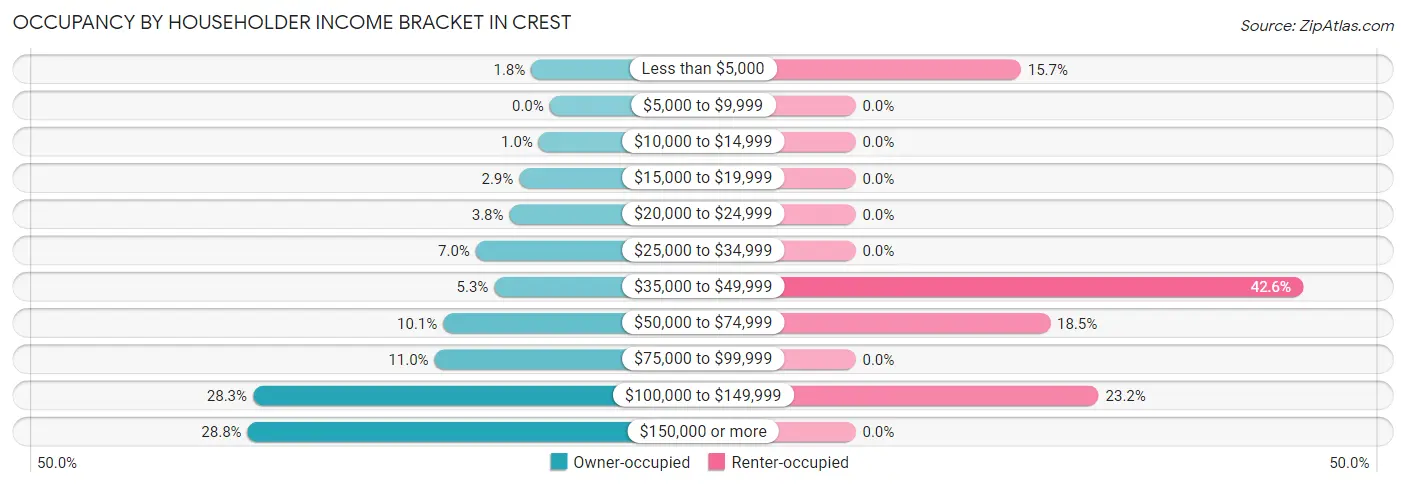
| Income Bracket | Owner-occupied | Renter-occupied |
| Less than $5,000 | 17 (1.8%) | 17 (15.7%) |
| $5,000 to $9,999 | 0 (0.0%) | 0 (0.0%) |
| $10,000 to $14,999 | 10 (1.0%) | 0 (0.0%) |
| $15,000 to $19,999 | 28 (2.9%) | 0 (0.0%) |
| $20,000 to $24,999 | 37 (3.8%) | 0 (0.0%) |
| $25,000 to $34,999 | 68 (7.0%) | 0 (0.0%) |
| $35,000 to $49,999 | 51 (5.3%) | 46 (42.6%) |
| $50,000 to $74,999 | 98 (10.1%) | 20 (18.5%) |
| $75,000 to $99,999 | 106 (11.0%) | 0 (0.0%) |
| $100,000 to $149,999 | 273 (28.3%) | 25 (23.2%) |
| $150,000 or more | 278 (28.8%) | 0 (0.0%) |
| Total | 966 (100.0%) | 108 (100.0%) |
Monthly Housing Cost Tiers in Crest
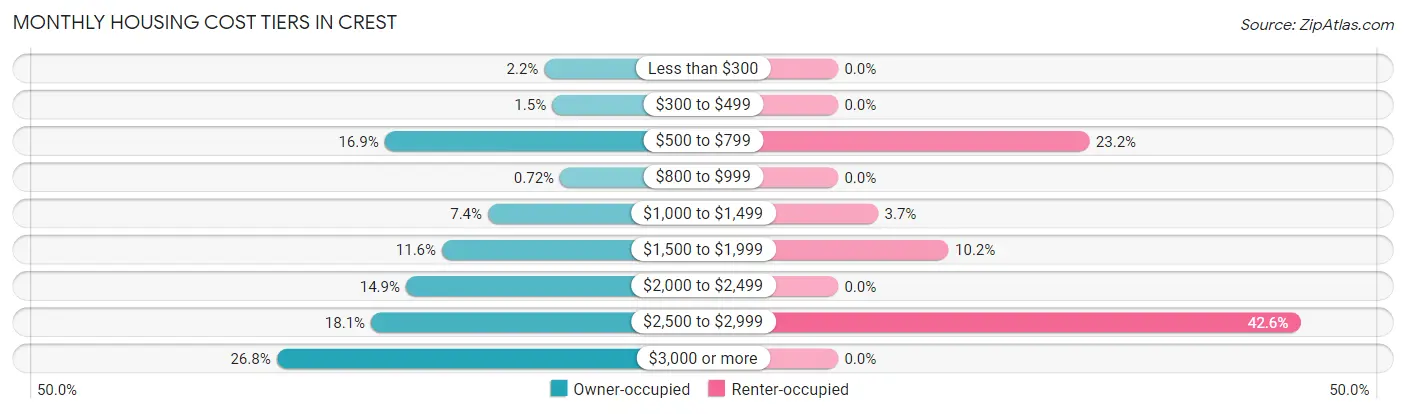
| Monthly Cost | Owner-occupied | Renter-occupied |
| Less than $300 | 21 (2.2%) | 0 (0.0%) |
| $300 to $499 | 14 (1.5%) | 0 (0.0%) |
| $500 to $799 | 163 (16.9%) | 25 (23.2%) |
| $800 to $999 | 7 (0.7%) | 0 (0.0%) |
| $1,000 to $1,499 | 71 (7.3%) | 4 (3.7%) |
| $1,500 to $1,999 | 112 (11.6%) | 11 (10.2%) |
| $2,000 to $2,499 | 144 (14.9%) | 0 (0.0%) |
| $2,500 to $2,999 | 175 (18.1%) | 46 (42.6%) |
| $3,000 or more | 259 (26.8%) | 0 (0.0%) |
| Total | 966 (100.0%) | 108 (100.0%) |
Physical Housing Characteristics in Crest
Housing Structures in Crest
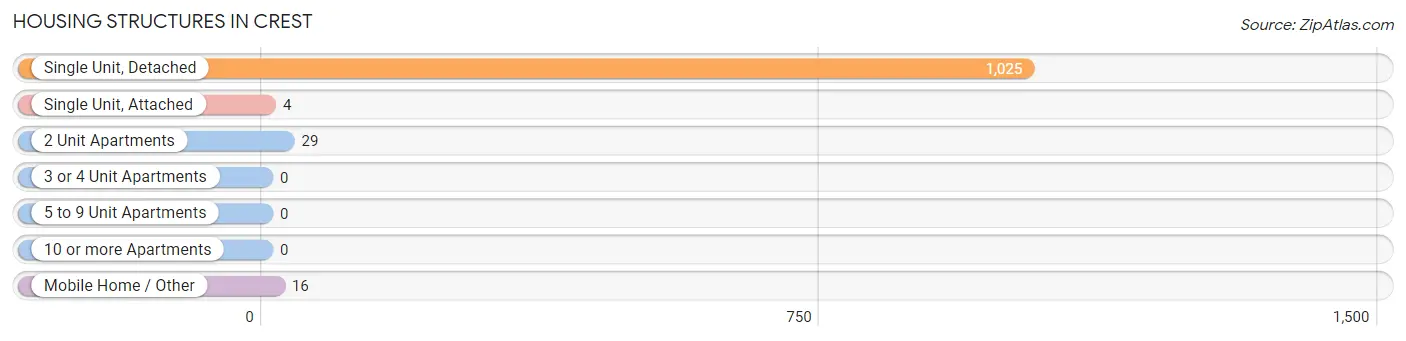
| Structure Type | # Housing Units | % Housing Units |
| Single Unit, Detached | 1,025 | 95.4% |
| Single Unit, Attached | 4 | 0.4% |
| 2 Unit Apartments | 29 | 2.7% |
| 3 or 4 Unit Apartments | 0 | 0.0% |
| 5 to 9 Unit Apartments | 0 | 0.0% |
| 10 or more Apartments | 0 | 0.0% |
| Mobile Home / Other | 16 | 1.5% |
| Total | 1,074 | 100.0% |
Housing Structures by Occupancy in Crest
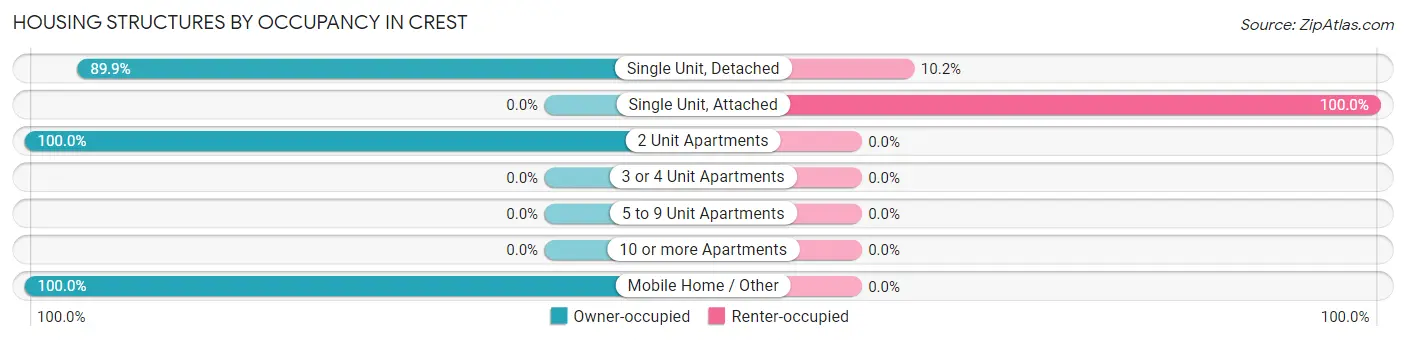
| Structure Type | Owner-occupied | Renter-occupied |
| Single Unit, Detached | 921 (89.8%) | 104 (10.2%) |
| Single Unit, Attached | 0 (0.0%) | 4 (100.0%) |
| 2 Unit Apartments | 29 (100.0%) | 0 (0.0%) |
| 3 or 4 Unit Apartments | 0 (0.0%) | 0 (0.0%) |
| 5 to 9 Unit Apartments | 0 (0.0%) | 0 (0.0%) |
| 10 or more Apartments | 0 (0.0%) | 0 (0.0%) |
| Mobile Home / Other | 16 (100.0%) | 0 (0.0%) |
| Total | 966 (89.9%) | 108 (10.1%) |
Housing Structures by Number of Rooms in Crest
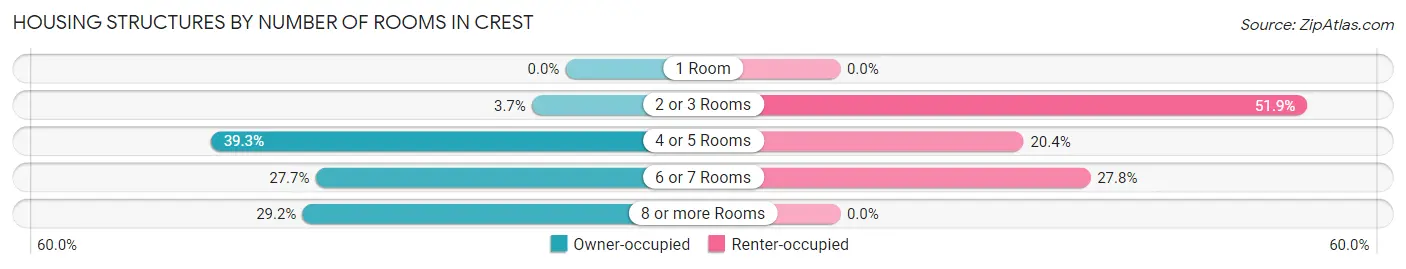
| Number of Rooms | Owner-occupied | Renter-occupied |
| 1 Room | 0 (0.0%) | 0 (0.0%) |
| 2 or 3 Rooms | 36 (3.7%) | 56 (51.8%) |
| 4 or 5 Rooms | 380 (39.3%) | 22 (20.4%) |
| 6 or 7 Rooms | 268 (27.7%) | 30 (27.8%) |
| 8 or more Rooms | 282 (29.2%) | 0 (0.0%) |
| Total | 966 (100.0%) | 108 (100.0%) |
Housing Structure by Heating Type in Crest
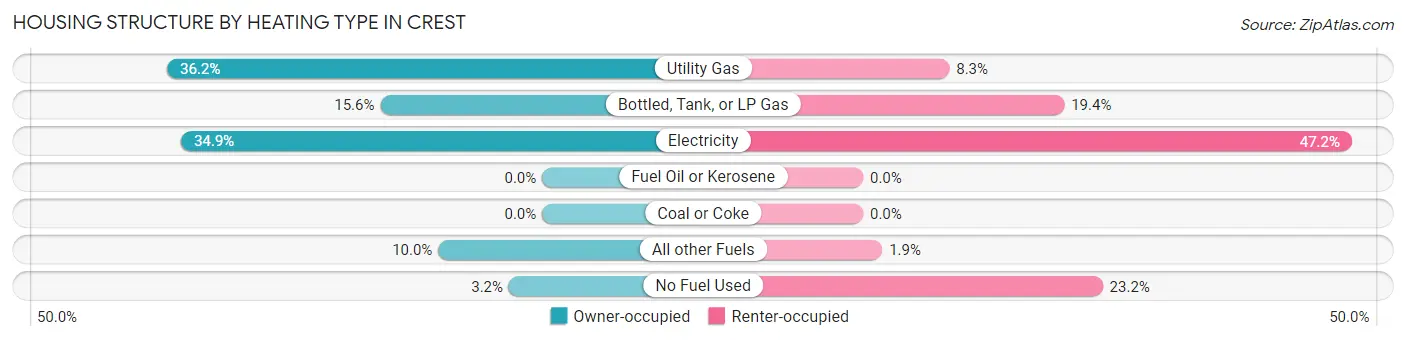
| Heating Type | Owner-occupied | Renter-occupied |
| Utility Gas | 350 (36.2%) | 9 (8.3%) |
| Bottled, Tank, or LP Gas | 151 (15.6%) | 21 (19.4%) |
| Electricity | 337 (34.9%) | 51 (47.2%) |
| Fuel Oil or Kerosene | 0 (0.0%) | 0 (0.0%) |
| Coal or Coke | 0 (0.0%) | 0 (0.0%) |
| All other Fuels | 97 (10.0%) | 2 (1.8%) |
| No Fuel Used | 31 (3.2%) | 25 (23.2%) |
| Total | 966 (100.0%) | 108 (100.0%) |
Household Vehicle Usage in Crest
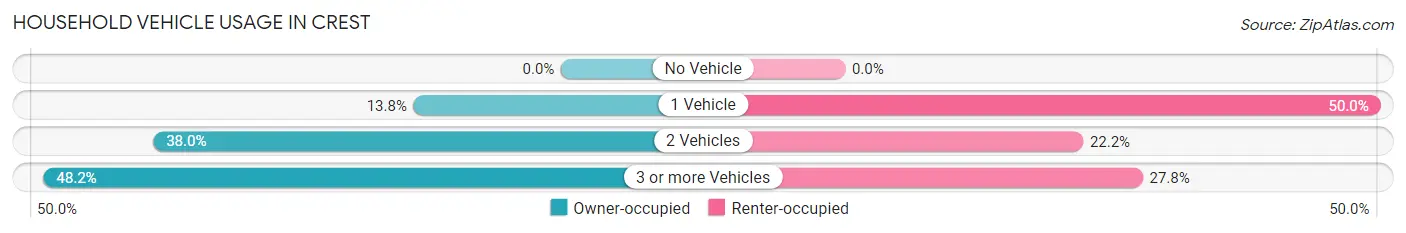
| Vehicles per Household | Owner-occupied | Renter-occupied |
| No Vehicle | 0 (0.0%) | 0 (0.0%) |
| 1 Vehicle | 133 (13.8%) | 54 (50.0%) |
| 2 Vehicles | 367 (38.0%) | 24 (22.2%) |
| 3 or more Vehicles | 466 (48.2%) | 30 (27.8%) |
| Total | 966 (100.0%) | 108 (100.0%) |
Real Estate & Mortgages in Crest
Real Estate and Mortgage Overview in Crest
| Characteristic | Without Mortgage | With Mortgage |
| Housing Units | 232 | 734 |
| Median Property Value | $633,300 | $679,300 |
| Median Household Income | $41,477 | $261 |
| Monthly Housing Costs | $720 | $259 |
| Real Estate Taxes | $2,848 | $31 |
Property Value by Mortgage Status in Crest
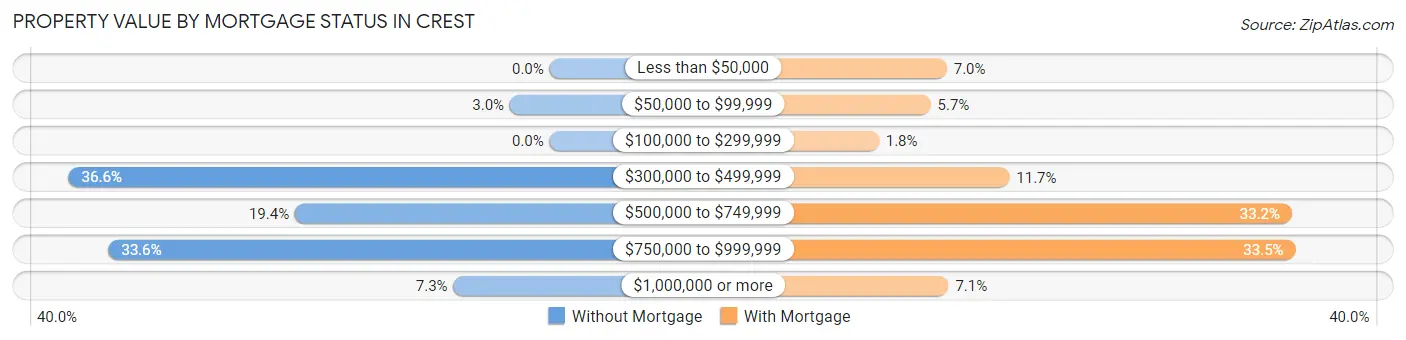
| Property Value | Without Mortgage | With Mortgage |
| Less than $50,000 | 0 (0.0%) | 51 (7.0%) |
| $50,000 to $99,999 | 7 (3.0%) | 42 (5.7%) |
| $100,000 to $299,999 | 0 (0.0%) | 13 (1.8%) |
| $300,000 to $499,999 | 85 (36.6%) | 86 (11.7%) |
| $500,000 to $749,999 | 45 (19.4%) | 244 (33.2%) |
| $750,000 to $999,999 | 78 (33.6%) | 246 (33.5%) |
| $1,000,000 or more | 17 (7.3%) | 52 (7.1%) |
| Total | 232 (100.0%) | 734 (100.0%) |
Household Income by Mortgage Status in Crest
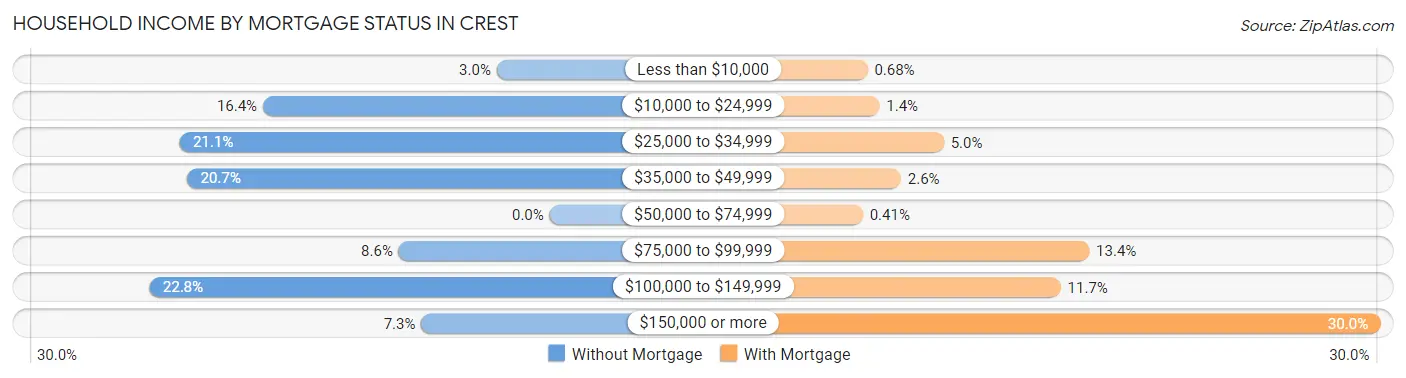
| Household Income | Without Mortgage | With Mortgage |
| Less than $10,000 | 7 (3.0%) | 5 (0.7%) |
| $10,000 to $24,999 | 38 (16.4%) | 10 (1.4%) |
| $25,000 to $34,999 | 49 (21.1%) | 37 (5.0%) |
| $35,000 to $49,999 | 48 (20.7%) | 19 (2.6%) |
| $50,000 to $74,999 | 0 (0.0%) | 3 (0.4%) |
| $75,000 to $99,999 | 20 (8.6%) | 98 (13.4%) |
| $100,000 to $149,999 | 53 (22.8%) | 86 (11.7%) |
| $150,000 or more | 17 (7.3%) | 220 (30.0%) |
| Total | 232 (100.0%) | 734 (100.0%) |
Property Value to Household Income Ratio in Crest
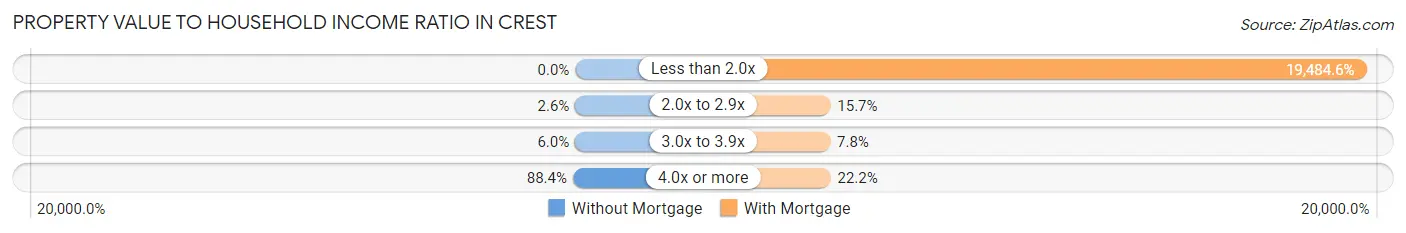
| Value-to-Income Ratio | Without Mortgage | With Mortgage |
| Less than 2.0x | 0 (0.0%) | 143,017 (19,484.6%) |
| 2.0x to 2.9x | 6 (2.6%) | 115 (15.7%) |
| 3.0x to 3.9x | 14 (6.0%) | 57 (7.8%) |
| 4.0x or more | 205 (88.4%) | 163 (22.2%) |
| Total | 232 (100.0%) | 734 (100.0%) |
Real Estate Taxes by Mortgage Status in Crest
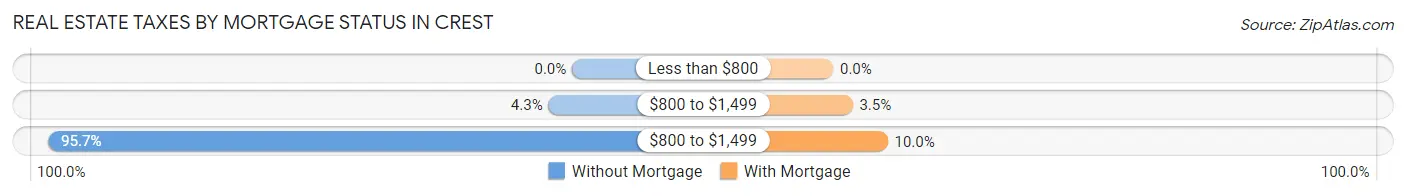
| Property Taxes | Without Mortgage | With Mortgage |
| Less than $800 | 0 (0.0%) | 0 (0.0%) |
| $800 to $1,499 | 10 (4.3%) | 26 (3.5%) |
| $800 to $1,499 | 222 (95.7%) | 73 (10.0%) |
| Total | 232 (100.0%) | 734 (100.0%) |
Health & Disability in Crest
Health Insurance Coverage by Age in Crest
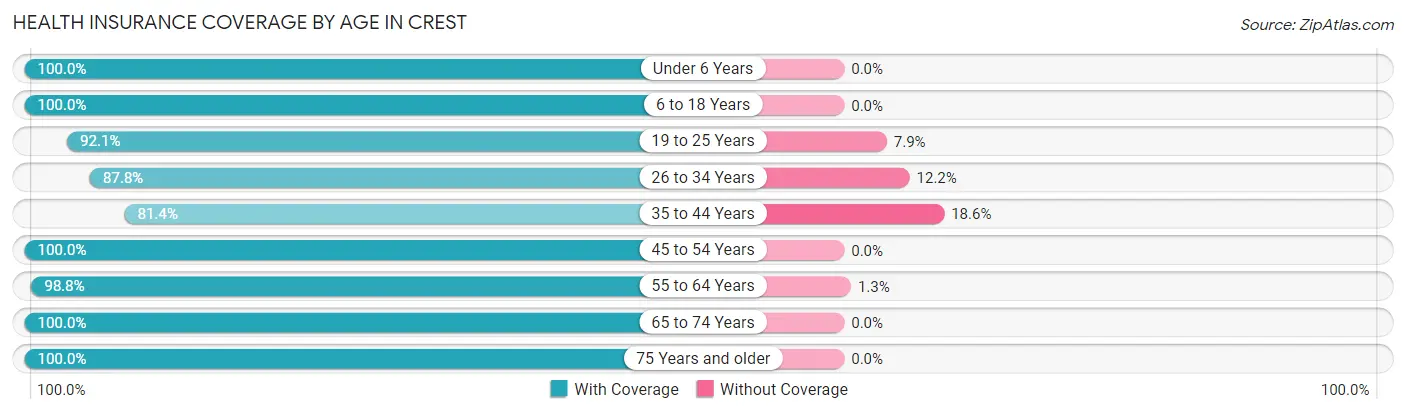
| Age Bracket | With Coverage | Without Coverage |
| Under 6 Years | 175 (100.0%) | 0 (0.0%) |
| 6 to 18 Years | 593 (100.0%) | 0 (0.0%) |
| 19 to 25 Years | 255 (92.1%) | 22 (7.9%) |
| 26 to 34 Years | 209 (87.8%) | 29 (12.2%) |
| 35 to 44 Years | 310 (81.4%) | 71 (18.6%) |
| 45 to 54 Years | 300 (100.0%) | 0 (0.0%) |
| 55 to 64 Years | 630 (98.8%) | 8 (1.3%) |
| 65 to 74 Years | 263 (100.0%) | 0 (0.0%) |
| 75 Years and older | 314 (100.0%) | 0 (0.0%) |
| Total | 3,049 (95.9%) | 130 (4.1%) |
Health Insurance Coverage by Citizenship Status in Crest
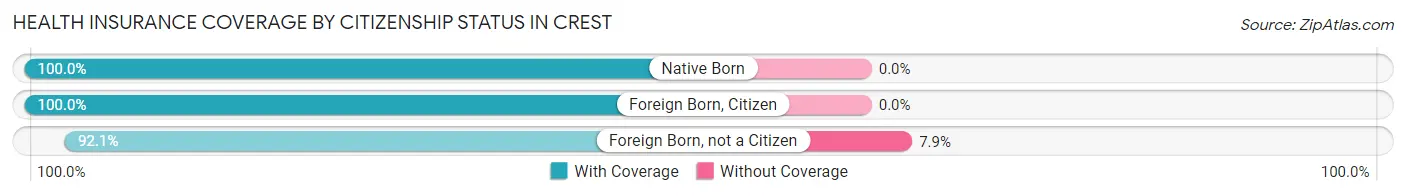
| Citizenship Status | With Coverage | Without Coverage |
| Native Born | 175 (100.0%) | 0 (0.0%) |
| Foreign Born, Citizen | 593 (100.0%) | 0 (0.0%) |
| Foreign Born, not a Citizen | 255 (92.1%) | 22 (7.9%) |
Health Insurance Coverage by Household Income in Crest
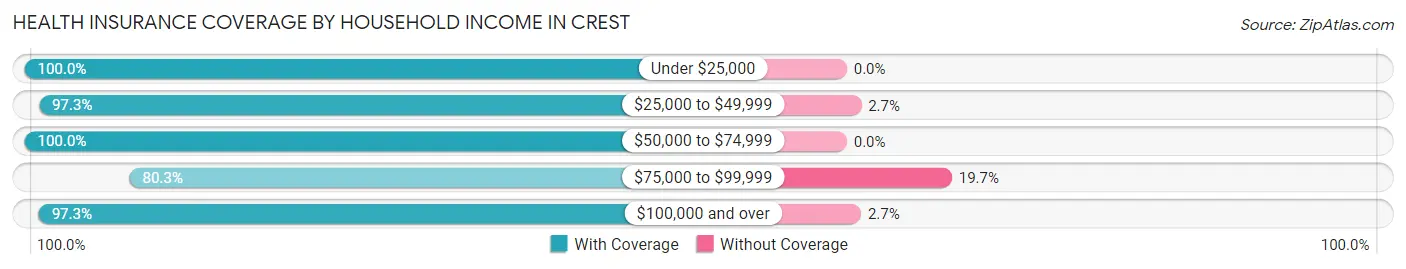
| Household Income | With Coverage | Without Coverage |
| Under $25,000 | 171 (100.0%) | 0 (0.0%) |
| $25,000 to $49,999 | 396 (97.3%) | 11 (2.7%) |
| $50,000 to $74,999 | 436 (100.0%) | 0 (0.0%) |
| $75,000 to $99,999 | 290 (80.3%) | 71 (19.7%) |
| $100,000 and over | 1,756 (97.3%) | 48 (2.7%) |
Public vs Private Health Insurance Coverage by Age in Crest
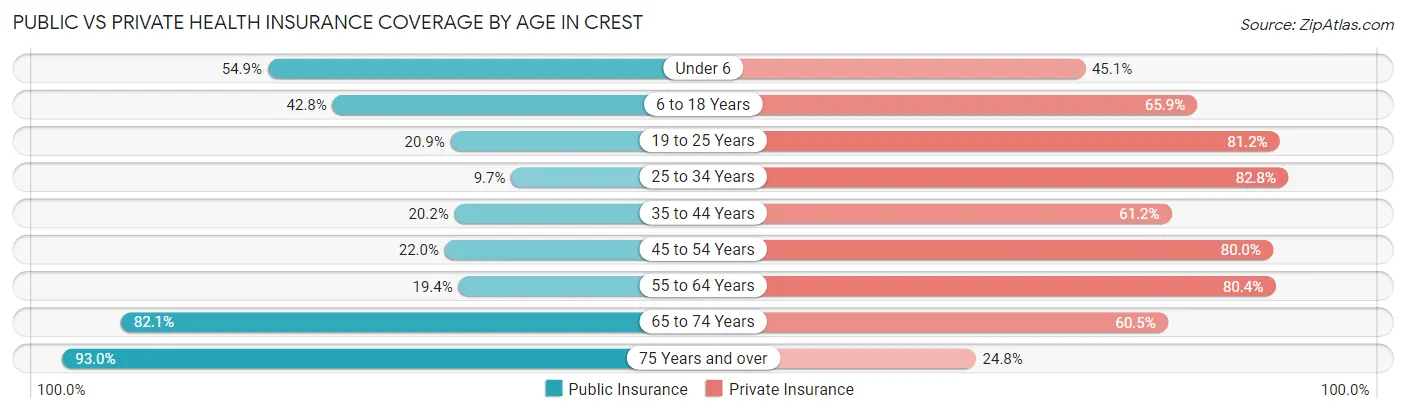
| Age Bracket | Public Insurance | Private Insurance |
| Under 6 | 96 (54.9%) | 79 (45.1%) |
| 6 to 18 Years | 254 (42.8%) | 391 (65.9%) |
| 19 to 25 Years | 58 (20.9%) | 225 (81.2%) |
| 25 to 34 Years | 23 (9.7%) | 197 (82.8%) |
| 35 to 44 Years | 77 (20.2%) | 233 (61.2%) |
| 45 to 54 Years | 66 (22.0%) | 240 (80.0%) |
| 55 to 64 Years | 124 (19.4%) | 513 (80.4%) |
| 65 to 74 Years | 216 (82.1%) | 159 (60.5%) |
| 75 Years and over | 292 (93.0%) | 78 (24.8%) |
| Total | 1,206 (37.9%) | 2,115 (66.5%) |
Disability Status by Sex by Age in Crest
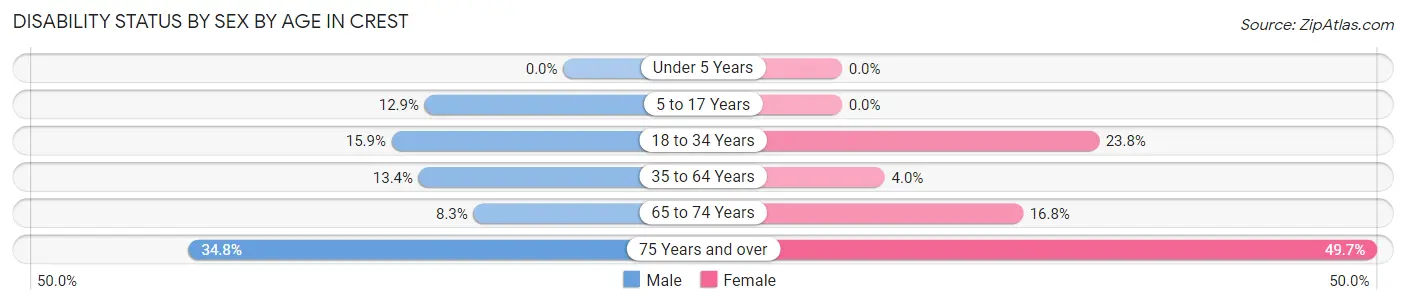
| Age Bracket | Male | Female |
| Under 5 Years | 0 (0.0%) | 0 (0.0%) |
| 5 to 17 Years | 27 (12.9%) | 0 (0.0%) |
| 18 to 34 Years | 50 (15.9%) | 87 (23.8%) |
| 35 to 64 Years | 79 (13.4%) | 29 (4.0%) |
| 65 to 74 Years | 11 (8.3%) | 22 (16.8%) |
| 75 Years and over | 56 (34.8%) | 76 (49.7%) |
Disability Class by Sex by Age in Crest
Disability Class: Hearing Difficulty
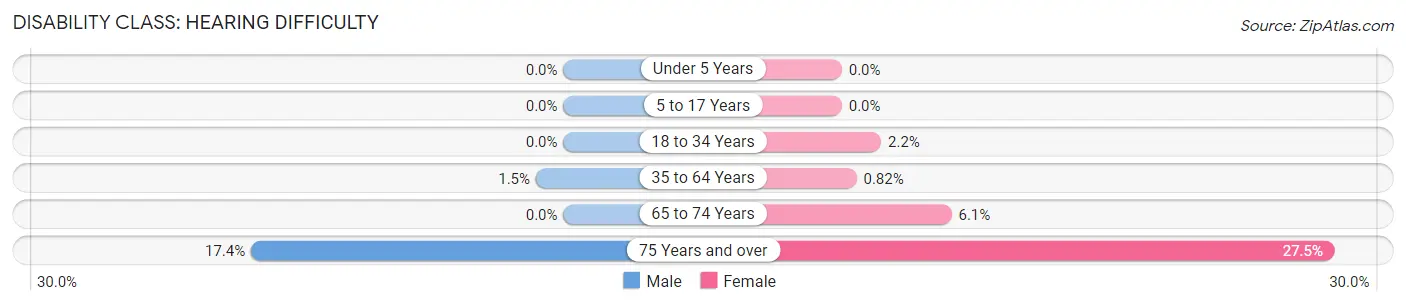
| Age Bracket | Male | Female |
| Under 5 Years | 0 (0.0%) | 0 (0.0%) |
| 5 to 17 Years | 0 (0.0%) | 0 (0.0%) |
| 18 to 34 Years | 0 (0.0%) | 8 (2.2%) |
| 35 to 64 Years | 9 (1.5%) | 6 (0.8%) |
| 65 to 74 Years | 0 (0.0%) | 8 (6.1%) |
| 75 Years and over | 28 (17.4%) | 42 (27.5%) |
Disability Class: Vision Difficulty
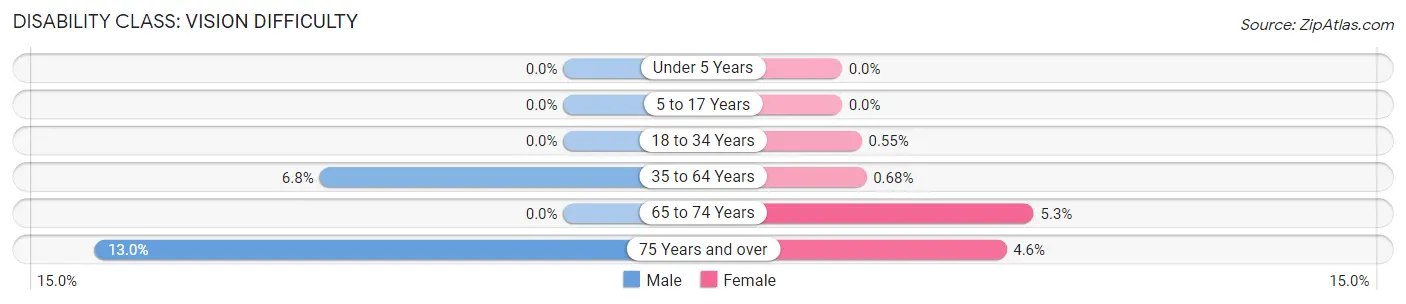
| Age Bracket | Male | Female |
| Under 5 Years | 0 (0.0%) | 0 (0.0%) |
| 5 to 17 Years | 0 (0.0%) | 0 (0.0%) |
| 18 to 34 Years | 0 (0.0%) | 2 (0.5%) |
| 35 to 64 Years | 40 (6.8%) | 5 (0.7%) |
| 65 to 74 Years | 0 (0.0%) | 7 (5.3%) |
| 75 Years and over | 21 (13.0%) | 7 (4.6%) |
Disability Class: Cognitive Difficulty
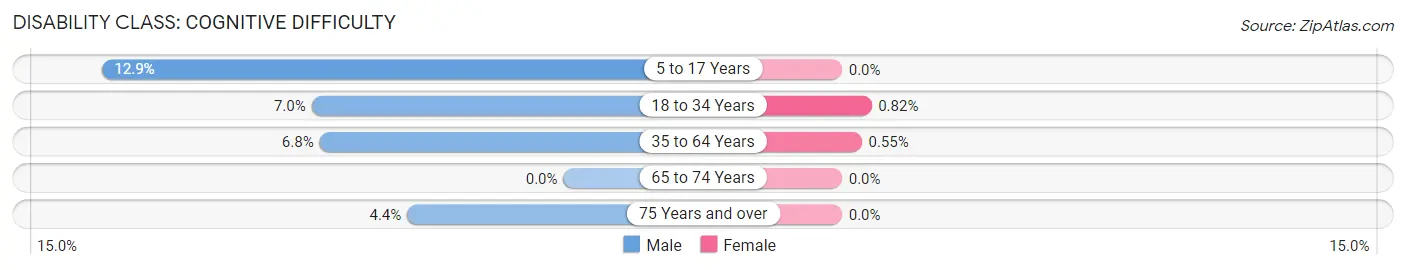
| Age Bracket | Male | Female |
| 5 to 17 Years | 27 (12.9%) | 0 (0.0%) |
| 18 to 34 Years | 22 (7.0%) | 3 (0.8%) |
| 35 to 64 Years | 40 (6.8%) | 4 (0.5%) |
| 65 to 74 Years | 0 (0.0%) | 0 (0.0%) |
| 75 Years and over | 7 (4.3%) | 0 (0.0%) |
Disability Class: Ambulatory Difficulty
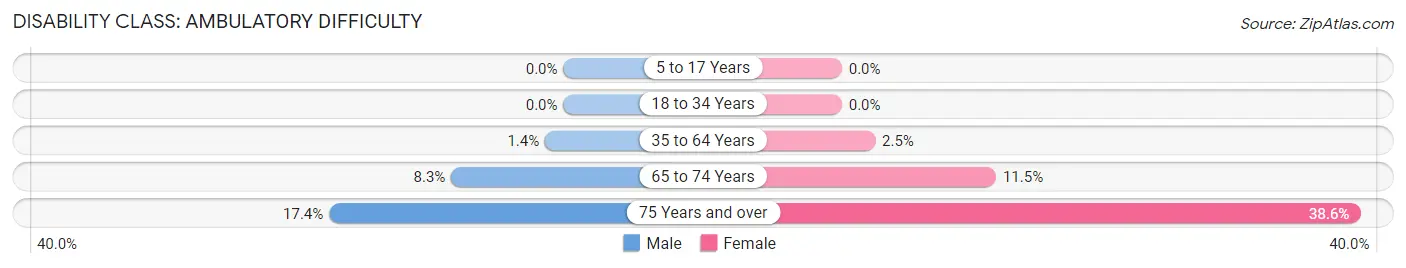
| Age Bracket | Male | Female |
| 5 to 17 Years | 0 (0.0%) | 0 (0.0%) |
| 18 to 34 Years | 0 (0.0%) | 0 (0.0%) |
| 35 to 64 Years | 8 (1.4%) | 18 (2.5%) |
| 65 to 74 Years | 11 (8.3%) | 15 (11.5%) |
| 75 Years and over | 28 (17.4%) | 59 (38.6%) |
Disability Class: Self-Care Difficulty
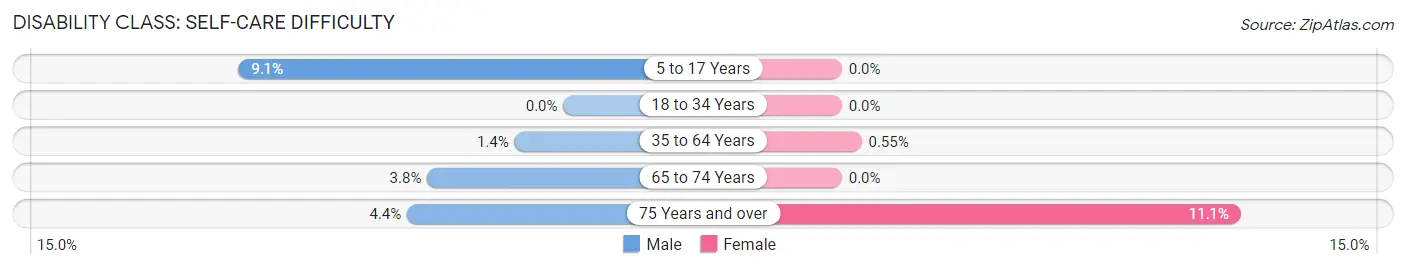
| Age Bracket | Male | Female |
| 5 to 17 Years | 19 (9.0%) | 0 (0.0%) |
| 18 to 34 Years | 0 (0.0%) | 0 (0.0%) |
| 35 to 64 Years | 8 (1.4%) | 4 (0.5%) |
| 65 to 74 Years | 5 (3.8%) | 0 (0.0%) |
| 75 Years and over | 7 (4.3%) | 17 (11.1%) |
Technology Access in Crest
Computing Device Access in Crest
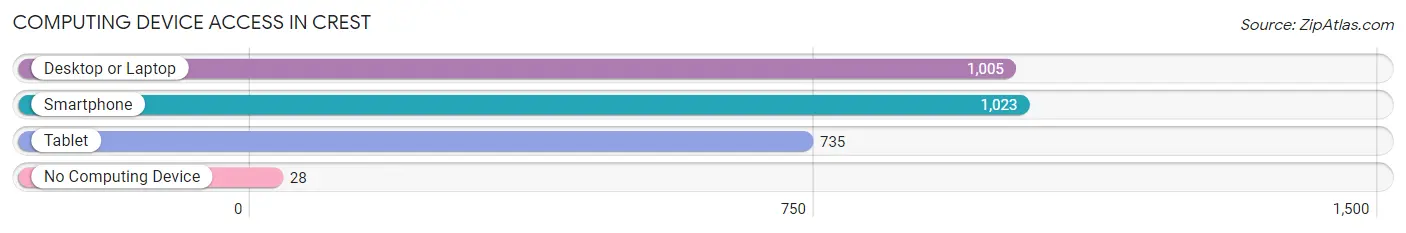
| Device Type | # Households | % Households |
| Desktop or Laptop | 1,005 | 93.6% |
| Smartphone | 1,023 | 95.3% |
| Tablet | 735 | 68.4% |
| No Computing Device | 28 | 2.6% |
| Total | 1,074 | 100.0% |
Internet Access in Crest
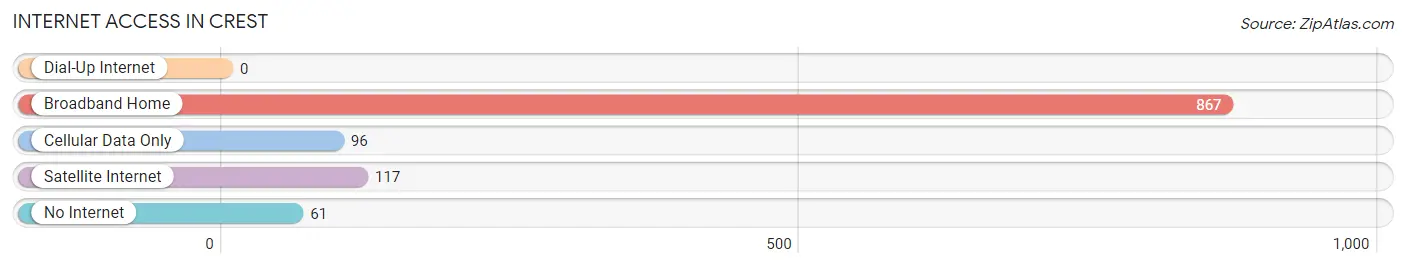
| Internet Type | # Households | % Households |
| Dial-Up Internet | 0 | 0.0% |
| Broadband Home | 867 | 80.7% |
| Cellular Data Only | 96 | 8.9% |
| Satellite Internet | 117 | 10.9% |
| No Internet | 61 | 5.7% |
| Total | 1,074 | 100.0% |
Crest Summary
Crest is a small unincorporated community located in San Diego County, California. It is situated in the foothills of the Cuyamaca Mountains, approximately 25 miles east of downtown San Diego. The community is bordered by the cities of El Cajon and La Mesa, and is part of the East County region of San Diego County.
History
The area now known as Crest was originally inhabited by the Kumeyaay people, who were the original inhabitants of the San Diego region. The first European settlers arrived in the area in the late 19th century, and the community was officially established in 1887. The community was named after the nearby Crest Drive, which was named after the nearby mountain peak.
In the early 20th century, Crest was a popular destination for tourists, who would come to enjoy the area’s natural beauty and outdoor activities. The community was also home to a number of resorts, including the Crest Hotel, which was built in the 1920s.
Geography
Crest is located in the foothills of the Cuyamaca Mountains, at an elevation of approximately 3,000 feet. The community is situated in a valley surrounded by mountains, and is bordered by the cities of El Cajon and La Mesa. The area is characterized by rolling hills, with a variety of vegetation, including oak and pine trees.
The climate in Crest is mild, with temperatures ranging from the mid-50s to the mid-80s throughout the year. The area receives an average of 15 inches of rain per year, and is known for its sunny days and cool nights.
Economy
The economy of Crest is largely based on tourism and outdoor recreation. The area is home to a number of resorts, campgrounds, and other tourist attractions, including the Crest Hotel, which is a popular destination for visitors. The community is also home to a number of small businesses, including restaurants, shops, and other services.
Demographics
As of the 2010 census, the population of Crest was 2,845. The racial makeup of the community was 79.3% White, 8.2% African American, 0.7% Native American, 2.2% Asian, 0.2% Pacific Islander, and 8.4% from other races. The median household income in Crest was $50,945, and the median age was 43.7 years.
Conclusion
Crest is a small unincorporated community located in San Diego County, California. It is situated in the foothills of the Cuyamaca Mountains, and is known for its natural beauty and outdoor activities. The economy of Crest is largely based on tourism and outdoor recreation, and the community is home to a number of resorts, campgrounds, and other tourist attractions. The population of Crest was 2,845 as of the 2010 census, and the median household income was $50,945.
Common Questions
What is Per Capita Income in Crest?
Per Capita income in Crest is $39,764.
What is the Median Family Income in Crest?
Median Family Income in Crest is $115,972.
What is the Median Household income in Crest?
Median Household Income in Crest is $108,417.
What is Income or Wage Gap in Crest?
Income or Wage Gap in Crest is 24.8%.
Women in Crest earn 75.2 cents for every dollar earned by a man.
What is Inequality or Gini Index in Crest?
Inequality or Gini Index in Crest is 0.37.
What is the Total Population of Crest?
Total Population of Crest is 3,179.
What is the Total Male Population of Crest?
Total Male Population of Crest is 1,489.
What is the Total Female Population of Crest?
Total Female Population of Crest is 1,690.
What is the Ratio of Males per 100 Females in Crest?
There are 88.11 Males per 100 Females in Crest.
What is the Ratio of Females per 100 Males in Crest?
There are 113.50 Females per 100 Males in Crest.
What is the Median Population Age in Crest?
Median Population Age in Crest is 43.4 Years.
What is the Average Family Size in Crest
Average Family Size in Crest is 3.2 People.
What is the Average Household Size in Crest
Average Household Size in Crest is 3.0 People.
How Large is the Labor Force in Crest?
There are 1,314 People in the Labor Forcein in Crest.
What is the Percentage of People in the Labor Force in Crest?
49.9% of People are in the Labor Force in Crest.
What is the Unemployment Rate in Crest?
Unemployment Rate in Crest is 5.4%.