Cities with the Lowest Poverty Level Among Seniors Over the Age of 65 in Arkansas
RELATED REPORTS & OPTIONS
Lowest Poverty | Seniors 65+
Arkansas
Compare Cities
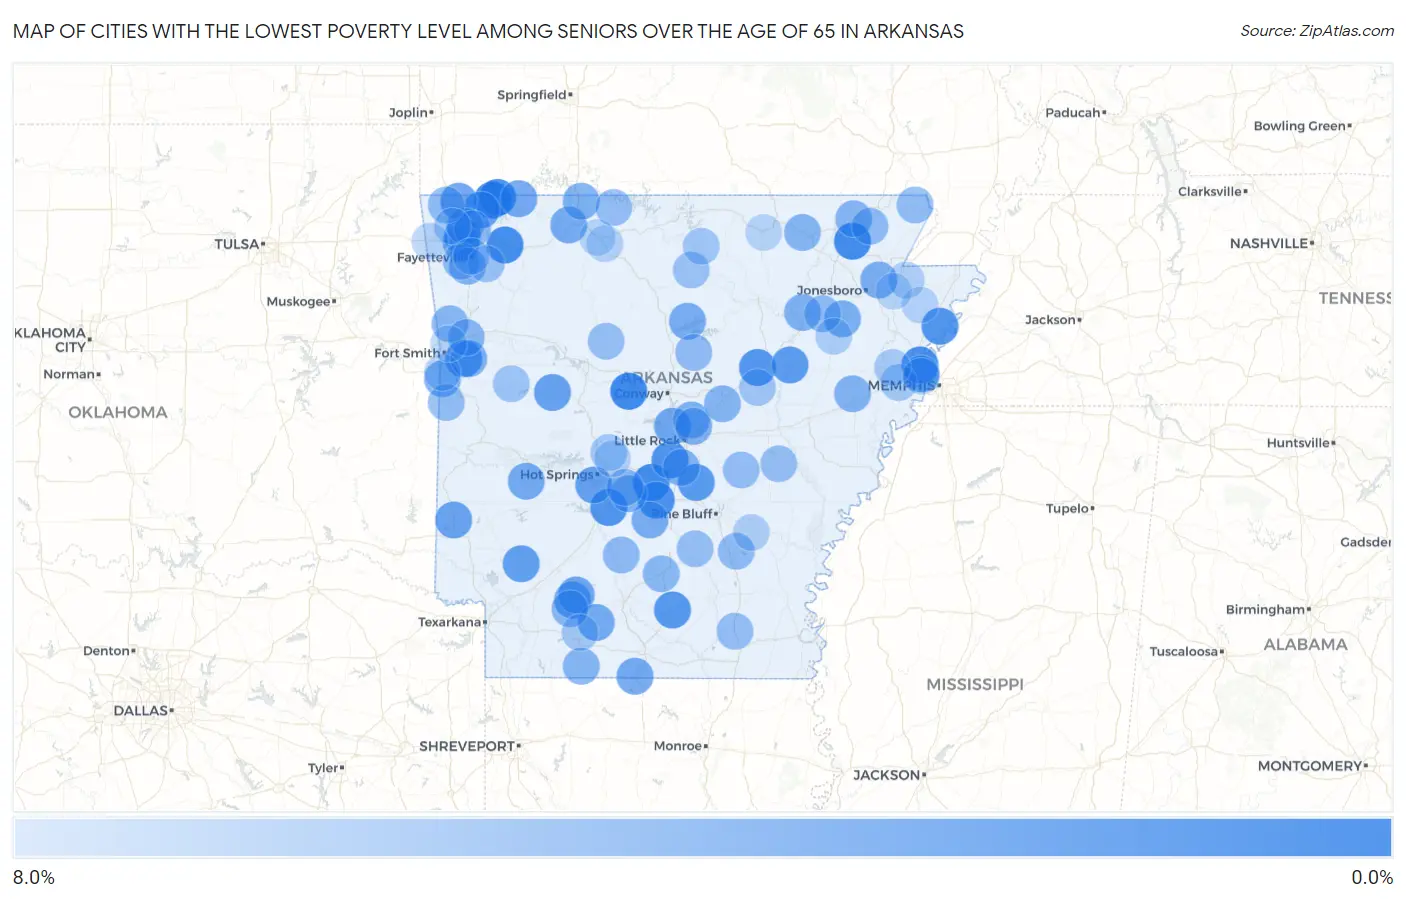
Map of Cities with the Lowest Poverty Level Among Seniors Over the Age of 65 in Arkansas
8.0%
0.0%
Cities with the Lowest Poverty Level Among Seniors Over the Age of 65 in Arkansas
| City | Senior Poverty | vs State | vs National | |
| 1. | Garfield | 0.71% | 10.7%(-10.0)#1 | 10.0%(-9.24)#146 |
| 2. | Oppelo | 1.2% | 10.7%(-9.54)#2 | 10.0%(-8.75)#414 |
| 3. | O Kean | 1.3% | 10.7%(-9.45)#3 | 10.0%(-8.67)#484 |
| 4. | Tull | 1.3% | 10.7%(-9.40)#4 | 10.0%(-8.62)#522 |
| 5. | Hindsville | 1.4% | 10.7%(-9.28)#5 | 10.0%(-8.50)#617 |
| 6. | Gateway | 1.7% | 10.7%(-9.07)#6 | 10.0%(-8.29)#780 |
| 7. | Clarkedale | 1.7% | 10.7%(-9.04)#7 | 10.0%(-8.26)#809 |
| 8. | Prattsville | 1.9% | 10.7%(-8.81)#8 | 10.0%(-8.03)#1,011 |
| 9. | Shannon Hills | 2.0% | 10.7%(-8.70)#9 | 10.0%(-7.92)#1,113 |
| 10. | Midway | 2.1% | 10.7%(-8.68)#10 | 10.0%(-7.90)#1,144 |
| 11. | Wilson | 2.3% | 10.7%(-8.46)#11 | 10.0%(-7.68)#1,349 |
| 12. | Judsonia | 2.4% | 10.7%(-8.35)#12 | 10.0%(-7.57)#1,482 |
| 13. | Harrell | 2.5% | 10.7%(-8.23)#13 | 10.0%(-7.45)#1,589 |
| 14. | Redfield | 2.6% | 10.7%(-8.14)#14 | 10.0%(-7.36)#1,689 |
| 15. | Central City | 2.7% | 10.7%(-8.07)#15 | 10.0%(-7.29)#1,790 |
| 16. | Augusta | 2.7% | 10.7%(-8.03)#16 | 10.0%(-7.24)#1,842 |
| 17. | Ozan | 3.0% | 10.7%(-7.70)#17 | 10.0%(-6.92)#2,226 |
| 18. | Henderson | 3.2% | 10.7%(-7.53)#18 | 10.0%(-6.75)#2,442 |
| 19. | Avoca | 3.2% | 10.7%(-7.52)#19 | 10.0%(-6.74)#2,450 |
| 20. | Lake Hamilton | 3.3% | 10.7%(-7.47)#20 | 10.0%(-6.68)#2,525 |
| 21. | Belleville | 3.3% | 10.7%(-7.46)#21 | 10.0%(-6.67)#2,540 |
| 22. | Gillham | 3.3% | 10.7%(-7.40)#22 | 10.0%(-6.62)#2,638 |
| 23. | Bella Vista | 3.3% | 10.7%(-7.39)#23 | 10.0%(-6.60)#2,656 |
| 24. | Elm Springs | 3.4% | 10.7%(-7.31)#24 | 10.0%(-6.52)#2,752 |
| 25. | Rosston | 3.7% | 10.7%(-7.03)#25 | 10.0%(-6.25)#3,144 |
| 26. | Sunset | 3.7% | 10.7%(-7.03)#26 | 10.0%(-6.25)#3,158 |
| 27. | Cale | 3.7% | 10.7%(-7.03)#27 | 10.0%(-6.25)#3,164 |
| 28. | Maumelle | 3.7% | 10.7%(-6.99)#28 | 10.0%(-6.20)#3,206 |
| 29. | Junction City | 3.8% | 10.7%(-6.92)#29 | 10.0%(-6.14)#3,271 |
| 30. | Holiday Island | 3.8% | 10.7%(-6.92)#30 | 10.0%(-6.14)#3,278 |
| 31. | Stephens | 3.9% | 10.7%(-6.82)#31 | 10.0%(-6.04)#3,412 |
| 32. | Norman | 4.0% | 10.7%(-6.73)#32 | 10.0%(-5.95)#3,551 |
| 33. | Alpena | 4.1% | 10.7%(-6.65)#33 | 10.0%(-5.87)#3,657 |
| 34. | Fairfield Bay | 4.2% | 10.7%(-6.56)#34 | 10.0%(-5.78)#3,805 |
| 35. | Pleasant Grove | 4.2% | 10.7%(-6.53)#35 | 10.0%(-5.75)#3,836 |
| 36. | Brookland | 4.3% | 10.7%(-6.44)#36 | 10.0%(-5.66)#3,949 |
| 37. | Leola | 4.3% | 10.7%(-6.39)#37 | 10.0%(-5.60)#4,038 |
| 38. | Weiner | 4.4% | 10.7%(-6.35)#38 | 10.0%(-5.57)#4,107 |
| 39. | Tontitown | 4.4% | 10.7%(-6.30)#39 | 10.0%(-5.52)#4,183 |
| 40. | Omaha | 4.5% | 10.7%(-6.19)#40 | 10.0%(-5.41)#4,371 |
| 41. | Gibson | 4.6% | 10.7%(-6.17)#41 | 10.0%(-5.38)#4,403 |
| 42. | Hackett | 4.6% | 10.7%(-6.14)#42 | 10.0%(-5.35)#4,435 |
| 43. | Campbell Station | 4.7% | 10.7%(-6.08)#43 | 10.0%(-5.30)#4,513 |
| 44. | Sherwood | 4.7% | 10.7%(-6.08)#44 | 10.0%(-5.29)#4,525 |
| 45. | Lavaca | 4.7% | 10.7%(-6.06)#45 | 10.0%(-5.28)#4,543 |
| 46. | East End | 4.7% | 10.7%(-6.03)#46 | 10.0%(-5.25)#4,578 |
| 47. | Greenland | 4.8% | 10.7%(-5.97)#47 | 10.0%(-5.19)#4,630 |
| 48. | Caldwell | 4.8% | 10.7%(-5.93)#48 | 10.0%(-5.14)#4,734 |
| 49. | Perla | 4.9% | 10.7%(-5.86)#49 | 10.0%(-5.07)#4,822 |
| 50. | Cave Springs | 4.9% | 10.7%(-5.79)#50 | 10.0%(-5.01)#4,918 |
| 51. | Biggers | 5.0% | 10.7%(-5.78)#51 | 10.0%(-4.99)#4,942 |
| 52. | Ward | 5.0% | 10.7%(-5.77)#52 | 10.0%(-4.99)#4,947 |
| 53. | Emerson | 5.0% | 10.7%(-5.73)#53 | 10.0%(-4.95)#4,994 |
| 54. | Rockport | 5.0% | 10.7%(-5.70)#54 | 10.0%(-4.92)#5,053 |
| 55. | Ravenden | 5.1% | 10.7%(-5.67)#55 | 10.0%(-4.89)#5,092 |
| 56. | Cedarville | 5.2% | 10.7%(-5.58)#56 | 10.0%(-4.79)#5,224 |
| 57. | Willisville | 5.2% | 10.7%(-5.56)#57 | 10.0%(-4.78)#5,246 |
| 58. | Alma | 5.2% | 10.7%(-5.55)#58 | 10.0%(-4.77)#5,261 |
| 59. | Thornton | 5.2% | 10.7%(-5.52)#59 | 10.0%(-4.73)#5,308 |
| 60. | Lowell | 5.5% | 10.7%(-5.28)#60 | 10.0%(-4.50)#5,684 |
| 61. | Farmington | 5.5% | 10.7%(-5.28)#61 | 10.0%(-4.50)#5,702 |
| 62. | Star City | 5.5% | 10.7%(-5.27)#62 | 10.0%(-4.49)#5,708 |
| 63. | Sparkman | 5.5% | 10.7%(-5.22)#63 | 10.0%(-4.44)#5,800 |
| 64. | Quitman | 5.6% | 10.7%(-5.18)#64 | 10.0%(-4.40)#5,861 |
| 65. | Peach Orchard | 5.6% | 10.7%(-5.18)#65 | 10.0%(-4.40)#5,893 |
| 66. | Gravette | 5.6% | 10.7%(-5.15)#66 | 10.0%(-4.37)#5,930 |
| 67. | Pollard | 5.7% | 10.7%(-5.07)#67 | 10.0%(-4.29)#6,055 |
| 68. | Hartford | 5.8% | 10.7%(-4.96)#68 | 10.0%(-4.18)#6,226 |
| 69. | Grubbs | 5.8% | 10.7%(-4.96)#69 | 10.0%(-4.18)#6,229 |
| 70. | Lead Hill | 5.9% | 10.7%(-4.85)#70 | 10.0%(-4.07)#6,427 |
| 71. | Fountain Hill | 5.9% | 10.7%(-4.85)#71 | 10.0%(-4.07)#6,444 |
| 72. | Allport | 5.9% | 10.7%(-4.85)#72 | 10.0%(-4.07)#6,454 |
| 73. | Rison | 6.0% | 10.7%(-4.78)#73 | 10.0%(-4.00)#6,538 |
| 74. | Hector | 6.0% | 10.7%(-4.78)#74 | 10.0%(-4.00)#6,543 |
| 75. | Ulm | 6.0% | 10.7%(-4.73)#75 | 10.0%(-3.95)#6,621 |
| 76. | Elkins | 6.0% | 10.7%(-4.73)#76 | 10.0%(-3.94)#6,626 |
| 77. | Fifty Six | 6.2% | 10.7%(-4.58)#77 | 10.0%(-3.80)#6,869 |
| 78. | Magazine | 6.3% | 10.7%(-4.42)#78 | 10.0%(-3.64)#7,113 |
| 79. | Griffithville | 6.5% | 10.7%(-4.28)#79 | 10.0%(-3.50)#7,301 |
| 80. | Calico Rock | 6.5% | 10.7%(-4.26)#80 | 10.0%(-3.48)#7,327 |
| 81. | Hot Springs Village | 6.5% | 10.7%(-4.18)#81 | 10.0%(-3.40)#7,439 |
| 82. | Highfill | 6.6% | 10.7%(-4.16)#82 | 10.0%(-3.38)#7,468 |
| 83. | Mcneil | 6.7% | 10.7%(-4.07)#83 | 10.0%(-3.29)#7,605 |
| 84. | Morrow | 6.7% | 10.7%(-4.07)#84 | 10.0%(-3.29)#7,614 |
| 85. | Jennette | 6.7% | 10.7%(-4.07)#85 | 10.0%(-3.29)#7,650 |
| 86. | Fayetteville | 6.7% | 10.7%(-3.99)#86 | 10.0%(-3.20)#7,758 |
| 87. | Earle | 6.9% | 10.7%(-3.80)#87 | 10.0%(-3.02)#8,015 |
| 88. | Bonanza | 7.1% | 10.7%(-3.59)#88 | 10.0%(-2.81)#8,314 |
| 89. | Fisher | 7.1% | 10.7%(-3.59)#89 | 10.0%(-2.81)#8,337 |
| 90. | Monette | 7.3% | 10.7%(-3.47)#90 | 10.0%(-2.69)#8,499 |
| 91. | Grady | 7.3% | 10.7%(-3.46)#91 | 10.0%(-2.68)#8,516 |
| 92. | Fountain Lake | 7.4% | 10.7%(-3.33)#92 | 10.0%(-2.54)#8,666 |
| 93. | Etowah | 7.4% | 10.7%(-3.33)#93 | 10.0%(-2.54)#8,676 |
| 94. | Valley Springs | 7.4% | 10.7%(-3.33)#94 | 10.0%(-2.54)#8,678 |
| 95. | Siloam Springs | 7.4% | 10.7%(-3.32)#95 | 10.0%(-2.54)#8,693 |
| 96. | Marion | 7.5% | 10.7%(-3.25)#96 | 10.0%(-2.47)#8,779 |
| 97. | Bellefonte | 7.5% | 10.7%(-3.19)#97 | 10.0%(-2.40)#8,875 |
| 98. | Lake City | 7.6% | 10.7%(-3.15)#98 | 10.0%(-2.37)#8,915 |
| 99. | Ash Flat | 7.6% | 10.7%(-3.14)#99 | 10.0%(-2.36)#8,928 |
| 100. | Van Buren | 7.7% | 10.7%(-3.04)#100 | 10.0%(-2.26)#9,045 |
Common Questions
What are the Top 10 Cities with the Lowest Poverty Level Among Seniors Over the Age of 65 in Arkansas?
Top 10 Cities with the Lowest Poverty Level Among Seniors Over the Age of 65 in Arkansas are:
#1
0.71%
#2
1.2%
#3
1.3%
#4
1.3%
#5
1.4%
#6
1.7%
#7
1.7%
#8
1.9%
#9
2.0%
#10
2.1%
What city has the Lowest Poverty Level Among Seniors Over the Age of 65 in Arkansas?
Garfield has the Lowest Poverty Level Among Seniors Over the Age of 65 in Arkansas with 0.71%.
What is the Poverty Level Among Seniors Over the Age of 65 in the State of Arkansas?
Poverty Level Among Seniors Over the Age of 65 in Arkansas is 10.7%.
What is the Poverty Level Among Seniors Over the Age of 65 in the United States?
Poverty Level Among Seniors Over the Age of 65 in the United States is 10.0%.