Cities with the Lowest Poverty Level Among Seniors Over the Age of 65 in Ohio
RELATED REPORTS & OPTIONS
Lowest Poverty | Seniors 65+
Ohio
Compare Cities
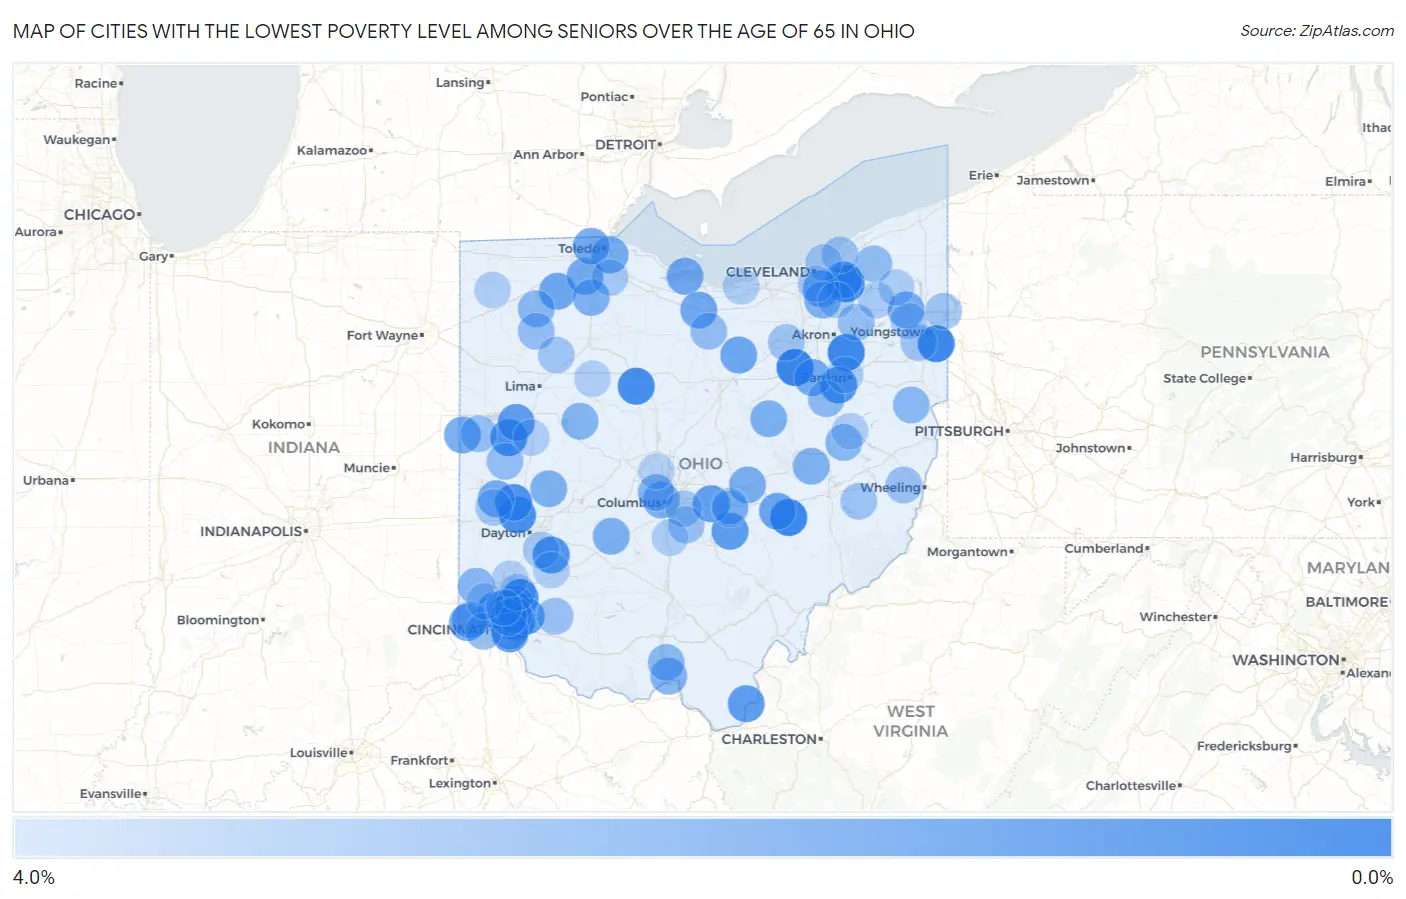
Map of Cities with the Lowest Poverty Level Among Seniors Over the Age of 65 in Ohio
4.0%
0.0%
Cities with the Lowest Poverty Level Among Seniors Over the Age of 65 in Ohio
| City | Senior Poverty | vs State | vs National | |
| 1. | Smithville | 0.64% | 9.1%(-8.43)#1 | 10.0%(-9.31)#115 |
| 2. | Philo | 0.70% | 9.1%(-8.36)#2 | 10.0%(-9.25)#142 |
| 3. | Uniontown | 0.72% | 9.1%(-8.35)#3 | 10.0%(-9.23)#150 |
| 4. | Bentleyville | 0.75% | 9.1%(-8.32)#4 | 10.0%(-9.21)#160 |
| 5. | Poland | 0.76% | 9.1%(-8.30)#5 | 10.0%(-9.19)#165 |
| 6. | Terrace Park | 0.79% | 9.1%(-8.28)#6 | 10.0%(-9.16)#173 |
| 7. | Harpster | 0.91% | 9.1%(-8.16)#7 | 10.0%(-9.04)#227 |
| 8. | Landen | 0.92% | 9.1%(-8.15)#8 | 10.0%(-9.03)#232 |
| 9. | Clayton | 0.98% | 9.1%(-8.09)#9 | 10.0%(-8.97)#270 |
| 10. | Minster | 1.0% | 9.1%(-8.02)#10 | 10.0%(-8.90)#312 |
| 11. | Rossmoyne | 1.1% | 9.1%(-8.01)#11 | 10.0%(-8.90)#314 |
| 12. | Richville | 1.1% | 9.1%(-7.96)#12 | 10.0%(-8.85)#344 |
| 13. | Spring Valley | 1.1% | 9.1%(-7.96)#13 | 10.0%(-8.85)#346 |
| 14. | West Milton | 1.1% | 9.1%(-7.93)#14 | 10.0%(-8.82)#361 |
| 15. | Fruit Hill | 1.2% | 9.1%(-7.91)#15 | 10.0%(-8.79)#380 |
| 16. | Sixteen Mile Stand | 1.2% | 9.1%(-7.89)#16 | 10.0%(-8.78)#394 |
| 17. | Wyoming | 1.2% | 9.1%(-7.88)#17 | 10.0%(-8.76)#405 |
| 18. | Moreland Hills | 1.2% | 9.1%(-7.84)#18 | 10.0%(-8.72)#434 |
| 19. | Crown City | 1.3% | 9.1%(-7.75)#19 | 10.0%(-8.64)#508 |
| 20. | Rushville | 1.3% | 9.1%(-7.73)#20 | 10.0%(-8.62)#524 |
| 21. | New Knoxville | 1.4% | 9.1%(-7.67)#21 | 10.0%(-8.55)#575 |
| 22. | Kirkersville | 1.4% | 9.1%(-7.65)#22 | 10.0%(-8.53)#591 |
| 23. | Mount Repose | 1.4% | 9.1%(-7.63)#23 | 10.0%(-8.51)#607 |
| 24. | Independence | 1.6% | 9.1%(-7.49)#24 | 10.0%(-8.38)#700 |
| 25. | South Zanesville | 1.6% | 9.1%(-7.46)#25 | 10.0%(-8.35)#731 |
| 26. | North Bend | 1.6% | 9.1%(-7.46)#26 | 10.0%(-8.35)#732 |
| 27. | Mcclure | 1.6% | 9.1%(-7.43)#27 | 10.0%(-8.31)#758 |
| 28. | Bailey Lakes | 1.6% | 9.1%(-7.43)#28 | 10.0%(-8.31)#761 |
| 29. | Montgomery | 1.7% | 9.1%(-7.38)#29 | 10.0%(-8.27)#795 |
| 30. | Bay View | 1.7% | 9.1%(-7.36)#30 | 10.0%(-8.25)#820 |
| 31. | Monroeville | 1.7% | 9.1%(-7.35)#31 | 10.0%(-8.23)#832 |
| 32. | Fort Recovery | 1.8% | 9.1%(-7.31)#32 | 10.0%(-8.20)#863 |
| 33. | Dalton | 1.8% | 9.1%(-7.31)#33 | 10.0%(-8.20)#864 |
| 34. | Haskins | 1.8% | 9.1%(-7.31)#34 | 10.0%(-8.20)#866 |
| 35. | Northwood | 1.8% | 9.1%(-7.30)#35 | 10.0%(-8.18)#878 |
| 36. | Ottawa Hills | 1.8% | 9.1%(-7.29)#36 | 10.0%(-8.17)#887 |
| 37. | Pitsburg | 1.8% | 9.1%(-7.28)#37 | 10.0%(-8.17)#896 |
| 38. | Leavittsburg | 1.8% | 9.1%(-7.27)#38 | 10.0%(-8.15)#902 |
| 39. | Hanover | 1.9% | 9.1%(-7.19)#39 | 10.0%(-8.07)#967 |
| 40. | Midway | 1.9% | 9.1%(-7.14)#40 | 10.0%(-8.03)#1,015 |
| 41. | Christiansburg | 1.9% | 9.1%(-7.12)#41 | 10.0%(-8.01)#1,033 |
| 42. | Glenmont | 2.0% | 9.1%(-7.10)#42 | 10.0%(-7.99)#1,059 |
| 43. | Grandview Heights | 2.0% | 9.1%(-7.08)#43 | 10.0%(-7.97)#1,084 |
| 44. | Brecksville | 2.0% | 9.1%(-7.07)#44 | 10.0%(-7.95)#1,089 |
| 45. | Portage | 2.0% | 9.1%(-7.07)#45 | 10.0%(-7.95)#1,094 |
| 46. | The Village Of Indian Hill | 2.0% | 9.1%(-7.06)#46 | 10.0%(-7.94)#1,104 |
| 47. | Rosemount | 2.0% | 9.1%(-7.02)#47 | 10.0%(-7.91)#1,118 |
| 48. | Plainfield | 2.0% | 9.1%(-7.02)#48 | 10.0%(-7.91)#1,129 |
| 49. | Upper Arlington | 2.1% | 9.1%(-7.01)#49 | 10.0%(-7.89)#1,146 |
| 50. | Belle Center | 2.1% | 9.1%(-6.98)#50 | 10.0%(-7.87)#1,171 |
| 51. | Millville | 2.1% | 9.1%(-6.94)#51 | 10.0%(-7.82)#1,206 |
| 52. | Holgate | 2.2% | 9.1%(-6.91)#52 | 10.0%(-7.80)#1,228 |
| 53. | Lucasville | 2.2% | 9.1%(-6.90)#53 | 10.0%(-7.79)#1,234 |
| 54. | Salineville | 2.2% | 9.1%(-6.88)#54 | 10.0%(-7.77)#1,261 |
| 55. | Gnadenhutten | 2.2% | 9.1%(-6.87)#55 | 10.0%(-7.75)#1,273 |
| 56. | Miami Heights | 2.2% | 9.1%(-6.86)#56 | 10.0%(-7.74)#1,282 |
| 57. | Sherwood | 2.2% | 9.1%(-6.83)#57 | 10.0%(-7.72)#1,309 |
| 58. | Beach City | 2.3% | 9.1%(-6.79)#58 | 10.0%(-7.68)#1,351 |
| 59. | Aquilla | 2.3% | 9.1%(-6.74)#59 | 10.0%(-7.63)#1,406 |
| 60. | Delshire | 2.3% | 9.1%(-6.73)#60 | 10.0%(-7.62)#1,412 |
| 61. | Russia | 2.4% | 9.1%(-6.70)#61 | 10.0%(-7.58)#1,444 |
| 62. | North Fairfield | 2.4% | 9.1%(-6.68)#62 | 10.0%(-7.57)#1,463 |
| 63. | Miller City | 2.4% | 9.1%(-6.68)#63 | 10.0%(-7.57)#1,476 |
| 64. | Brady Lake | 2.4% | 9.1%(-6.65)#64 | 10.0%(-7.54)#1,508 |
| 65. | St Henry | 2.4% | 9.1%(-6.64)#65 | 10.0%(-7.53)#1,512 |
| 66. | St Clairsville | 2.5% | 9.1%(-6.59)#66 | 10.0%(-7.48)#1,563 |
| 67. | Lithopolis | 2.5% | 9.1%(-6.59)#67 | 10.0%(-7.48)#1,564 |
| 68. | Lake Lorelei | 2.5% | 9.1%(-6.56)#68 | 10.0%(-7.44)#1,601 |
| 69. | Quaker City | 2.5% | 9.1%(-6.54)#69 | 10.0%(-7.43)#1,620 |
| 70. | Wickliffe | 2.5% | 9.1%(-6.53)#70 | 10.0%(-7.42)#1,625 |
| 71. | Westfield Center | 2.6% | 9.1%(-6.51)#71 | 10.0%(-7.39)#1,654 |
| 72. | Brookfield Center | 2.6% | 9.1%(-6.49)#72 | 10.0%(-7.38)#1,680 |
| 73. | Madeira | 2.6% | 9.1%(-6.49)#73 | 10.0%(-7.37)#1,681 |
| 74. | Canfield | 2.6% | 9.1%(-6.48)#74 | 10.0%(-7.37)#1,684 |
| 75. | Thornport | 2.6% | 9.1%(-6.45)#75 | 10.0%(-7.34)#1,722 |
| 76. | Pandora | 2.6% | 9.1%(-6.43)#76 | 10.0%(-7.32)#1,730 |
| 77. | Gordon | 2.6% | 9.1%(-6.43)#77 | 10.0%(-7.32)#1,749 |
| 78. | Brice | 2.6% | 9.1%(-6.43)#78 | 10.0%(-7.32)#1,753 |
| 79. | Luckey | 2.7% | 9.1%(-6.36)#79 | 10.0%(-7.25)#1,826 |
| 80. | Bratenahl | 2.7% | 9.1%(-6.36)#80 | 10.0%(-7.24)#1,839 |
| 81. | Bellbrook | 2.7% | 9.1%(-6.35)#81 | 10.0%(-7.24)#1,849 |
| 82. | Lordstown | 2.8% | 9.1%(-6.31)#82 | 10.0%(-7.19)#1,886 |
| 83. | Mason | 2.8% | 9.1%(-6.28)#83 | 10.0%(-7.17)#1,921 |
| 84. | Hiram | 2.8% | 9.1%(-6.27)#84 | 10.0%(-7.15)#1,929 |
| 85. | Brooklyn Heights | 2.8% | 9.1%(-6.25)#85 | 10.0%(-7.13)#1,945 |
| 86. | Midvale | 2.8% | 9.1%(-6.23)#86 | 10.0%(-7.11)#1,970 |
| 87. | Meyers Lake | 2.8% | 9.1%(-6.22)#87 | 10.0%(-7.11)#1,973 |
| 88. | Harbor Hills | 2.8% | 9.1%(-6.22)#88 | 10.0%(-7.11)#1,977 |
| 89. | West Farmington | 2.9% | 9.1%(-6.21)#89 | 10.0%(-7.09)#1,995 |
| 90. | Ney | 2.9% | 9.1%(-6.21)#90 | 10.0%(-7.09)#2,002 |
| 91. | Ashville | 2.9% | 9.1%(-6.20)#91 | 10.0%(-7.09)#2,018 |
| 92. | Pleasant Run | 2.9% | 9.1%(-6.20)#92 | 10.0%(-7.09)#2,020 |
| 93. | Anna | 2.9% | 9.1%(-6.19)#93 | 10.0%(-7.08)#2,025 |
| 94. | Vermilion | 2.9% | 9.1%(-6.19)#94 | 10.0%(-7.08)#2,030 |
| 95. | Monroe | 2.9% | 9.1%(-6.18)#95 | 10.0%(-7.07)#2,040 |
| 96. | Harveysburg | 2.9% | 9.1%(-6.17)#96 | 10.0%(-7.05)#2,053 |
| 97. | Macedonia | 2.9% | 9.1%(-6.15)#97 | 10.0%(-7.04)#2,068 |
| 98. | Dunkirk | 2.9% | 9.1%(-6.15)#98 | 10.0%(-7.04)#2,071 |
| 99. | Evendale | 3.0% | 9.1%(-6.09)#99 | 10.0%(-6.98)#2,149 |
| 100. | Powell | 3.0% | 9.1%(-6.05)#100 | 10.0%(-6.94)#2,194 |
Common Questions
What are the Top 10 Cities with the Lowest Poverty Level Among Seniors Over the Age of 65 in Ohio?
Top 10 Cities with the Lowest Poverty Level Among Seniors Over the Age of 65 in Ohio are:
#1
0.64%
#2
0.70%
#3
0.72%
#4
0.75%
#5
0.76%
#6
0.79%
#7
0.91%
#8
0.92%
#9
0.98%
#10
1.0%
What city has the Lowest Poverty Level Among Seniors Over the Age of 65 in Ohio?
Smithville has the Lowest Poverty Level Among Seniors Over the Age of 65 in Ohio with 0.64%.
What is the Poverty Level Among Seniors Over the Age of 65 in the State of Ohio?
Poverty Level Among Seniors Over the Age of 65 in Ohio is 9.1%.
What is the Poverty Level Among Seniors Over the Age of 65 in the United States?
Poverty Level Among Seniors Over the Age of 65 in the United States is 10.0%.