Cities with the Lowest Poverty Level Among Seniors Over the Age of 65 in South Carolina
RELATED REPORTS & OPTIONS
Lowest Poverty | Seniors 65+
South Carolina
Compare Cities
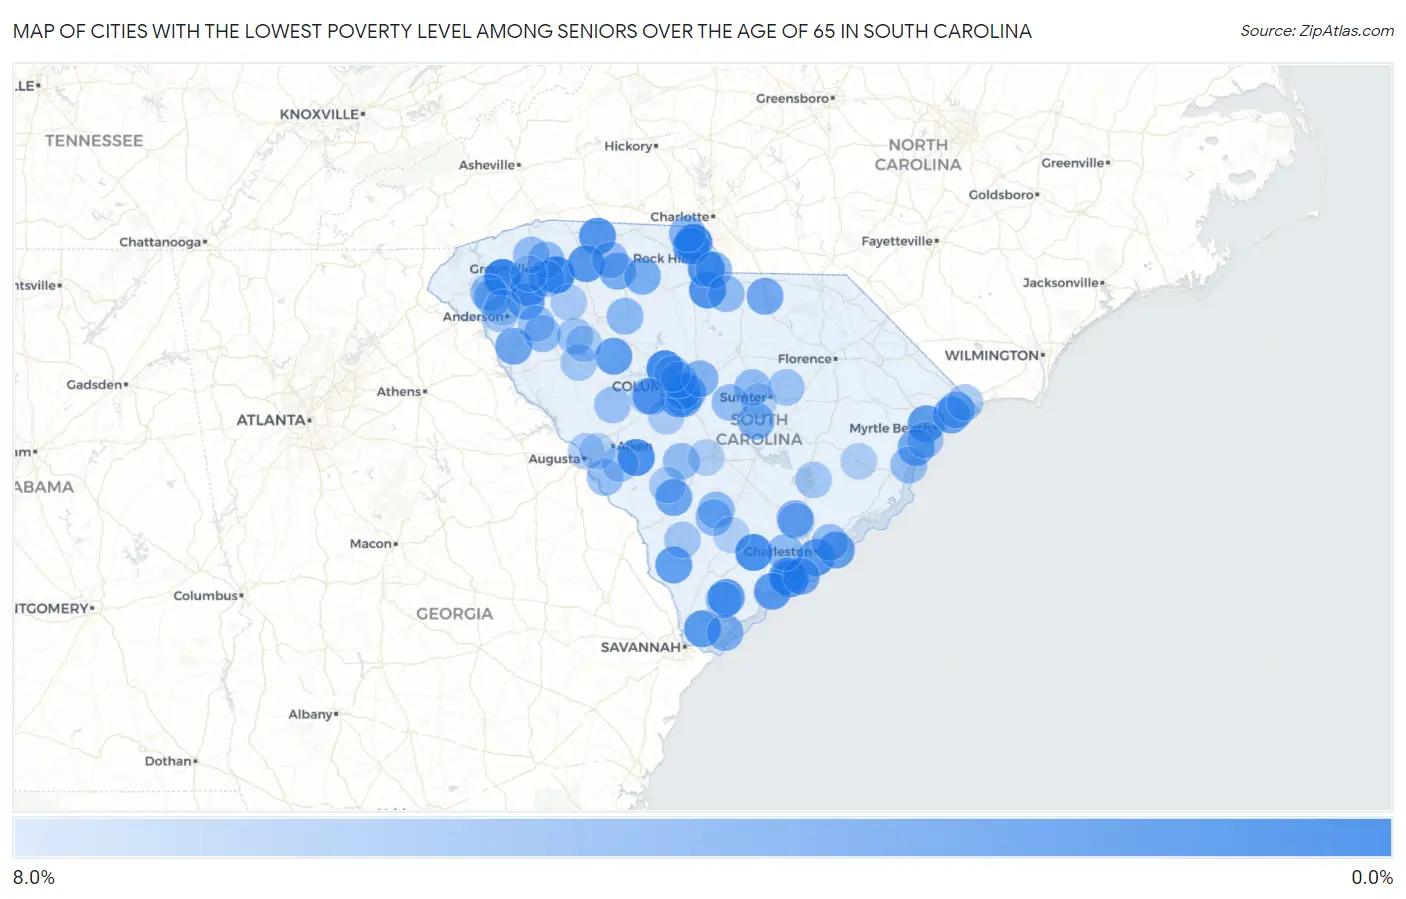
Map of Cities with the Lowest Poverty Level Among Seniors Over the Age of 65 in South Carolina
8.0%
0.0%
Cities with the Lowest Poverty Level Among Seniors Over the Age of 65 in South Carolina
| City | Senior Poverty | vs State | vs National | |
| 1. | Liberty | 0.16% | 10.3%(-10.1)#1 | 10.0%(-9.80)#8 |
| 2. | Five Forks | 0.33% | 10.3%(-9.98)#2 | 10.0%(-9.63)#45 |
| 3. | Fripp Island | 0.67% | 10.3%(-9.64)#3 | 10.0%(-9.29)#125 |
| 4. | Tega Cay | 0.69% | 10.3%(-9.61)#4 | 10.0%(-9.26)#136 |
| 5. | Lake Murray Of Richland | 0.83% | 10.3%(-9.48)#5 | 10.0%(-9.12)#190 |
| 6. | Seabrook Island | 1.1% | 10.3%(-9.20)#6 | 10.0%(-8.85)#341 |
| 7. | Jacksonboro | 1.3% | 10.3%(-9.05)#7 | 10.0%(-8.70)#447 |
| 8. | Windsor | 1.3% | 10.3%(-8.99)#8 | 10.0%(-8.64)#510 |
| 9. | Beech Island | 1.4% | 10.3%(-8.91)#9 | 10.0%(-8.56)#562 |
| 10. | The Cliffs Valley | 1.5% | 10.3%(-8.79)#10 | 10.0%(-8.44)#658 |
| 11. | Fort Lawn | 1.6% | 10.3%(-8.68)#11 | 10.0%(-8.33)#753 |
| 12. | Mayo | 1.8% | 10.3%(-8.54)#12 | 10.0%(-8.18)#874 |
| 13. | Roebuck | 1.9% | 10.3%(-8.41)#13 | 10.0%(-8.06)#985 |
| 14. | Catawba | 2.0% | 10.3%(-8.34)#14 | 10.0%(-7.99)#1,049 |
| 15. | Beaufort | 2.0% | 10.3%(-8.32)#15 | 10.0%(-7.97)#1,082 |
| 16. | Bluffton | 2.1% | 10.3%(-8.22)#16 | 10.0%(-7.87)#1,181 |
| 17. | James Island | 2.1% | 10.3%(-8.17)#17 | 10.0%(-7.81)#1,220 |
| 18. | Rockville | 2.2% | 10.3%(-8.13)#18 | 10.0%(-7.78)#1,251 |
| 19. | India Hook | 2.2% | 10.3%(-8.12)#19 | 10.0%(-7.76)#1,265 |
| 20. | Piedmont | 2.2% | 10.3%(-8.06)#20 | 10.0%(-7.71)#1,317 |
| 21. | Edisto Beach | 2.3% | 10.3%(-8.02)#21 | 10.0%(-7.67)#1,360 |
| 22. | Forestbrook | 2.3% | 10.3%(-7.99)#22 | 10.0%(-7.64)#1,389 |
| 23. | Furman | 2.5% | 10.3%(-7.80)#23 | 10.0%(-7.45)#1,585 |
| 24. | Silverstreet | 2.5% | 10.3%(-7.80)#24 | 10.0%(-7.45)#1,594 |
| 25. | South Congaree | 2.7% | 10.3%(-7.65)#25 | 10.0%(-7.29)#1,775 |
| 26. | Gilbert | 2.7% | 10.3%(-7.60)#26 | 10.0%(-7.25)#1,827 |
| 27. | Isle Of Palms | 2.7% | 10.3%(-7.57)#27 | 10.0%(-7.21)#1,865 |
| 28. | Briarcliffe Acres | 3.0% | 10.3%(-7.35)#28 | 10.0%(-7.00)#2,130 |
| 29. | Williamston | 3.0% | 10.3%(-7.29)#29 | 10.0%(-6.94)#2,188 |
| 30. | Fairview Crossroads | 3.0% | 10.3%(-7.29)#30 | 10.0%(-6.94)#2,190 |
| 31. | Cayce | 3.1% | 10.3%(-7.22)#31 | 10.0%(-6.86)#2,285 |
| 32. | Olar | 3.1% | 10.3%(-7.18)#32 | 10.0%(-6.83)#2,343 |
| 33. | Kiawah Island | 3.2% | 10.3%(-7.06)#33 | 10.0%(-6.71)#2,500 |
| 34. | Lake Secession | 3.3% | 10.3%(-7.04)#34 | 10.0%(-6.69)#2,522 |
| 35. | Jefferson | 3.3% | 10.3%(-6.97)#35 | 10.0%(-6.62)#2,617 |
| 36. | Murrells Inlet | 3.5% | 10.3%(-6.83)#36 | 10.0%(-6.48)#2,815 |
| 37. | Keowee Key | 3.5% | 10.3%(-6.76)#37 | 10.0%(-6.41)#2,907 |
| 38. | Pine Ridge | 3.6% | 10.3%(-6.72)#38 | 10.0%(-6.37)#2,983 |
| 39. | Springdale | 3.7% | 10.3%(-6.57)#39 | 10.0%(-6.22)#3,186 |
| 40. | Sangaree | 3.8% | 10.3%(-6.49)#40 | 10.0%(-6.14)#3,286 |
| 41. | Jonesville | 3.9% | 10.3%(-6.41)#41 | 10.0%(-6.06)#3,383 |
| 42. | Lockhart | 3.9% | 10.3%(-6.38)#42 | 10.0%(-6.03)#3,427 |
| 43. | Seven Oaks | 4.1% | 10.3%(-6.22)#43 | 10.0%(-5.87)#3,645 |
| 44. | Pinewood | 4.1% | 10.3%(-6.22)#44 | 10.0%(-5.87)#3,652 |
| 45. | Hilton Head Island | 4.2% | 10.3%(-6.09)#45 | 10.0%(-5.74)#3,847 |
| 46. | North Myrtle Beach | 4.2% | 10.3%(-6.07)#46 | 10.0%(-5.72)#3,872 |
| 47. | Arcadia Lakes | 4.6% | 10.3%(-5.73)#47 | 10.0%(-5.38)#4,412 |
| 48. | Lake Wylie | 4.6% | 10.3%(-5.69)#48 | 10.0%(-5.34)#4,447 |
| 49. | Pendleton | 4.7% | 10.3%(-5.58)#49 | 10.0%(-5.23)#4,594 |
| 50. | Van Wyck | 4.8% | 10.3%(-5.54)#50 | 10.0%(-5.19)#4,636 |
| 51. | Taylors | 4.9% | 10.3%(-5.43)#51 | 10.0%(-5.08)#4,804 |
| 52. | Smoaks | 4.9% | 10.3%(-5.42)#52 | 10.0%(-5.07)#4,827 |
| 53. | Whitmire | 4.9% | 10.3%(-5.36)#53 | 10.0%(-5.01)#4,920 |
| 54. | Ravenel | 5.1% | 10.3%(-5.23)#54 | 10.0%(-4.88)#5,107 |
| 55. | Oakland | 5.1% | 10.3%(-5.19)#55 | 10.0%(-4.84)#5,163 |
| 56. | Donalds | 5.1% | 10.3%(-5.17)#56 | 10.0%(-4.82)#5,181 |
| 57. | Williams | 5.1% | 10.3%(-5.17)#57 | 10.0%(-4.82)#5,184 |
| 58. | Central Pacolet | 5.1% | 10.3%(-5.17)#58 | 10.0%(-4.82)#5,185 |
| 59. | Elgin | 5.3% | 10.3%(-4.97)#59 | 10.0%(-4.62)#5,496 |
| 60. | Norway | 5.3% | 10.3%(-4.97)#60 | 10.0%(-4.62)#5,506 |
| 61. | Clemson | 5.3% | 10.3%(-4.97)#61 | 10.0%(-4.62)#5,510 |
| 62. | Eastover | 5.4% | 10.3%(-4.93)#62 | 10.0%(-4.58)#5,558 |
| 63. | Mauldin | 5.4% | 10.3%(-4.92)#63 | 10.0%(-4.57)#5,573 |
| 64. | Mount Pleasant | 5.4% | 10.3%(-4.90)#64 | 10.0%(-4.55)#5,597 |
| 65. | Pawleys Island | 5.4% | 10.3%(-4.90)#65 | 10.0%(-4.55)#5,628 |
| 66. | Travelers Rest | 5.5% | 10.3%(-4.80)#66 | 10.0%(-4.45)#5,772 |
| 67. | Jackson | 5.7% | 10.3%(-4.63)#67 | 10.0%(-4.28)#6,074 |
| 68. | Ward | 5.7% | 10.3%(-4.59)#68 | 10.0%(-4.24)#6,131 |
| 69. | Surfside Beach | 5.8% | 10.3%(-4.54)#69 | 10.0%(-4.19)#6,207 |
| 70. | Honea Path | 5.9% | 10.3%(-4.44)#70 | 10.0%(-4.09)#6,371 |
| 71. | Mayesville | 5.9% | 10.3%(-4.42)#71 | 10.0%(-4.07)#6,413 |
| 72. | Waterloo | 5.9% | 10.3%(-4.42)#72 | 10.0%(-4.07)#6,431 |
| 73. | Hilltop | 5.9% | 10.3%(-4.38)#73 | 10.0%(-4.03)#6,494 |
| 74. | Burton | 5.9% | 10.3%(-4.37)#74 | 10.0%(-4.02)#6,514 |
| 75. | Carolina Forest | 5.9% | 10.3%(-4.37)#75 | 10.0%(-4.01)#6,519 |
| 76. | Centerville | 6.1% | 10.3%(-4.21)#76 | 10.0%(-3.86)#6,751 |
| 77. | Irmo | 6.1% | 10.3%(-4.17)#77 | 10.0%(-3.82)#6,821 |
| 78. | Hampton | 6.2% | 10.3%(-4.14)#78 | 10.0%(-3.79)#6,875 |
| 79. | Ninety Six | 6.2% | 10.3%(-4.13)#79 | 10.0%(-3.78)#6,897 |
| 80. | Little River | 6.2% | 10.3%(-4.10)#80 | 10.0%(-3.75)#6,929 |
| 81. | New Ellenton | 6.2% | 10.3%(-4.08)#81 | 10.0%(-3.73)#6,965 |
| 82. | Bonneau | 6.4% | 10.3%(-3.92)#82 | 10.0%(-3.57)#7,201 |
| 83. | East Camden | 6.4% | 10.3%(-3.90)#83 | 10.0%(-3.55)#7,229 |
| 84. | Hilda | 6.5% | 10.3%(-3.85)#84 | 10.0%(-3.50)#7,293 |
| 85. | Dacusville | 6.5% | 10.3%(-3.82)#85 | 10.0%(-3.47)#7,353 |
| 86. | Ladson | 6.5% | 10.3%(-3.76)#86 | 10.0%(-3.41)#7,433 |
| 87. | Pelion | 6.6% | 10.3%(-3.75)#87 | 10.0%(-3.39)#7,446 |
| 88. | Cross Hill | 6.6% | 10.3%(-3.75)#88 | 10.0%(-3.39)#7,448 |
| 89. | North Augusta | 6.6% | 10.3%(-3.71)#89 | 10.0%(-3.36)#7,489 |
| 90. | Summit | 6.6% | 10.3%(-3.70)#90 | 10.0%(-3.35)#7,511 |
| 91. | Gray Court | 6.6% | 10.3%(-3.69)#91 | 10.0%(-3.34)#7,521 |
| 92. | Andrews | 6.8% | 10.3%(-3.45)#92 | 10.0%(-3.10)#7,896 |
| 93. | Edisto | 6.9% | 10.3%(-3.43)#93 | 10.0%(-3.08)#7,929 |
| 94. | Walterboro | 7.0% | 10.3%(-3.28)#94 | 10.0%(-2.93)#8,150 |
| 95. | Cateechee | 7.1% | 10.3%(-3.20)#95 | 10.0%(-2.85)#8,242 |
| 96. | Welcome | 7.1% | 10.3%(-3.18)#96 | 10.0%(-2.83)#8,268 |
| 97. | Burnettown | 7.1% | 10.3%(-3.17)#97 | 10.0%(-2.82)#8,274 |
| 98. | Cane Savannah | 7.3% | 10.3%(-3.03)#98 | 10.0%(-2.68)#8,507 |
| 99. | Litchfield Beach | 7.3% | 10.3%(-3.02)#99 | 10.0%(-2.67)#8,524 |
| 100. | Northlake | 7.3% | 10.3%(-3.00)#100 | 10.0%(-2.65)#8,547 |
Common Questions
What are the Top 10 Cities with the Lowest Poverty Level Among Seniors Over the Age of 65 in South Carolina?
Top 10 Cities with the Lowest Poverty Level Among Seniors Over the Age of 65 in South Carolina are:
#1
0.16%
#2
0.33%
#3
0.69%
#4
0.83%
#5
1.1%
#6
1.3%
#7
1.3%
#8
1.6%
#9
1.8%
#10
1.9%
What city has the Lowest Poverty Level Among Seniors Over the Age of 65 in South Carolina?
Liberty has the Lowest Poverty Level Among Seniors Over the Age of 65 in South Carolina with 0.16%.
What is the Poverty Level Among Seniors Over the Age of 65 in the State of South Carolina?
Poverty Level Among Seniors Over the Age of 65 in South Carolina is 10.3%.
What is the Poverty Level Among Seniors Over the Age of 65 in the United States?
Poverty Level Among Seniors Over the Age of 65 in the United States is 10.0%.