Cities with the Lowest Poverty Level Among Seniors Over the Age of 65 in the United States
RELATED REPORTS & OPTIONS
Lowest Poverty | Seniors 65+
United States
Compare Cities
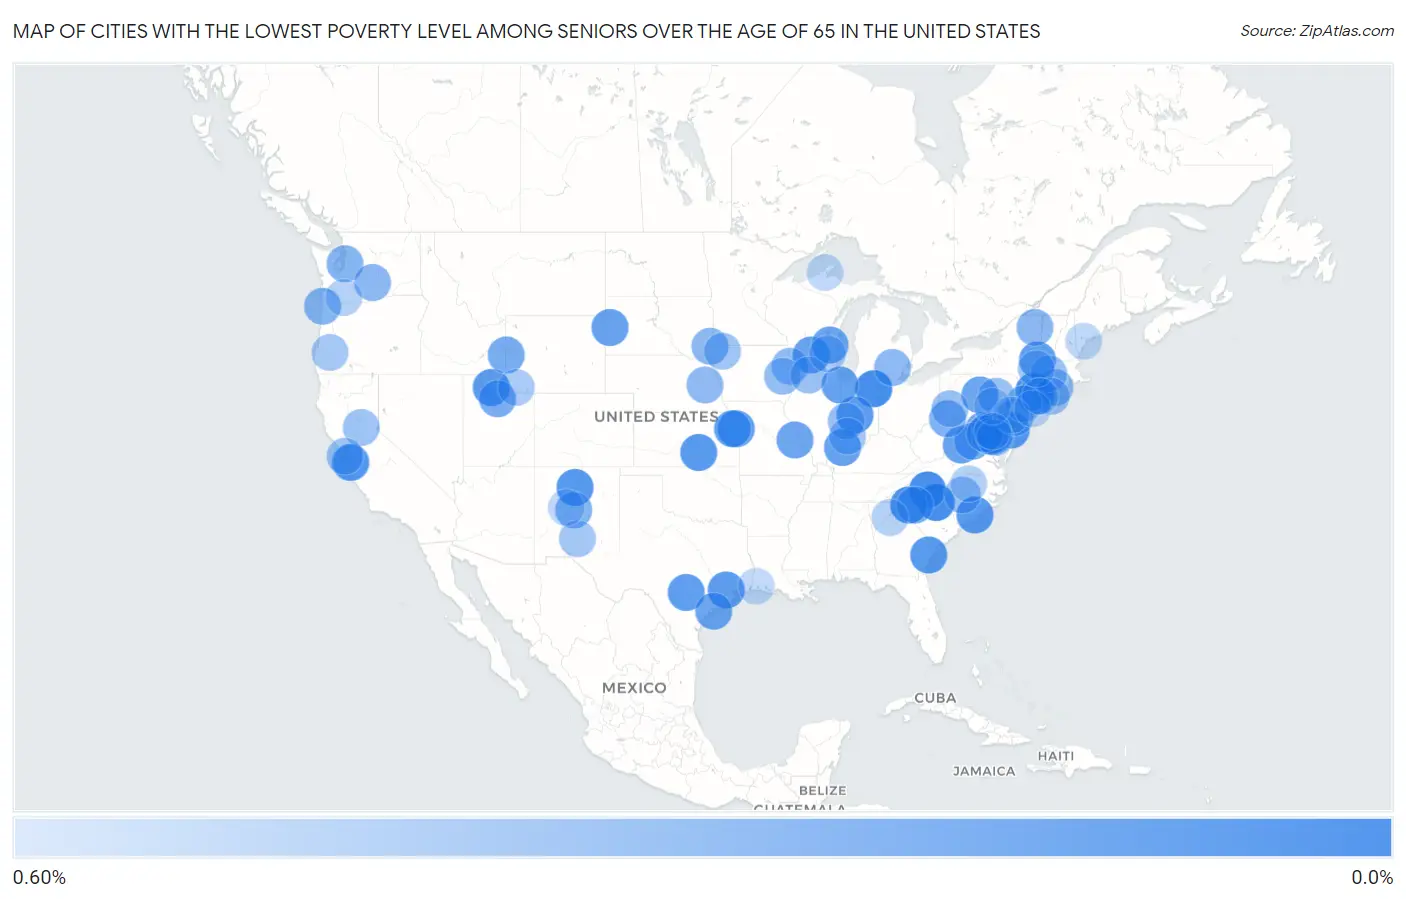
Map of Cities with the Lowest Poverty Level Among Seniors Over the Age of 65 in the United States
0.60%
0.0%
Cities with the Lowest Poverty Level Among Seniors Over the Age of 65 in the United States
| City | Senior Poverty | vs State | vs National | |
| 1. | Woodburn | 0.093% | 8.0%(-7.91)#1 | 10.0%(-9.86)#1 |
| 2. | Harrington Park Borough | 0.11% | 9.1%(-8.96)#1 | 10.0%(-9.84)#2 |
| 3. | Hopelawn | 0.12% | 9.1%(-8.95)#2 | 10.0%(-9.83)#3 |
| 4. | Marvin | 0.13% | 9.8%(-9.63)#1 | 10.0%(-9.82)#4 |
| 5. | Huntertown | 0.13% | 8.1%(-8.02)#1 | 10.0%(-9.82)#5 |
| 6. | Mountain View | 0.14% | 9.8%(-9.62)#2 | 10.0%(-9.81)#6 |
| 7. | Pines Lake | 0.15% | 9.1%(-8.92)#3 | 10.0%(-9.80)#7 |
| 8. | Liberty | 0.16% | 10.3%(-10.1)#1 | 10.0%(-9.80)#8 |
| 9. | Valley Cottage | 0.16% | 12.2%(-12.0)#1 | 10.0%(-9.79)#9 |
| 10. | Ho Ho Kus Borough | 0.17% | 9.1%(-8.90)#4 | 10.0%(-9.78)#10 |
| 11. | White Rock | 0.19% | 12.9%(-12.7)#1 | 10.0%(-9.76)#11 |
| 12. | Belville | 0.19% | 9.8%(-9.56)#3 | 10.0%(-9.76)#12 |
| 13. | Riverview | 0.19% | 6.5%(-6.35)#1 | 10.0%(-9.76)#13 |
| 14. | Seaville | 0.20% | 9.1%(-8.88)#5 | 10.0%(-9.76)#14 |
| 15. | Richmond Hill | 0.20% | 10.3%(-10.1)#1 | 10.0%(-9.75)#15 |
| 16. | Maize | 0.20% | 8.2%(-8.03)#1 | 10.0%(-9.75)#16 |
| 17. | Farr West | 0.20% | 6.6%(-6.36)#1 | 10.0%(-9.75)#17 |
| 18. | Bunker Hill Village | 0.21% | 11.4%(-11.2)#1 | 10.0%(-9.74)#18 |
| 19. | Kings Point | 0.21% | 12.2%(-12.0)#2 | 10.0%(-9.74)#19 |
| 20. | Pittsboro | 0.22% | 8.1%(-7.93)#2 | 10.0%(-9.73)#20 |
| 21. | Dorothy | 0.22% | 9.1%(-8.85)#6 | 10.0%(-9.73)#21 |
| 22. | Braddock | 0.22% | 8.0%(-7.78)#2 | 10.0%(-9.73)#22 |
| 23. | Villanova | 0.22% | 8.9%(-8.67)#1 | 10.0%(-9.73)#23 |
| 24. | Edwardsville | 0.22% | 8.2%(-8.00)#2 | 10.0%(-9.73)#24 |
| 25. | Green Island | 0.23% | 12.2%(-11.9)#3 | 10.0%(-9.73)#25 |
| 26. | Selma | 0.23% | 11.4%(-11.2)#2 | 10.0%(-9.73)#26 |
| 27. | El Sobrante Cdp Riverside County | 0.24% | 11.0%(-10.8)#1 | 10.0%(-9.72)#27 |
| 28. | Verona | 0.24% | 8.1%(-7.90)#1 | 10.0%(-9.71)#28 |
| 29. | Chandler | 0.24% | 8.1%(-7.91)#3 | 10.0%(-9.71)#29 |
| 30. | Willowbrook | 0.24% | 9.4%(-9.16)#1 | 10.0%(-9.71)#30 |
| 31. | Verona | 0.24% | 8.0%(-7.76)#3 | 10.0%(-9.71)#31 |
| 32. | Deadwood | 0.24% | 9.3%(-9.02)#1 | 10.0%(-9.71)#32 |
| 33. | Kewaskum | 0.25% | 8.1%(-7.89)#2 | 10.0%(-9.70)#33 |
| 34. | Tonganoxie | 0.26% | 8.2%(-7.97)#3 | 10.0%(-9.70)#34 |
| 35. | Baden | 0.26% | 8.5%(-8.26)#1 | 10.0%(-9.69)#35 |
| 36. | Zion | 0.26% | 8.9%(-8.63)#2 | 10.0%(-9.69)#36 |
| 37. | Veazie | 0.27% | 9.0%(-8.76)#1 | 10.0%(-9.68)#37 |
| 38. | Port O Connor | 0.27% | 11.4%(-11.1)#3 | 10.0%(-9.68)#38 |
| 39. | Pacific | 0.27% | 9.5%(-9.23)#1 | 10.0%(-9.68)#39 |
| 40. | Countryside | 0.29% | 8.0%(-7.72)#4 | 10.0%(-9.66)#40 |
| 41. | Cabin John | 0.30% | 8.5%(-8.22)#2 | 10.0%(-9.65)#41 |
| 42. | Star Valley Ranch | 0.30% | 7.7%(-7.41)#1 | 10.0%(-9.65)#42 |
| 43. | Brightwood | 0.31% | 8.0%(-7.70)#5 | 10.0%(-9.64)#43 |
| 44. | Summit Park | 0.31% | 6.6%(-6.25)#2 | 10.0%(-9.64)#44 |
| 45. | Five Forks | 0.33% | 10.3%(-9.98)#2 | 10.0%(-9.63)#45 |
| 46. | Monte Sereno | 0.33% | 11.0%(-10.7)#2 | 10.0%(-9.62)#46 |
| 47. | Star City | 0.34% | 10.6%(-10.3)#1 | 10.0%(-9.61)#47 |
| 48. | Croom | 0.34% | 8.5%(-8.18)#3 | 10.0%(-9.61)#48 |
| 49. | Mountainair | 0.34% | 12.9%(-12.6)#2 | 10.0%(-9.61)#49 |
| 50. | Morris Plains Borough | 0.35% | 9.1%(-8.72)#7 | 10.0%(-9.60)#50 |
| 51. | Boulevard Park | 0.36% | 8.1%(-7.72)#1 | 10.0%(-9.59)#51 |
| 52. | Netarts | 0.36% | 8.8%(-8.43)#1 | 10.0%(-9.59)#52 |
| 53. | Terrace Heights | 0.37% | 8.1%(-7.70)#2 | 10.0%(-9.58)#53 |
| 54. | Harrisburg | 0.38% | 9.3%(-8.89)#2 | 10.0%(-9.57)#54 |
| 55. | Hillandale | 0.38% | 8.5%(-8.14)#4 | 10.0%(-9.57)#55 |
| 56. | Wilmington | 0.38% | 12.2%(-11.8)#4 | 10.0%(-9.57)#56 |
| 57. | Dexter | 0.38% | 9.0%(-8.58)#1 | 10.0%(-9.57)#57 |
| 58. | Schuyler | 0.39% | 8.4%(-7.99)#1 | 10.0%(-9.56)#58 |
| 59. | Accokeek | 0.39% | 8.5%(-8.13)#5 | 10.0%(-9.56)#59 |
| 60. | Saybrook Manor | 0.39% | 7.9%(-7.55)#1 | 10.0%(-9.56)#60 |
| 61. | Farley | 0.40% | 7.7%(-7.32)#1 | 10.0%(-9.55)#61 |
| 62. | Mullica Hill | 0.40% | 9.1%(-8.67)#8 | 10.0%(-9.55)#62 |
| 63. | Ely | 0.41% | 7.7%(-7.30)#2 | 10.0%(-9.54)#63 |
| 64. | Milledgeville | 0.42% | 9.4%(-8.98)#2 | 10.0%(-9.53)#64 |
| 65. | Brazil | 0.43% | 8.1%(-7.72)#4 | 10.0%(-9.53)#65 |
| 66. | Elysburg | 0.43% | 8.9%(-8.46)#3 | 10.0%(-9.53)#66 |
| 67. | North Granby | 0.43% | 7.9%(-7.52)#2 | 10.0%(-9.52)#67 |
| 68. | Northampton | 0.43% | 12.2%(-11.7)#5 | 10.0%(-9.52)#68 |
| 69. | Fellsburg | 0.43% | 8.9%(-8.46)#4 | 10.0%(-9.52)#69 |
| 70. | Mamers | 0.43% | 9.8%(-9.33)#4 | 10.0%(-9.52)#70 |
| 71. | Cambrian Park | 0.44% | 11.0%(-10.6)#3 | 10.0%(-9.51)#71 |
| 72. | Fairfax Station | 0.44% | 8.0%(-7.57)#6 | 10.0%(-9.51)#72 |
| 73. | Penn Valley | 0.44% | 11.0%(-10.6)#4 | 10.0%(-9.51)#73 |
| 74. | Hillsborough | 0.44% | 11.0%(-10.6)#5 | 10.0%(-9.51)#74 |
| 75. | Blackwells Mills | 0.44% | 9.1%(-8.63)#9 | 10.0%(-9.51)#75 |
| 76. | Sheldon | 0.45% | 7.7%(-7.26)#3 | 10.0%(-9.50)#76 |
| 77. | Boles Acres | 0.47% | 12.9%(-12.4)#3 | 10.0%(-9.49)#77 |
| 78. | Montgomery | 0.47% | 8.1%(-7.68)#5 | 10.0%(-9.49)#78 |
| 79. | Winston | 0.47% | 8.8%(-8.32)#2 | 10.0%(-9.48)#79 |
| 80. | Arden | 0.47% | 6.5%(-6.08)#2 | 10.0%(-9.48)#80 |
| 81. | Stottville | 0.47% | 12.2%(-11.7)#6 | 10.0%(-9.48)#81 |
| 82. | Lyman | 0.48% | 7.7%(-7.23)#2 | 10.0%(-9.47)#82 |
| 83. | Nashotah | 0.50% | 8.1%(-7.64)#3 | 10.0%(-9.45)#83 |
| 84. | Yacolt | 0.52% | 8.1%(-7.56)#3 | 10.0%(-9.43)#84 |
| 85. | Huntingtown | 0.52% | 8.5%(-8.00)#6 | 10.0%(-9.43)#85 |
| 86. | Bakersfield Country Club | 0.52% | 11.0%(-10.5)#6 | 10.0%(-9.43)#86 |
| 87. | Suwanee | 0.52% | 10.3%(-9.80)#2 | 10.0%(-9.43)#87 |
| 88. | Youngsville | 0.52% | 9.8%(-9.23)#5 | 10.0%(-9.43)#88 |
| 89. | Kinnelon Borough | 0.53% | 9.1%(-8.55)#10 | 10.0%(-9.43)#89 |
| 90. | Frazer | 0.53% | 8.9%(-8.36)#5 | 10.0%(-9.42)#90 |
| 91. | Clear Lake Cdp Pierce County | 0.54% | 8.1%(-7.54)#4 | 10.0%(-9.41)#91 |
| 92. | Difficult Run | 0.54% | 8.0%(-7.46)#7 | 10.0%(-9.41)#92 |
| 93. | Paxtonia | 0.55% | 8.9%(-8.34)#6 | 10.0%(-9.40)#93 |
| 94. | Little Falls | 0.56% | 9.0%(-8.47)#2 | 10.0%(-9.40)#94 |
| 95. | Sausal | 0.56% | 12.9%(-12.4)#4 | 10.0%(-9.40)#95 |
| 96. | Houghton | 0.56% | 9.0%(-8.41)#2 | 10.0%(-9.39)#96 |
| 97. | Hackberry | 0.56% | 13.6%(-13.0)#1 | 10.0%(-9.39)#97 |
| 98. | West Belmar | 0.56% | 9.1%(-8.51)#11 | 10.0%(-9.39)#98 |
| 99. | Laurel Hollow | 0.57% | 12.2%(-11.6)#7 | 10.0%(-9.38)#99 |
| 100. | Lanham | 0.58% | 8.5%(-7.94)#7 | 10.0%(-9.37)#100 |
Common Questions
What are the Top 10 Cities with the Lowest Poverty Level Among Seniors Over the Age of 65 in the United States?
Top 10 Cities with the Lowest Poverty Level Among Seniors Over the Age of 65 in the United States are:
#1
0.093%
#2
0.13%
#3
0.13%
#4
0.14%
#5
0.16%
#6
0.16%
#7
0.19%
#8
0.19%
#9
0.19%
#10
0.20%
What city has the Lowest Poverty Level Among Seniors Over the Age of 65 in the United States?
Woodburn has the Lowest Poverty Level Among Seniors Over the Age of 65 in the United States with 0.093%.
What is the Poverty Level Among Seniors Over the Age of 65 in the United States?
Poverty Level Among Seniors Over the Age of 65 in the United States is 10.0%.